Feeds:
Posts
Comments

Archive for the ‘Offshore Energy – General’ Category

Image of Who Is Dolly Gee? A Look at the Judge Deciding the Fate of Trump’s Executive Order - The New York Times
Federal Judge Dolly Gee, Central District of California

Sable Offshore and Exxon had alleged that Santa Barbara County’s refusal to transfer title and permits for Santa Ynez Unit facilities from Exxon to Sable amounted to an unconstitutional taking of their property rights. Judge Gee disagreed.

As colorfully put by Nick Welsh at the Santa Barbara Independent, Judge Gee told Sable and Exxon to “go pound sand” (not literally, but the judicial equivalent). The judge refused to even allow Sable to amend their filing. The judge will however allow Exxon to file an amended complaint, given that the company still has vested rights to the facilities and is still on the hook for the decommissioning costs.

As always with these Santa Ynez Unit matters, there is much more to come!

Read Full Post »

World Bank global flaring estimates are now derived from 3 satellites carrying NOAA VIIRS detectors. The increased number of observations improves the precision and accuracy of the flare locations and volume estimates.

The World Bank (WB) Global Gas Flaring Tracker is the only worldwide flaring data source. Offshore and onshore data are segmented, so offshore flaring can be considered separately for each country.

The WB estimates that 21600.03 million cu m (762.5 bcf) of gas were flared at offshore locations worldwide in 2025. This is an increase from 2024 when the total offshore flaring volume was 21159.91 million cu m.

The flaring totals for prominent offshore producers are entered in the table below. Also included are the largest offshore flares for each country.

Unsurprisingly, Norway led the pack in minimizing offshore flaring. Their total of 36.11 million cu m (1.3 bcf) is very impressive for such a large producer. The US offshore total of 160.95 cu m (5.7 bcf) is also quite respectable relative to production.

At the other end of the scale are Iran – 3329 million cu m (118 bcf), Nigeria – 2566 (91 bcf), Angola – 2300 (81 bcf), and Mexico 2068 (73 bcf). These 4 countries accounted for nearly half of all 2025 offshore flaring. They were also massive offshore flarers in 2024: Iran – 3753 million cu m, Nigeria – 2867, Angola – 2040, and Mexico – 2223.

If both onshore and offshore flaring are considered, Iran flared 29931 million cu m in 2025. That equates to 1.057 trillion cu ft!

2025 WB flaring total
million cu meters
largest flarelargest flare volume
Angola2300.26Lombo East862.02
Australia268.36Santos61.89
Brazil969.16Albacora Leste118.93
Canada145.12Terra Nova95.83
China535.56Weizhou 12-168.26
Congo, Rep.788.98Kitina384.12
Gabon368.91Tchatamba Marin37.46
Ghana351.81Sankofa East184.97
Guyana227.38Yellowtail164.06
Indonesia292.16Belida30.84
Iran3329.19Foroozan1360.09
Libya313.78Bouri74.07
Malaysia1459.32Kasawari205.8
Mexico2067.62Akal386.44
Nigeria2565.88Oso308.37
Norway36.11Balder6.38
Qatar688.19Ras Laffan LNG54.65
Russia227.27Yuri Korchagin82.07
Trinidad87.66Atlantic LNG53.23
UK234.08Penguins22.94
US160.95NA*22.77
*The WB lists the field name for the largest US flare as NA. The lat/long for the Whale deepwater platform in the Western Gulf matches the identified flare location (26.22 lat., -94.67 long.)

The WB tracker identifies the Gulf of America facilities with the highest flaring volumes. The 2025 list is pasted below. Repeat top ten Gulf flarers from 2024 were Vito (14.55 million cu m in 2024), Pompano (11.68), and Lucius (5.72).

The WB lists the field name for the largest US flare as NA. The lat/long for the Whale deepwater platform in the Western Gulf matches the identified flare location (26.22 lat., -94.67 long.)

Per the WB tracker, the Terra Nova FPSO, offshore Newfoundland, was the top North American offshore flarer by a considerable margin (data for Canada below). Terra Nova was also the top flarer in 2024 (95.56 million cu m).

The location of the only flare identified offshore California corresponds with that of the Dos Cuadras field in the Santa Barbara Channel. The estimated 2025 flaring volume was 0.10 million cu m.

The WB flaring tracker is an excellent data source, but doesn’t capture vented gas and likely understates the total volume flared. The WB estimated that 160.95 million cu m (5.68 bcf) were flared at US offshore facilities in 2025. This compares with the 9.7 bcf (flaring and venting) and 8.0 bcf (flaring only) totals derived from ONRR data (chart below). The flaring difference is not surprising given that the WB numbers are dependent on satellite imagery and the ONRR data are from mandated/audited production reports. A previous comparison also showed that the WB flaring estimates are significantly lower than the ONRR numbers. From a regulatory oversight perspective, this is rather reassuring given that the reverse (WB>ONRR) would imply serious reporting issues.

Read Full Post »

The attached letter to the General Accountability Office (GAO) asserts that there were “deeply entrenched ethical issues and conflicts of interest within the former Minerals Management Service (MMS),” and implies that these issues were among the factors contributing to the tragic Macondo well blowout.

I retired from MMS shortly before the Macondo well blew out on April 20, 2020, and testified before the Senate Energy and Natural Resources Committee on May 11, 2010. My comments on MMS employee ethics still stand and are reiterated below:

I also want to express my disappointment in certain media comments directed at my former MMS colleagues. These comments have not only been ill-informed and unsubstantiated, but malicious. Without hesitation, I can tell you that MMS regulatory personnel–inspectors, engineers, scientists, and others–are 100% committed to their safety and pollution prevention mission. MMS inspectors are themselves exposed to risks every day when they fly offshore and inspect facilities. MMS personnel have repeatedly made personal sacrifices to support the regulatory mission. After Ivan, Katrina, Rita, Gustav, and Ike, MMS employees worked to restore oil and gas production essential to our economy, even when their personal lives had been disrupted by the onshore impacts of these hurricanes. These personnel work under strict ethics standards, and despite a few isolated and highly publicized incidents that occurred more than four years ago, conduct themselves with the highest degree of professionalism. While a critical review of the entire offshore regulatory regime is necessary and appropriate, unsubstantiated accusations and personal attacks are not.


The comprehensive Chief Counsel’s Report, National Commission on the BP Deepwater Horizon Oil Spill and Offshore Drilling, was the only inquiry to consider whether ethical lapses were a contributing factor to the blowout. In the “Regulatory Observations” chapter, the Chief Counsel addressed ethics concerns directly (p. 261):

“In recent years various bodies have concluded that certain MMS offices and programs have violated ethical rules or guidelines. In the wake of the Deepwater Horizon disaster, some questioned whether ethical lapses played any role in causing the blowout. The Chief Counsel‘s team found no evidence of any such lapses.

This blog closely followed the Macondo blowout. I have read all of the investigation reports and many of the court documents. I also served on the defense team for Bob Kaluza, the BP Well Site Leader who was fully acquitted after being shamefully prosecuted in the wake of the blowout. My thoughts on the Macondo tragedy are summarized in a six part series.

Because of the false ethics narrative and scapegoating of MMS, experts who should have been directing the well control efforts, were pushed to the back of the bus shortly after the blowout began. Had that not been the case, I believe the top kill operation would not have been aborted in late May and the well would have been killed 48 days sooner, reducing the oil spill volume by at least 2.4 million bbls. (See the analysis by Dr. Mayank Tyagi and his colleagues at LSU.) Also, keep in mind that the USCG Incident Commander almost required BP to resume flow from the well after the capping stack successfully shut-in the well on 7/15/2010, and would have likely done so were it not for forceful input from an engineer from the former MMS.

The consolidation of BOEM and BSEE into a single bureau makes sense. As I previously commented:

This is an excellent step that many OCS program veterans have been advocating. In addition to the inefficiencies associated with overlapping and intertwined BOEM and BSEE responsibilities, the associated regulatory fragmentation is a significant safety risk factor.

The primary OCS functions including leasing, resource evaluation, economic analysis, permitting, inspection and enforcement, investigations, environmental assessment, spill response preparedness, promulgation of regulations, technology assessment, research,and decommissioning, are inextricably linked, cannot be effectively segmented, and should not be stovepiped.

Finally, with regard to the reorganization planning questions posed at the end of the attached letter, perhaps GAO should first consider the abrupt, unplanned termination of MMS. At a 2011 Ministerial Forum in Washington, an international offshore safety expert criticized that rash decision noting – “It took 87 days to stop the blowout, but only 30 days to get rid of the regulator.”

Read Full Post »

United’s massive Walton-Morant license is the size of 896 Gulf of America lease blocks! That’s half the total number of active Gulf leases!

United O&G 2025 Financial Summary:

  • Loss after tax: ($1.25m) (2024: $2.44m loss)
  • Group cash balances at 31 December 2025: $1.7m (2024: $0.8m)

“The company currently has no revenue and is operating at an annual loss and shows a current net liability as at 31 December 2025. Its only funding options are through warrant exercises, a Jamaican farmout deal covering back and future work program costs, or equity financing.”

The company’s future is dependent on finding a partner to fund an exploratory well. In that regard, United’s optimism has yet to result in a farmout deal after years of trying. The discovery risks seem comparable to those of other prospective frontier wildcats. So why have they been unable to find a partner? Are their terms unreasonable?

This outsider continues to wonder why United has been granted multiple license extensions, the latest through 1/31/2008. Does the govt have that much confidence in a company that is dependent on finding a partner to fund an exploration well? Should the Govt of Jamaica have allowed the license to expire and negotiated directly with larger companies? Was the govt concerned about administrative or political constraints associated with re-offering the massive license area?

I have been following this story for 5 years, and am still hopeful for a positive outcome for Jamaica.

Read Full Post »

Lease sale Big Beautiful Gulf 3 (BBG3) will be held on 8/12/2026. The Final Notice of Sale is attached.

Given the rather tepid BBG1 and BBG2 results and the high sale frequency, robust bidding is not expected. Nonetheless, the BBG bidding patterns and tract evaluations have been interesting, most notably BOEM’s rejection of LLOG’s bid for Keathley Canyon 828, an expired lease block in the their Buckskin field.

Keathley Canyon 828 is not among the blocks listed for sale at BBG3. Per the Notice of Sale (p. 4), “any lease blocks whose high bids were rejected and not appealed in the immediately preceding Big Beautiful Gulf lease sale, are expected to be included as eligible for lease.” Can we therefore assume that either the KC 828 bid rejection or the prior lease expiration is being appealed?

The legislatively mandated BBG lease terms are attractive – 10 years and 12.5% royalty for deepwater blocks. A more recent legislative directive requires (wrongly in my opinion) the approval of downhole commingling requests. This accelerates the return on investments in deepwater, high pressure reservoirs. Such commingling has presumably contributed to record Gulf oil production in 2025. The longer term concern is the impact on ultimate oil and gas recovery.

Meanwhile, the Gulf rig count and well start numbers continue to disappoint. Baker Hughes (7/2/2026) lists only 4 active rigs in the deepwater Gulf – one each in the Alaminos and Mississippi Canyon areas and two in the Green Canyon Area. BSEE’s borehole file lists only 15 new deepwater exploratory well starts YTD.

Read Full Post »

Six months after the year ended, the Office of Natural Resources Revenue (ONRR) has completed their precise, to the barrel, production accounting. BOEM was correct2025 was a record OCS oil production year by a considerable amount. Total OCS production, nearly 714 million bbls, exceeded the 2019 record by 14 million bbls. EIA data still favor 2019 by a slight margin.

The 16+ million barrel difference between the 2025 ONRR and EIA OCS production totals is much larger than any such differential in recent years and warrants an explanation. Below are the 2025 OCS totals (first table) and the 2019 to 2025 Gulf totals (2nd table). As indicated in the second table, all other differentials between ONRR and EIA were <2 million bbls, and only the 2024 differential was >1 million bbls.

2025 OCS total – ONRR2025 OCS total – EIA2025 Gulf only – ONRR2025 Gulf only – EIA
713,673,419697,020,000708,803,859692,634,000
Table 1

Gulf oil production (bbls)ONRREIA
2019692,681,301692,831,000
2020609,704,101610,064,000
2021623,586,734623,167,000
2022632,639,739631,900,000
2023680,868,936680,400,000
2024656,217,605654,223,000
2025708,803,859692,634,000
Table 2

Read Full Post »

The Piper Alpha fire (July 6, 1988) was the worst disaster in the history of offshore oil and gas operations and sent shock waves around the world. Eight months later another interactive pipeline-platform fire killed 7 workers at the South Pass 60 “B” facility in the Gulf of Mexico. A US Minerals Management Service task group reviewed the investigation reports for both fires and recommended regulatory changes with regard to:

  1. the identification and notification procedures for out-of-service safety devices and systems,
  2. location and protection of pipeline risers,
  3. diesel and helicopter fuel storage areas and tanks,
  4. approval of pipeline repairs, and
  5. location of ESD valves on pipelines.

Paul Schneider and I wrote a paper on the task group’s findings and that paper was published in Offshore Operations Post Piper Alpha (Institute of Marine Engineers,1991). The proposed regulations that followed summarized these findings and can be be found at this Federal Register link.

Lord Cullen’s comprehensive inquiry into the Piper Alpha tragedy challenged traditional thinking about regulation and how safety objectives could best be achieved, and was perhaps the most important report in the history of offshore oil and gas operations. Per Cullen:

Many current safety regulations are unduly restrictive because they impose solutions rather than objectives. They also are out of date in relation to technological advances. Guidance notes lend themselves to interpretations that discourage alternatives. There is a danger that compliance takes precedence over wider safety considerations and that sound innovations are discouraged.

Cullen advocated management systems that describe the safety objectives, the system by which those objectives were to be achieved, the performance standards to be met, and the means by which adherence to those standards was to be monitored. He called for safety cases that describe major hazards on an installation and provide appropriate safety measures. Per Cullen, each operator should be required in the safety case to demonstrate that the safety management systems of the company and the installation are adequate to assure that design and operation of the platform and its equipment are safe.

Full Piper Alpha Inquiry – 2 parts.

Read Full Post »

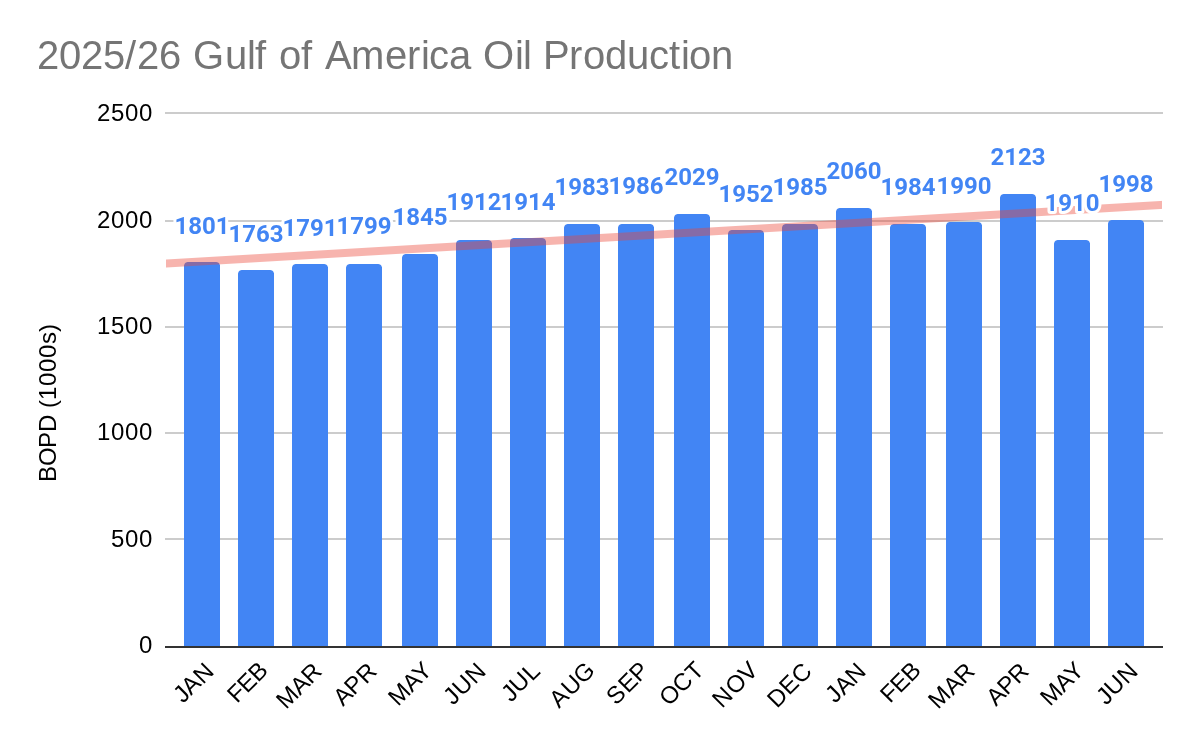
Per the preliminary EIA data for April, Gulf of America OCS facilities produced an average of 2.107 million bopd in April. This surpasses the previous record of 2.060 million bopd set in January.

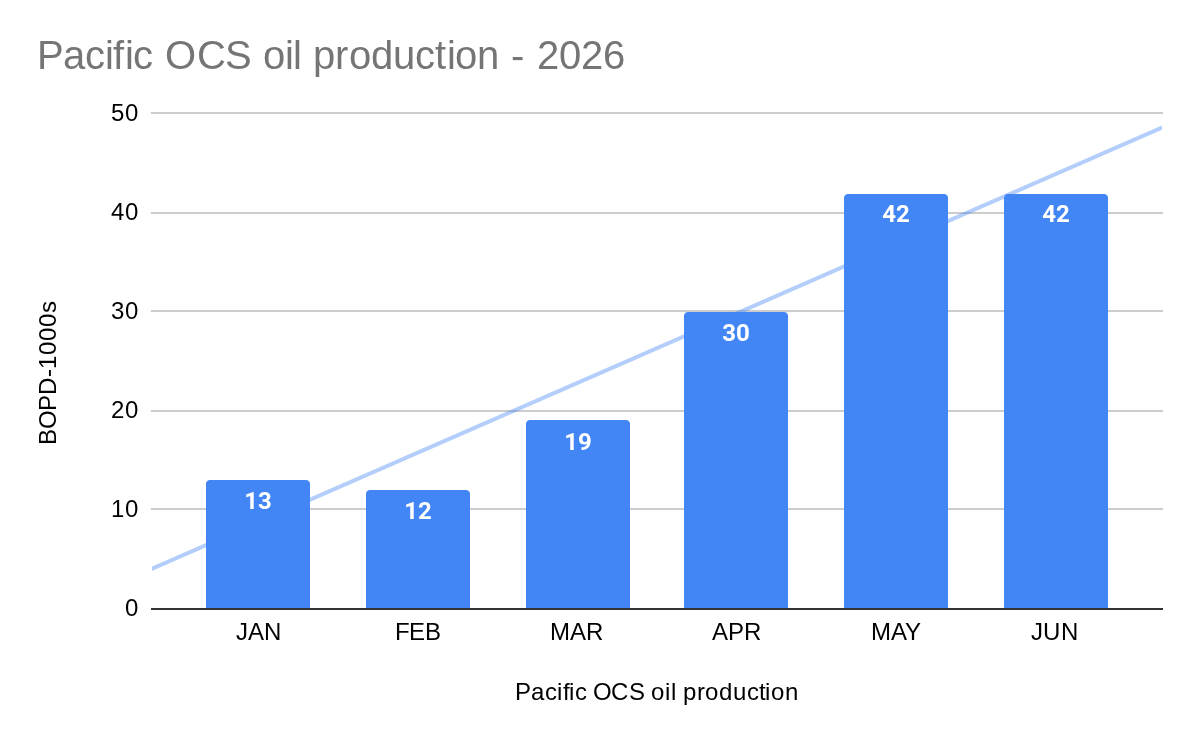
Meanwhile, the Sable bump is now evident in the EIA’s Pacific OCS production data with a ~50% March-April increase from January-February. A bigger increase should be apparent when the May numbers are posted. How will Sable fare in the upcoming court battles?

Read Full Post »

Part 1

Gulf of America flaring and venting data for 2019-2025 are summarized in the attached table. The preferred performance indicators are the percentages of produced gas that are flared and vented both for oil-well gas (OWG, also known as associated or casinghead gas) and gas-well gas (GWG or non-associated gas).

The flaring and venting table was compiled using monthly data submitted to the Office of Natural Resources Revenue (ONRR). This is the best data source because reporting is mandatory and strictly enforced, and flaring and venting are accounted for separately. All volumes are in millions of cubic feet (MMCF).

The venting and flaring volumes are segmented for both OWG and GWG production. Venting produced gas (mostly methane) is a more significant environmental concern from both air quality and greenhouse gas (GHG) perspectives.

Observations and Comments:

  • The total volume of gas flared and vented in 2025 was 9.7 bcf (chart 1). 80% of that volume was flared, leaving 20% vented. OWG flaring (chart 5) reached a new high of 7.785 bcf in 2025, a near record oil production year for the Gulf.
  • Total venting and flaring in 2025 increased by 819 million cubic feet vs. 2024. However, the 7-year trend line remains favorable (chart 1).
  • Thinking that 2019, a record year for total flaring and venting, may have biased the trend line, I extended the chart back to 2015, the first year for which I have ONRR data. As you can see in chart 2, the overall trend is still favorable.
  • The % of produced gas that was flared or vented remains persistently above the historical 1.0% target (chart 3). Flared/vented volumes were below 1% of production prior to 2018.
  • The higher flaring/venting % may be because most gas production is now from oil wells, which typically have higher flaring rates associated with processing upsets.
  • The flaring and venting gap between GWG and OWG has narrowed, largely because of an increase in GWG flaring/venting. The combined rate for GWG more than doubled over the 7 year period, rising to 0.81% vs. 1.34% for OWG. (chart 3)
  • Total venting rose to 1.7 bcf in 2025, the highest venting volume in 3 years.
  • The % of GWG being vented doubled over the past 5 years to over 0.50% (chart 4). The growth in venting warrants further investigation.
  • The % of OWG vented increased slightly to 0.20%. Further reduction in OWG venting had been expected given that OWG production is increasingly from deepwater facilities with modern flaring systems.
  • A 2020 Univ. of Michigan study found “Large, older facilities situated in shallow waters tended to produce episodic, disproportionally high spikes of methane emissions. These facilities, which have more than seven platforms apiece, contribute to nearly 40% of emissions, yet consist of less than 1% of total platforms.” 
  • Platform specific data would be helpful in further assessing flaring/venting sources and trends.
chart 1
chart 2
chart 3
chart 4
chart 5

Read Full Post »

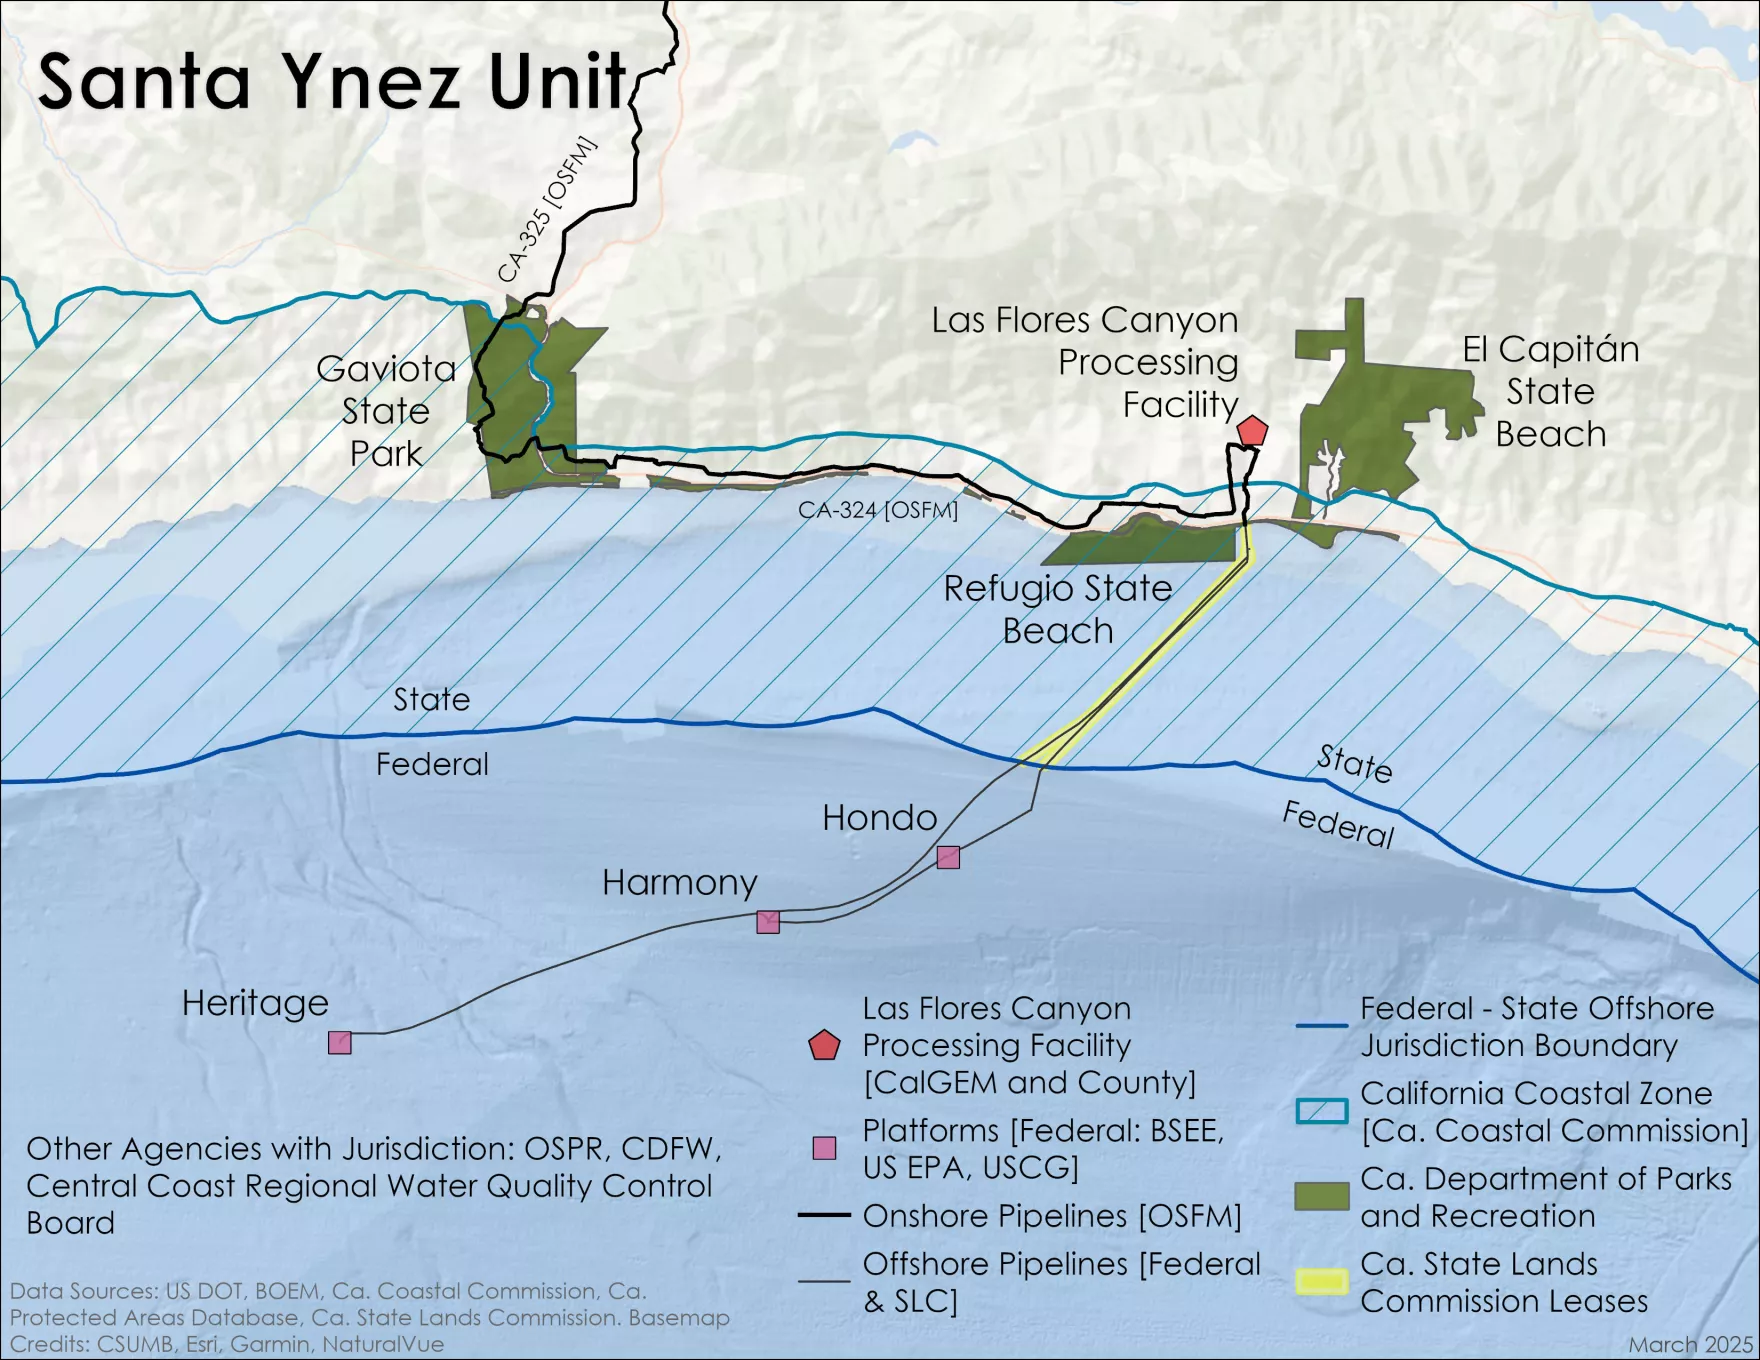
Sable Offshore began ramping up production at Platform Harmony last May delivering oil and gas to their Los Flores Canyon Processing Facility. In March, they resumed transportation to the Pentland pipeline segments and achieved first sales.

Below are BOEM production data for Harmony through March 2026. Harmony production was expected to increase to 22,000 bopd in May. Similarly, Sable forecasted Heritage production of 30,000 bopd for that month. The actual production numbers should be available in a month or two.

Nothing in the March production data for Harmony is particularly surprising. The gas-oil ratio (GOR) of ~1000 cu ft/bbl is rather typical for oil production in the region, as is the water cut, although less water production would be preferred. Produced water is not discharged from the platform, but is injected subsurface through disposal wells.

Read Full Post »

« Newer Posts - Older Posts »