Feeds:
Posts
Comments

Archive for the ‘seeps’ Category

On January 28, 1969, well A-21, the 5th well to be drilled from Union Oil Company’s “A” platform began flowing uncontrollably through fractures into the Santa Barbara Channel.

The absence of any well casing to protect the permeable, fractured cap rock meant that the operator couldn’t safely shut-in a sudden influx of hydrocarbons into the well bore (i.e. a “kick”). Shutting-in the well at the surface would create well bore fractures through which oil and gas could migrate to shallow strata and the sea floor. The probability of an oil blowout was thus essentially the same as the probability of a kick (>10-2). Compare this with the historical US offshore oil blowout probability (<10-4) and the probability of <10-5 for wells with optimal barrier management.

Here, in brief, is the well A-21 story:

  • Well drilled to total depth of 3203′ below the ocean floor (BOF).
  • 13 3/8″ casing had been set at 238′ BOF. The well was unprotected from the base of this casing string to total depth.
  • Evidence of natural seeps near the site suggested the presence of fracture channels
  • The well was drilled through permeable cap rock and a small high pressured gas reservoir before penetrating the target oil sands.
  • When the well reached total depth, the crew started pulling drill pipe out of hole to in preparation for well logging.
  • The first 5 stands of drill pipe pulled tight; the next 3 pulled free suggesting the swabbing of fluids into the well bore..
  • The well started flowing through the drill pipe. The crew attempted to stab an inside preventer into the drill pipe, but the well was blowing too hard. The crew then attempted unsuccessfully to stab the kelly into the drill pipe and halt the flow.
  • The crew dropped the drill pipe into the well bore and closed the blind ram to shut-in the well.
  • Boils of gas began to appear on the water surface. Oil flowed to the surface through numerous fracture channels. The above sketch by former colleague Jerry Daniels (RIP) depicts the fracturing, which greatly complicated mitigation of the flow.

Here is the link to an excellent US Geological Survey report from 1969 that describes the geologic setting, well activities, and remedial measures after the blowout.

We need to continue studying these historically important incidents, not just the technical details but also the human and organizational factors that allowed such safety and environmental disasters to occur. The idea is not to shame, but to remember and better understand.

Read Full Post »

Details on the Santa Barbara blowout from last year’s BOE post.

Read Full Post »

Sept 30 (Reuters) – The ruptures on the Nord Stream natural gas pipeline system under the Baltic Sea have led to what is likely the biggest single release of climate-damaging methane ever recorded, the United Nations Environment Programme said on Friday.

“This is really bad, most likely the largest emission event ever detected,” Manfredi Caltagirone, head of the IMEO for UNEP, told Reuters. “This is not helpful in a moment when we absolutely need to reduce emissions.”

Researchers at GHGSat, which uses satellites to monitor methane emissions, estimated the leak rate from one of four rupture points was 22,920 kilograms per hour. That is equivalent to burning about 630,000 pounds of coal every hour, GHGSat said in a statement.

The Nord Stream methane release, while puzzling and rather frightening given the potential for escalating international tensions, was not an environmental disaster or even a major environmental setback.

Some perspective:

  • estimate for the main Nord Stream leak (likely the maximum or near-maximum rate) = 22,930 kg/hr
  • 22,930 kg/h = 550,320 kg/day = 550.320 x 10⁶ g/day
  • total methane source for North American coastal waters (NASEM, Oil in the Sea, p. 63) = 4 – 20 Tg/yr
  • 10 Tg/yr (i.e. 10 x 1012 g/yr) = 0.027 x 10¹² g/day = 27000 x 106 g/day
  • This is ~50 times the temporary (maximum?) daily rate for the Nord Stream leak
  • North American input from seafloor seepage only (NASEM, Oil in the Sea, p. 63) = 2 – 9 Tg/yr
  • assuming 5 x 10¹² g/year or 13700 x 106 g/day
  • This is ~25 times the temporary (maximum?) daily rate for the Nord Stream leak

Read Full Post »

Although we are still waiting for the report on the 2021 Huntington Beach pipeline spill, all evidence indicates that the spill was caused by a container ship anchor. Available information to date also suggests that the pipeline was well maintained and properly operated. The volume spilled and resulting damage was less than predicted. Nonetheless, some vocal opportunists took full advantage of the spill to further demonize offshore production.

One of our very savvy BOE readers shared data (attached) from Oil in the Sea III, a National Academies report that is the best source of information on oil inputs into US waters. The data for Southern California are presented below in 3 charts. The first chart shows that natural seeps are overwhelmingly the leading offshore source of oil entering SoCal waters, with offshore platforms and pipelines accounting for <0.5% of the oil.

The second and third charts exclude natural seepage and compare the coastal and offshore oil inputs from the other sources. When land based transportation inputs are included (chart 2), platforms and pipelines (combined) account for 5.3% of the oil.

Excluding natural seepage and land based transportation inputs (chart 3), recreation vessels are by far the leading source of oil (47.5%), with platforms and pipelines (combined) accounting for less than half that volume (22.2%).

These data add important perspective, but are not intended to discount platform and pipeline spills. These spills can have significant localized impacts, and every effort must be made to prevent their occurrence.

Read Full Post »

The oil is most likely from natural seeps, but the Coast Guard is investigating.  Link provided by Cheryl Anderson:

An MH-65 helicopter flew over the area Wednesday evening just before sunset but did not spot any spill or sheen, or any other oiled birds. Coast Guard officials tell KEY News they have contacted the owners of the oil platforms in the channel but none of them have reported a spill or had transferred any fuel or oil in the past day.

Read Full Post »

canoe caulked with asphaltum from natural seeps

The first consumers of petroleum used oil that seeped to the surface naturally.  Native Americans in California used petroleum seepage to caulk their canoes.  Marco Polo witnessed oil being recovered from seeps in 1264 in Baku (then part of Persia).

Drake Well, 1859, Titusville, PA

Natural seeps helped Colonel Drake target the first commercial oil well in the U.S. (Titusville, PA, 1859).  The amount of oil that seeps to the earth’s surface is surprisingly high.  In fact, a Norwegian Petroleum Directorate article on natural seeps estimates that “at least 1/3 of all oil formed below ground escapes to the surface as seepage.”

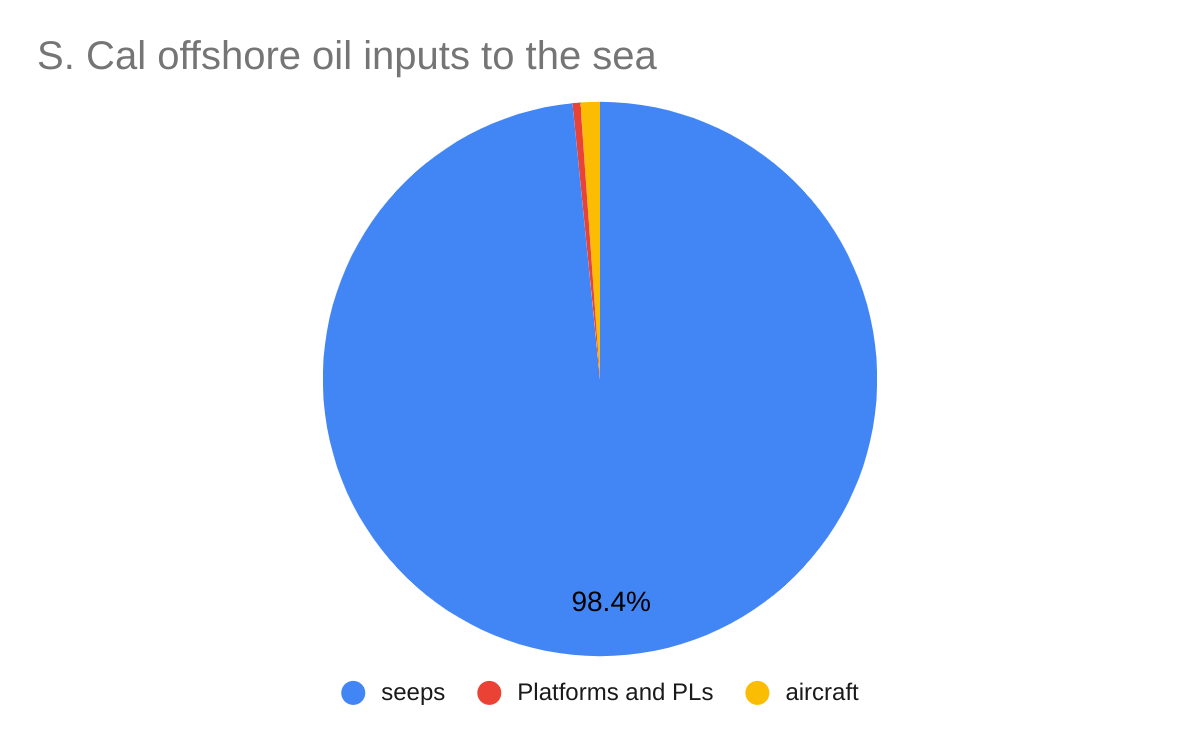
Natural seepage has increasingly factored into the offshore drilling debate.  The MMS Oil Spill Fact Sheet notes that “natural seeps introduce 150 times more oil into U.S. marine waters than do OCS oil and gas activities.” These data are intended to provide context, not to downplay the significance of drilling and production spills.  A large spill is an undesirable event at the location where it occurs,  regardless of how the spill’s volume compares with  regional, national, or international seepage totals.

Natural Seeps, Coal Oil Point

A California advocacy group, Stop Oil Seeps, has taken the “seep argument” a step farther by promoting  offshore production as a means of reducing natural seepage and the associated air and water pollution.

While SOS’s position is interesting and perhaps justified for areas like Coal Oil Point (Santa Barbara Channel),  not all production prevents or reduces seepage.  Offshore oil and gas seepage results when hydrocarbon-bearing formations are exposed to the sea floor either directly or via fractured or permeable overlying sediments.  Where such conditions do not exist, oil and gas production will not reduce seepage.  SOS’s enthusiastic support for California offshore production is refreshing, but advocates should exercise caution in making claims regarding seepage reduction.  Prospects for seepage reduction from offshore production range from highly likely (Platform Holly and Coal Oil Point) to highly unlikely (deep formations protected with impermeable cap rock).

While we applaud their enthusiastic support for offshore production, the SOS plan raises a number of questions:

  1. Is SOS suggesting that offshore production only be allowed if such production will reduce seepage?
  2. How much can offshore production reduce overall seepage in the region?  Is it cost-effective and feasible to achieve significant, long-term reductions in seepage that has existed for thousands of years?
  3. If the objective is to produce oil and gas, and generate the associated revenues, why not say that straight away?  Why is seep reduction necessary to justify responsible offshore production?
  4. Since the resources of the OCS are owned by all Americans, how does California justify “negotiating to retain the full fees and royalties for federal OCS leases and production revenue.”  Should Louisiana, Texas, Alaska, and other states also receive all fees and royalties for production from Federal waters?  Should these payments be retroactive?  Should states also receive all royalties and fees for wind and hydrokinetic energy produced in Federal waters?

While Platform Holly may be a negative spillage facility  (i.e. Holly’s seep reduction may significantly exceed the platform’s production spillage), this type of seepage reduction has not been demonstrated at other platforms.  Decisions on offshore exploration and development should be driven by the economic, energy security, and environmental benefits.  To the extent that production reduces natural seepage, all the better.  However, seepage reduction is not a primary reason for producing offshore oil and gas.

Read Full Post »

The case for increasing production offshore California is relatively straightforward:

  1. The oil is there and production could be increased relatively quickly.
  2. Because of existing infrastructure and advances in extended reach drilling technology, additional offshore facility needs would be minimal.
  3. The safety and environmental record, while not perfect, has been exceptional.  (Opponents and supporters of California offshore production should fully agree on one point: We must never forget the 1969 blowout, and must challenge operating practices that make these type of incidents possible.)
  4. An effective regulatory regime is in place.
  5. Both the State and Federal governments need the revenue.
  6. Importing 50+% of our petroleum is detrimental to our economy and has significant national security implications.
  7. 25 years of offshore leasing moratoria demonstrated that you don’t reduce domestic consumption by restricting domestic production.
  8. Because of common infrastructure and support service needs, offshore oil and gas operations are complementary to (and may accelerate) wind and hydrokinetic energy development.

Read Full Post »