Although we are still waiting for the report on the 2021 Huntington Beach pipeline spill, all evidence indicates that the spill was caused by a container ship anchor. Available information to date also suggests that the pipeline was well maintained and properly operated. The volume spilled and resulting damage was less than predicted. Nonetheless, some vocal opportunists took full advantage of the spill to further demonize offshore production.
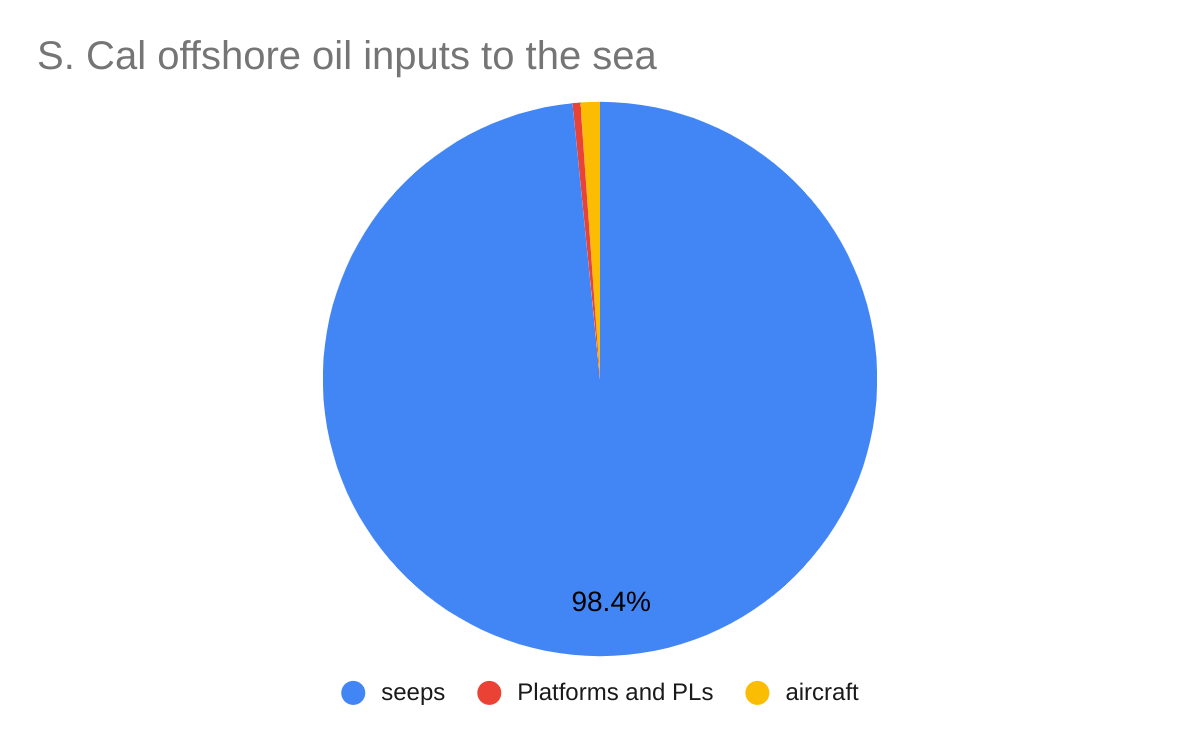
One of our very savvy BOE readers shared data (attached) from Oil in the Sea III, a National Academies report that is the best source of information on oil inputs into US waters. The data for Southern California are presented below in 3 charts. The first chart shows that natural seeps are overwhelmingly the leading offshore source of oil entering SoCal waters, with offshore platforms and pipelines accounting for <0.5% of the oil.
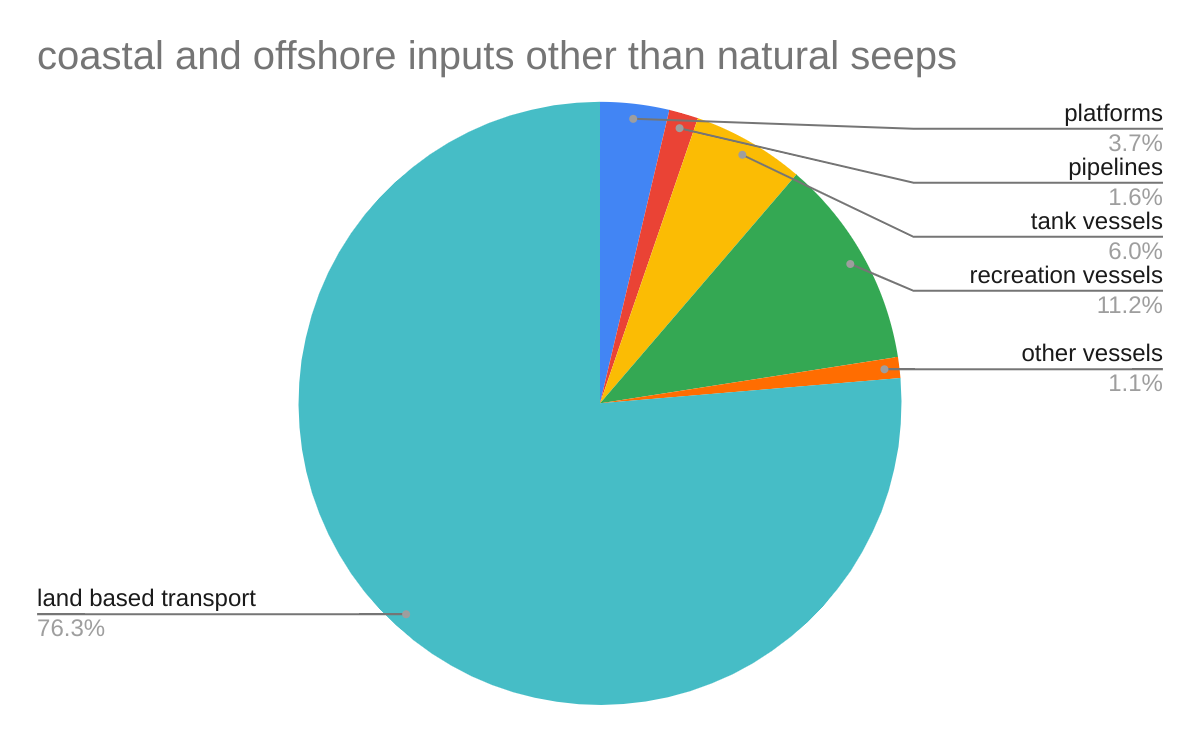
The second and third charts exclude natural seepage and compare the coastal and offshore oil inputs from the other sources. When land based transportation inputs are included (chart 2), platforms and pipelines (combined) account for 5.3% of the oil.
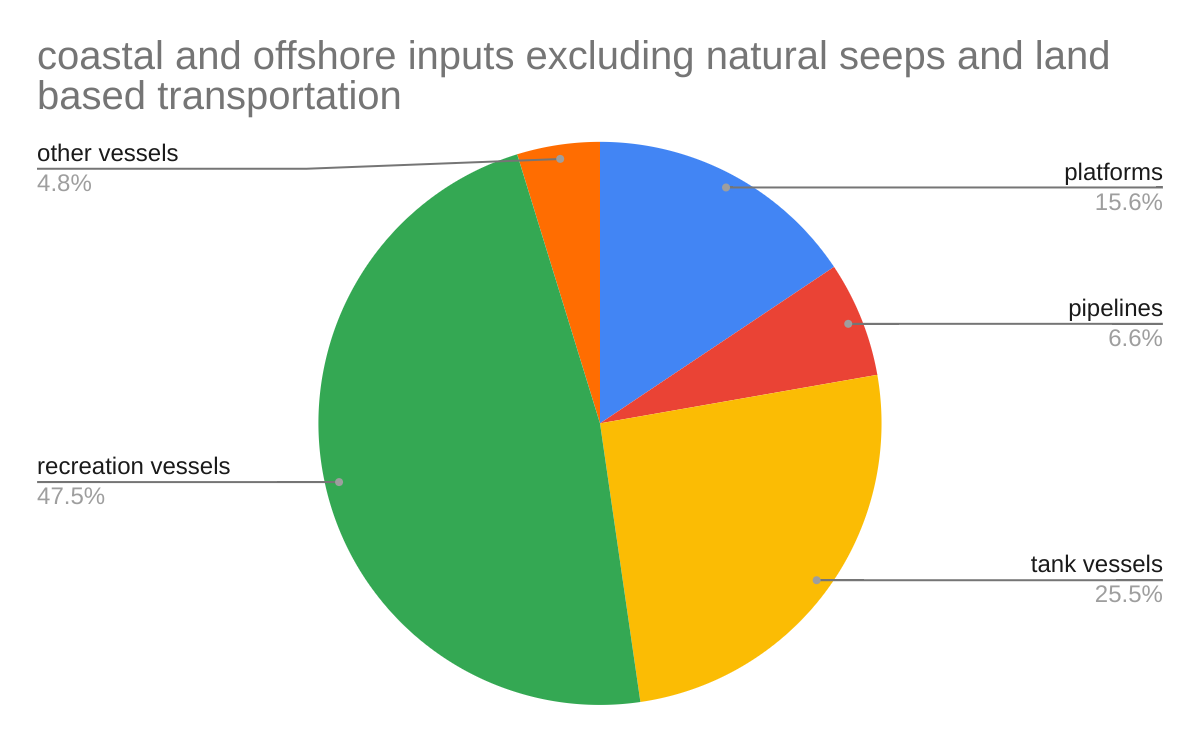
Excluding natural seepage and land based transportation inputs (chart 3), recreation vessels are by far the leading source of oil (47.5%), with platforms and pipelines (combined) accounting for less than half that volume (22.2%).
These data add important perspective, but are not intended to discount platform and pipeline spills. These spills can have significant localized impacts, and every effort must be made to prevent their occurrence.

Leave a comment