United O&G 2025 Financial Summary:
- Loss after tax: ($1.25m) (2024: $2.44m loss)
- Group cash balances at 31 December 2025: $1.7m (2024: $0.8m)
“The company currently has no revenue and is operating at an annual loss and shows a current net liability as at 31 December 2025. Its only funding options are through warrant exercises, a Jamaican farmout deal covering back and future work program costs, or equity financing.”
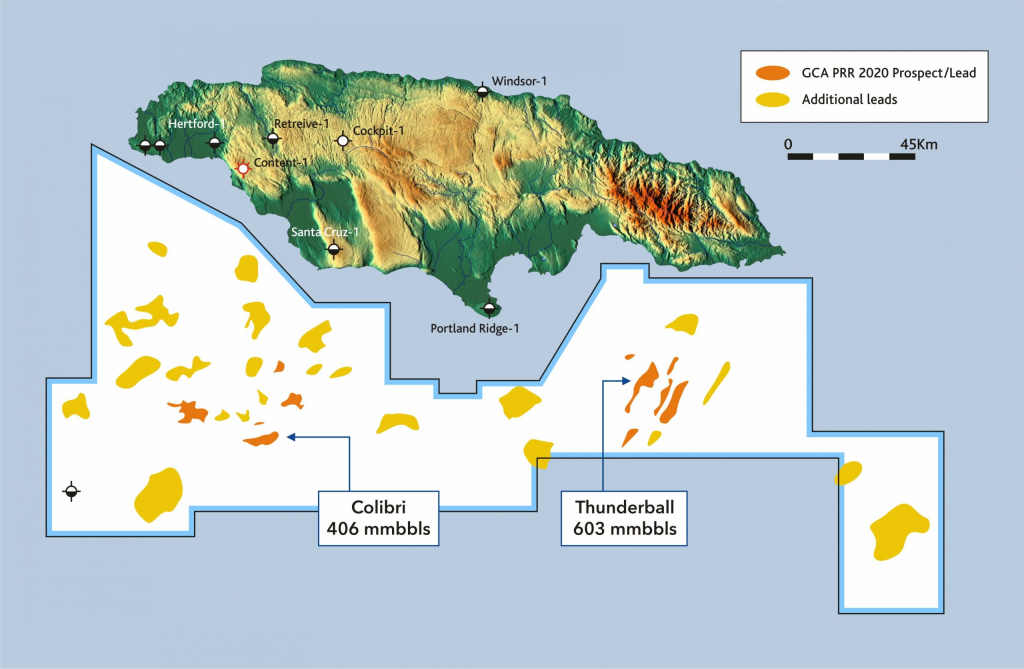
The company’s future is dependent on finding a partner to fund an exploratory well. In that regard, United’s optimism has yet to result in a farmout deal after years of trying. The discovery risks seem comparable to those of other prospective frontier wildcats. So why have they been unable to find a partner? Are their terms unreasonable?
This outsider continues to wonder why United has been granted multiple license extensions, the latest through 1/31/2008. Does the govt have that much confidence in a company that is dependent on finding a partner to fund an exploration well? Should the Govt of Jamaica have allowed the license to expire and negotiated directly with larger companies? Was the govt concerned about administrative or political constraints associated with re-offering the massive license area?
I have been following this story for 5 years, and am still hopeful for a positive outcome for Jamaica.