Posted in Uncategorized | 5 Comments »

Excerpts from BP press release:
Atlantis is located about 150 miles south of New Orleans and has been in production for nearly 20 years. The expansion project adds two new subsea water injection wells to help increase the pressure of targeted reservoirs, unlocking additional barrels and extending the producing life of one of bp’s flagship US offshore assets.
The project, which was delivered ahead of schedule and under budget, adds approximately 10,000 barrels of oil equivalent per day (boe/d) of gross peak annualized average production, with around 5,000 boe/d net to bp.
Some of you may remember the 2009 False Claims Act allegations by a former BP contractor claiming that BP did not properly maintain the engineer-approved “as built” drawings of systems and structures aboard the Atlantis facility. The contractor alleged that the absence of the documentation created increased safety risks for the facility and to its personnel.
Following the allegations, an industry source closely involved with the project (but not a BP employee) made the following comment to the BOE blog:
Atlantis was by far, in my opinion, the best of the bunch; proceeded as a normal construction project. The PMs were the best I’ve come across.
BOEMRE (the name of the offshore safety regulator at the time) conducted a comprehensive investigation of the matter. Director Michael Bromwich sumarized the findings:
“As the report makes clear, although we found significant problems with the way BP labeled and maintained its engineering drawings and related documents, we found the most serious allegations to be without merit, including the suggestion that a lack of adequate documentation created a serious safety risk on the Atlantic facility. We found no credible evidence to support that claim.”
The BOEMRE press release is attached. Link to the full investigation report.
In August 2014, a Federal court dismissed the False Claims Act lawsuit because the plaintiffs lacked evidence and standing.
Posted in Gulf of Mexico, Offshore Energy - General, Regulation | Tagged Atlantis, BOEMRE, bp, expansion project, False Claims Act | 2 Comments »

A 7/28/2026 Dept. of Justice brief submitted to the Ninth Circuit Court of Appeals cites the 5/28/2026 Supreme Court decision in Flowers Foods Inc. v. Brock in asserting that Sable’s onshore pipeline segments are interstate and subject to Federal jurisdiction.
This filing is part of multi-faceted litigation involving Federal preemption, a 2020 Consent Decree, emergency special permits, and state environmental concerns. The Ninth Circuit is handling the expedited briefings and consolidation of petitions.
DoJ’s core argument is that Sable’s onshore segments do not interrupt the continuous “flow of commerce” from Outer Continental Shelf (OCS) offshore extraction → onshore processing → further transport to terminals (e.g., in Kern County). Thus, the system qualifies as interstate commerce subject to Federal (PHMSA) oversight rather than state regulation.
The Flowers Foods Inc. v. Brock case considered similar flow of commerce issues. The SCOTUS agreed with the Tenth Circuit that Brock delivery franchisees were engaged in interstate commerce even if they never cross State lines. The gist of the decision is as follows (emphasis added, full decision attached):
The Federal Arbitration Act (FAA) requires courts to enforce many private arbitration agreements, but it also provides that “nothing” in the law shall be used to compel arbitration in disputes involving the “contracts of employment” of any class of workers “engaged in . . . interstate commerce.” 9 U. S. C. §1. This case poses the question whether someone can qualify as a worker under the §1 exemption if he never crosses state lines and never interacts with vehicles that do. Flowers Foods, Inc., is a large producer of packaged baked goods with bakeries in 19 States. To get its products to market, the company depends in part on franchisees who buy the distribution rights to Flowers’s products in specific geographic territories. Angelo Brock is one such franchisee serving the Denver area; he picks up Flowers’s products from a warehouse in Colorado and delivers them to local stores, all without leaving the State. In 2022, Brock sued Flowers in federal district court alleging that the company had underpaid him and other distributors in violation of various federal and state laws. Flowers moved to compel arbitration, arguing that the FAA generally requires courts to stay or dismiss cases when the parties have agreed to resolve their disputes by arbitration and that Brock had signed a distribution agreement promising to arbitrate any disagreement. The district court denied Flowers’s motion, and the Tenth Circuit affirmed. Resting its decision on 9 U. S. C. §1, the Tenth Circuit reasoned that Brock belonged to a class of workers engaged in interstate commerce and thus the court lacked authority to compel arbitration.
We should soon find out what the Ninth Circuit thinks!
Posted in California, Offshore Energy - General, pipelines, Regulation | Tagged DOJ, Flowers Foods, NInth Circuit, pipeline, pipeline jurisdiction, Sable Offshore, Santa Ynez Unit, SCOTUS | Leave a Comment »


North Sea pioneer JL Daeschler comments on the passing of Sir Ian Wood: “A great North Seas leader who had an amazing career. He founded the Wood Group, an internationally important engineering firm. Mustang Engineering, well known to the US offshore industry, became part of the Wood Group in 2000.”
Last September, JL reminisced about Ian following the sale of the Wood Group:
I knew Ian in the early North Sea development stage. He became Sir Ian Wood. We used to chat at various conferences in Houston, Stavanger, and Aberdeen. Ian was an energetic man, who had a friendly a approach to our North Sea challenges. He was a true Aberdonian entrepreneur who employed 1000’s in offshore related disciplines worldwide.
Sir Ian turned his father’s fishing business into the Wood Group oil giant, leading the way as Aberdeen blossomed into Europe’s energy capital. When Sir Ian announced his retirement in 2012, Wood Group employed 41,000 people in 50 countries.
The Aberdeen Press and Journal and the BBC have posted excellent obituaries.
RIP Ian. You made the offshore world safer and more productive!
Posted in Offshore Energy - General, UK, Uncategorized | Tagged Aberdeen, engineering firm, JL Daeschler, North Sea, Sir Ian Wood, Wood Group | Leave a Comment »
MMA’s public notice about support for space launch activities (Rigs-to-Rockets) recognizes the importance of collaboration between the highly innovative offshore and space industries.
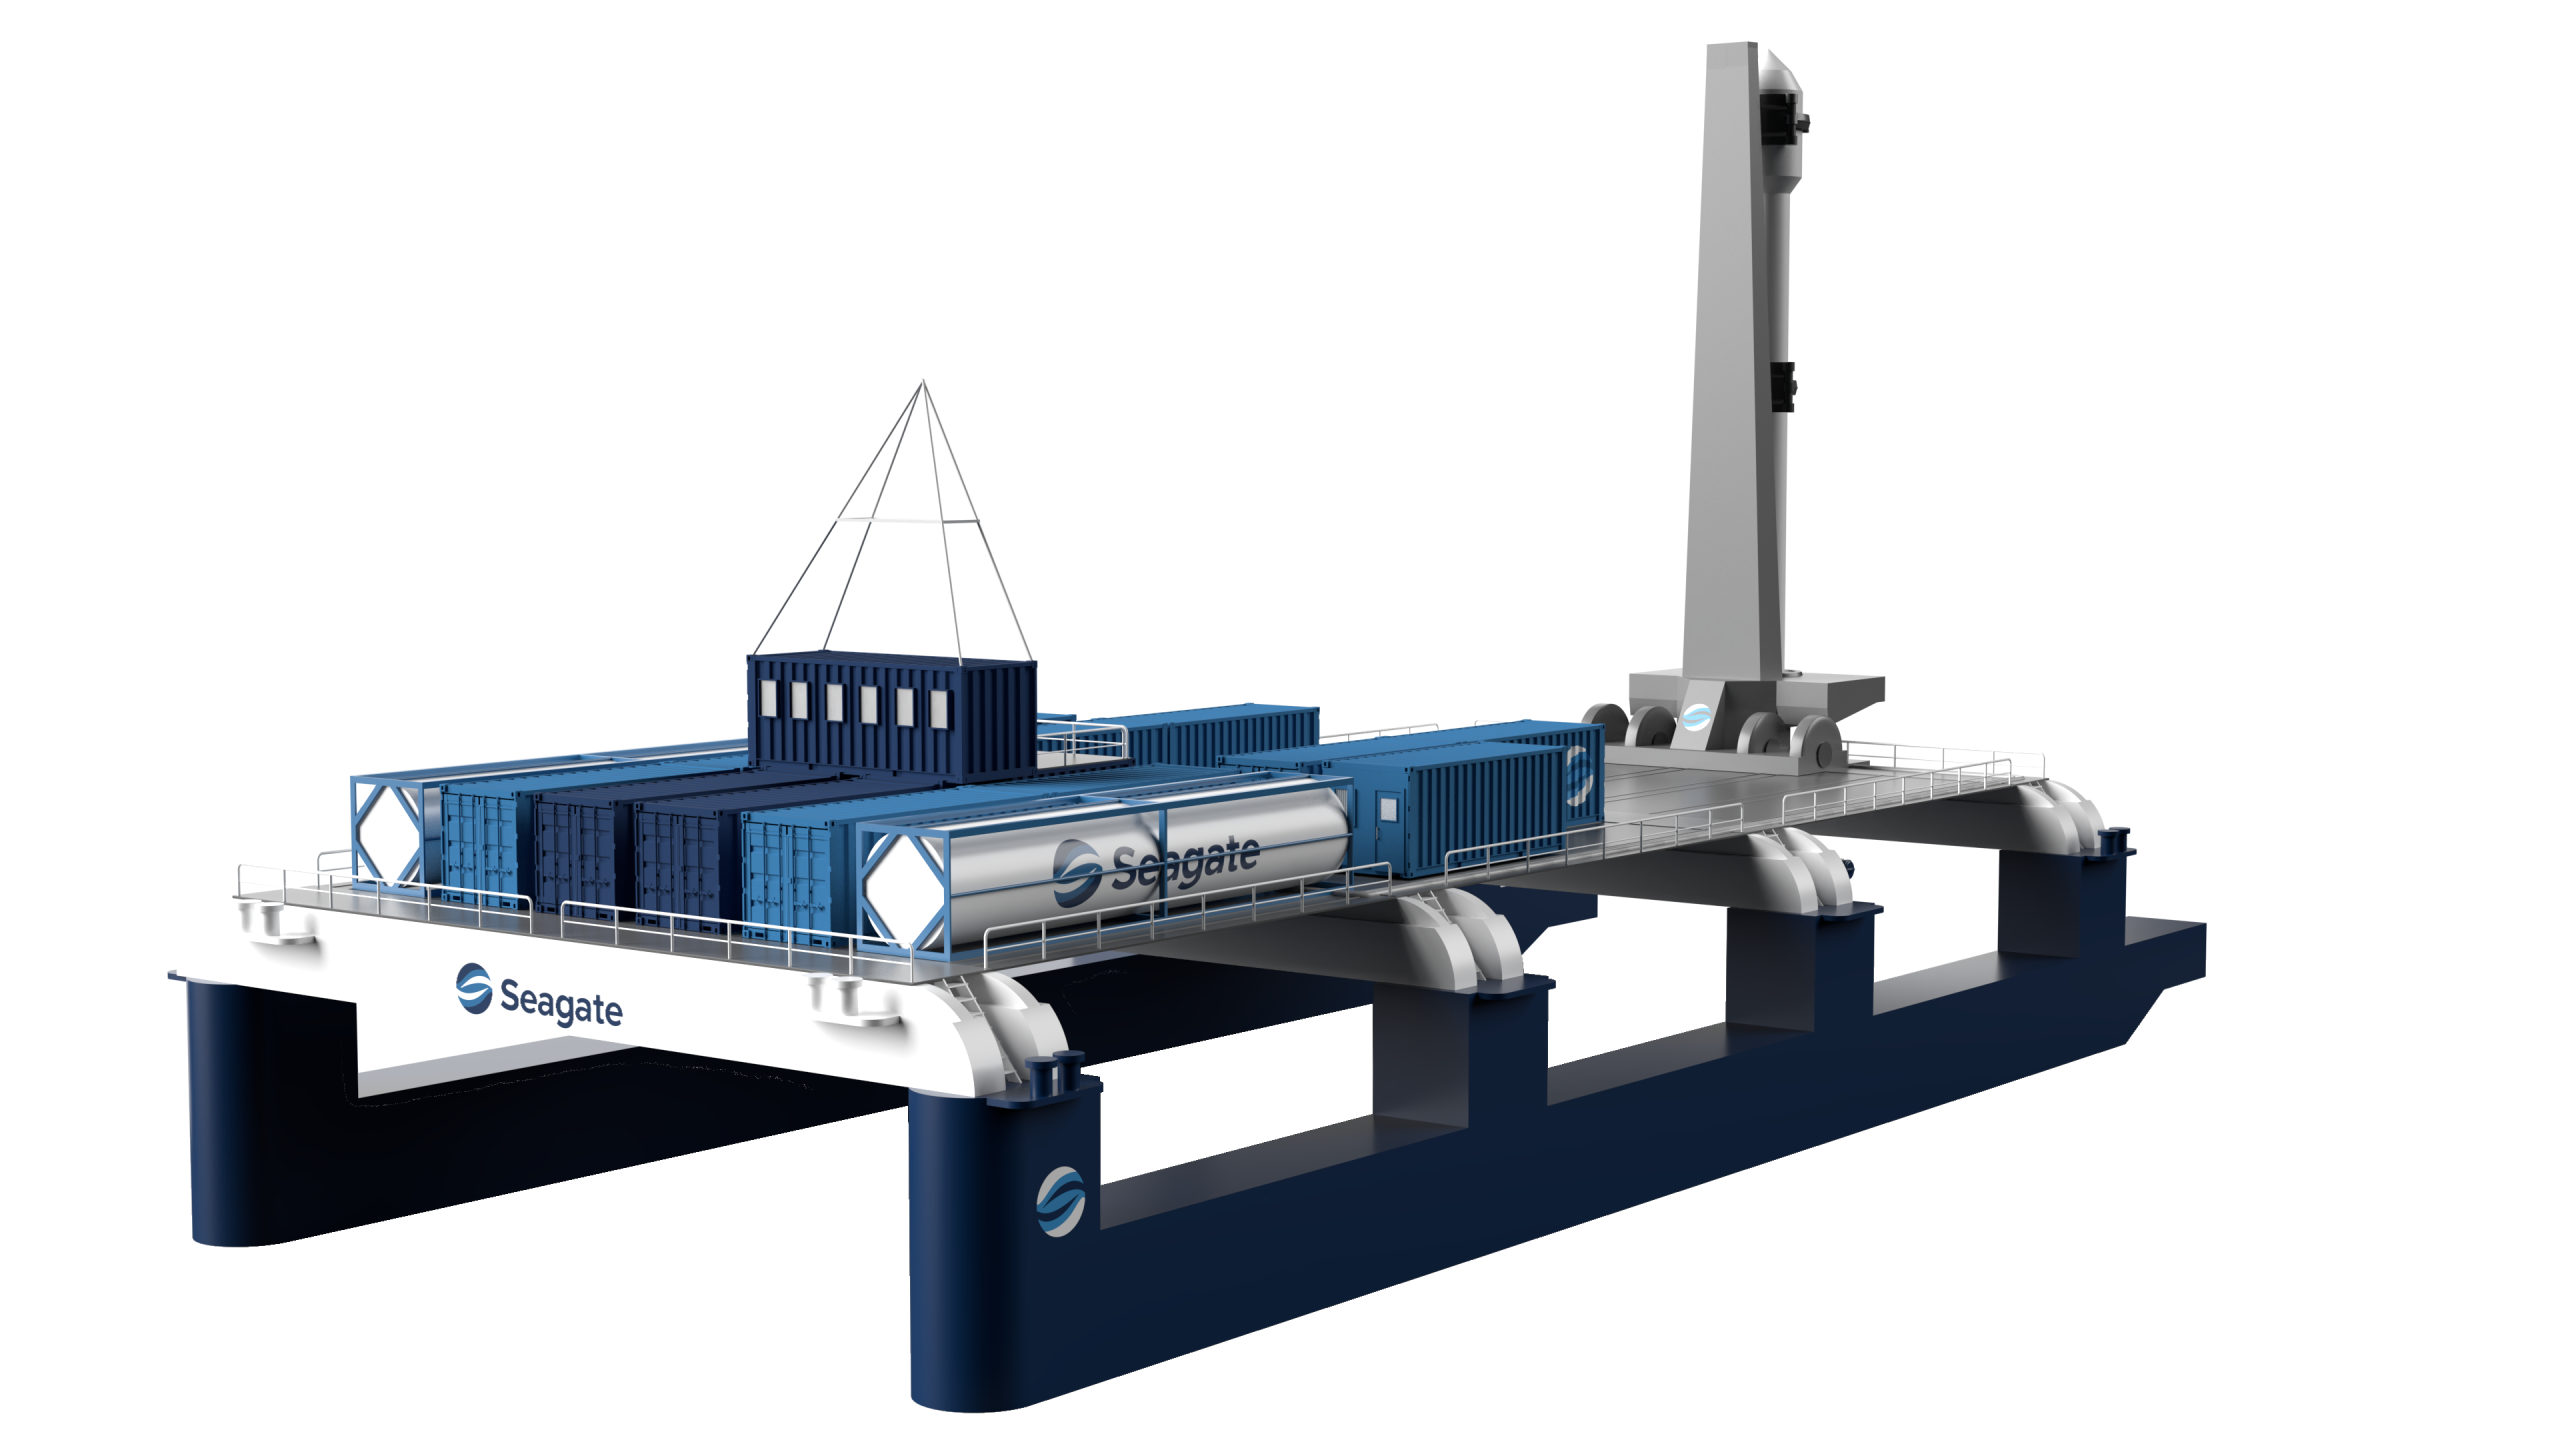
In that regard, Seagate Space, a Florida company, is moving forward with plans for offshore launches. Seagate is “developing cutting-edge maritime infrastructure to avoid land site limitations and scale orbital launch cadence for commercial, government, and defense missions.”
Seagate’s Space Gateway-S platform has adopted features that have been widely applied by the offshore industry:
- Autonomous dynamic positioning – developed and advanced by the drilling industry
- Modular architecture – common in offshore facility design
- Pontoon design – ala semi-submersible drilling units
- Mobility – like mobile offshore drilling units (MODUs) – jackups, drillships, semi-submersibles
Space Florida, a public corporation and innovation connector, recently announced a partnership with Seagate Space:
EXPLORATION PARK, Fla.—June 2, 2026— Today, Space Florida announced Project Manta, a strategic investment in Seagate Space to expand Florida’s launch capacity through specialized maritime solutions. Space Florida’s Board of Directors approved an investment to prototype and demonstrate key elements of Seagate Space’s novel offshore launch infrastructure system, setting the stage for future development and manufacturing within the state of Florida.
Seagate has also signed an MOU with Oceaneering, a leading offshore company.
Jacksonville news clip about offshore launches:
Posted in energy policy, Florida, Uncategorized | Tagged BOEM, Gateway-S, MMA, Oceaneering, offshore and space synergy, Rigs-to-Rockets, Seagate Space, Space Florida | Leave a Comment »
Despite strong support from the State, California’s offshore wind sector faces major challenges:
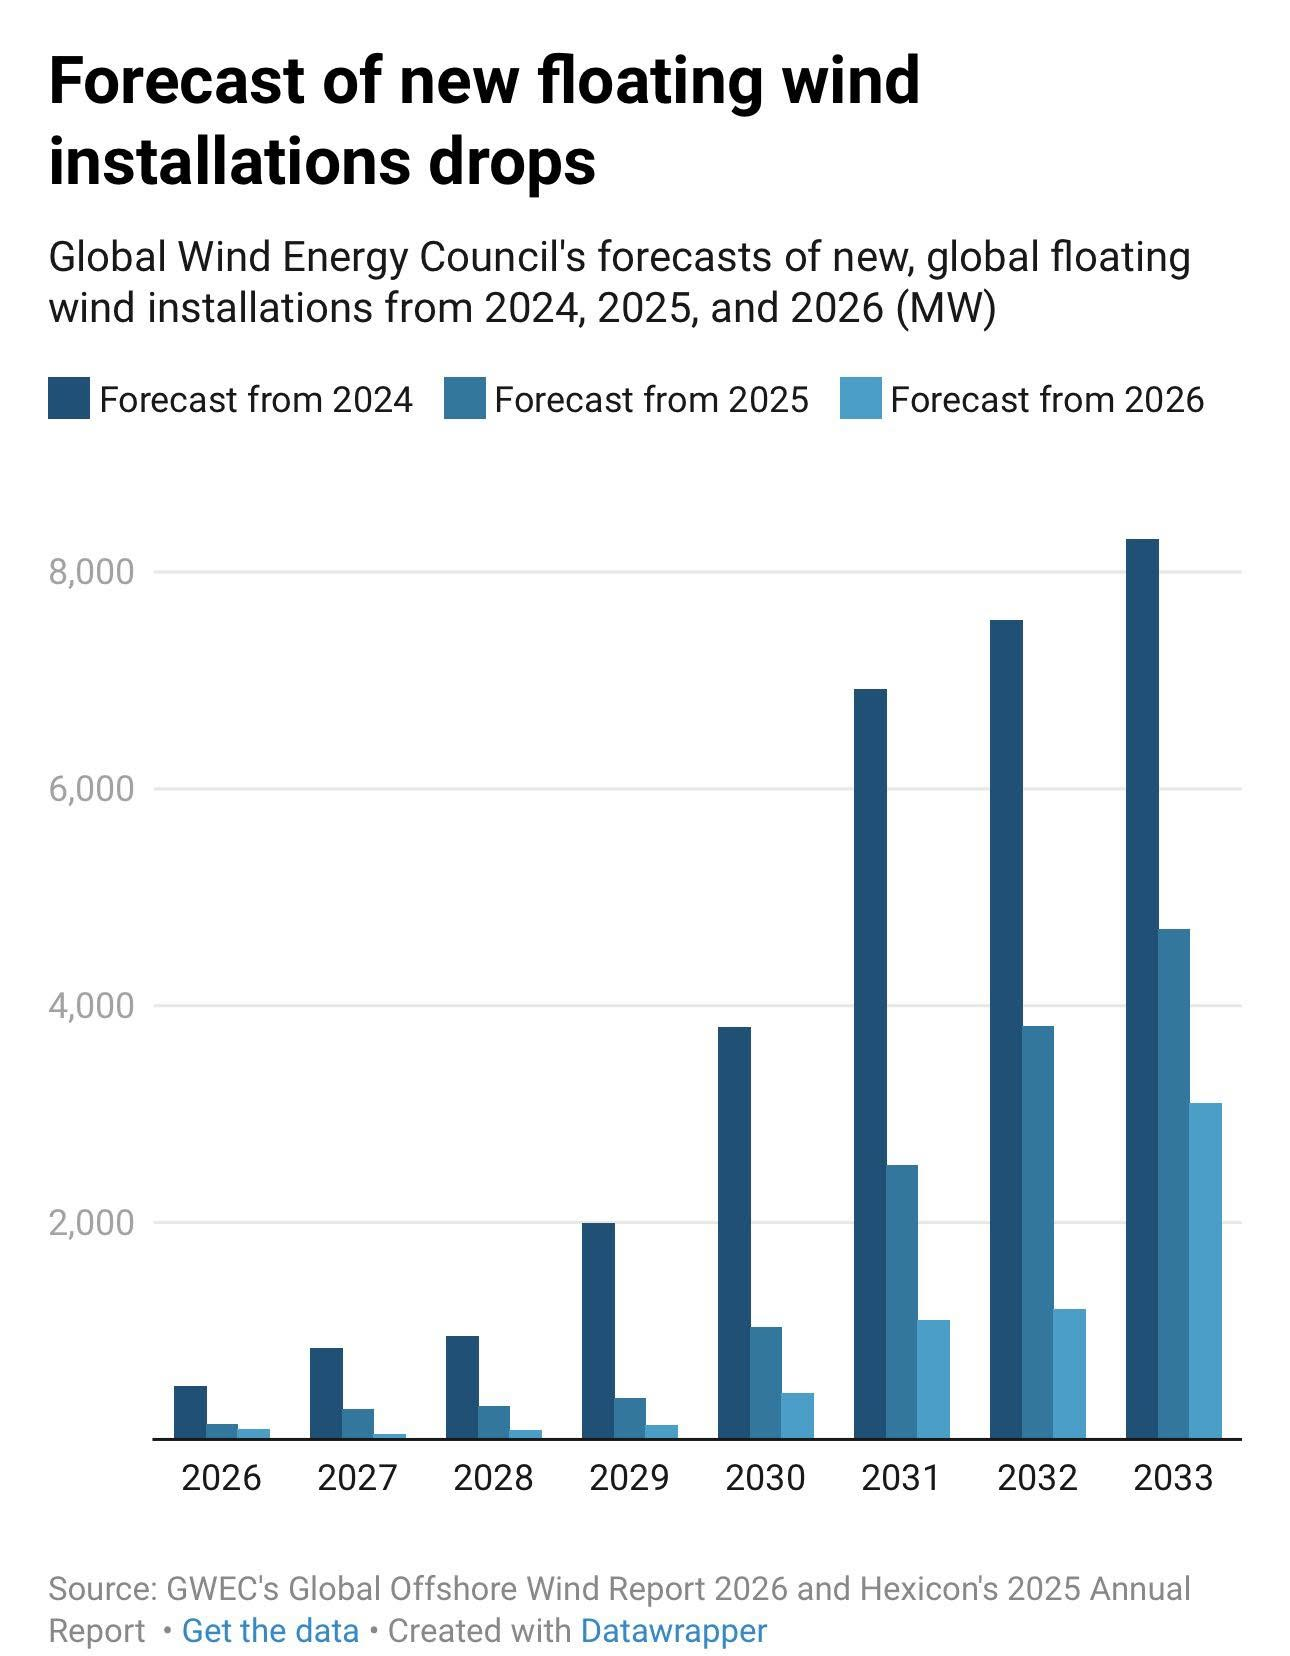
- Deepwater technology: California offshore wind development is totally dependent on expensive and still unproven floating turbine technology. Norway, once a world leader in floating wind, has lost enthusiasm and is now requiring floating projects to be ‘quality-assured.’
- Infrastructure: Major port upgrades, new transmission lines to bring power ashore, and specialized vessels are required. The supply chain is immature.
- Costs: High capital costs plus storage costs (e.g. batteries) for reliability.
- Environmental and stakeholder issues: Opposition to industrializing the coast.
- Worldwide struggles for the wind industry.
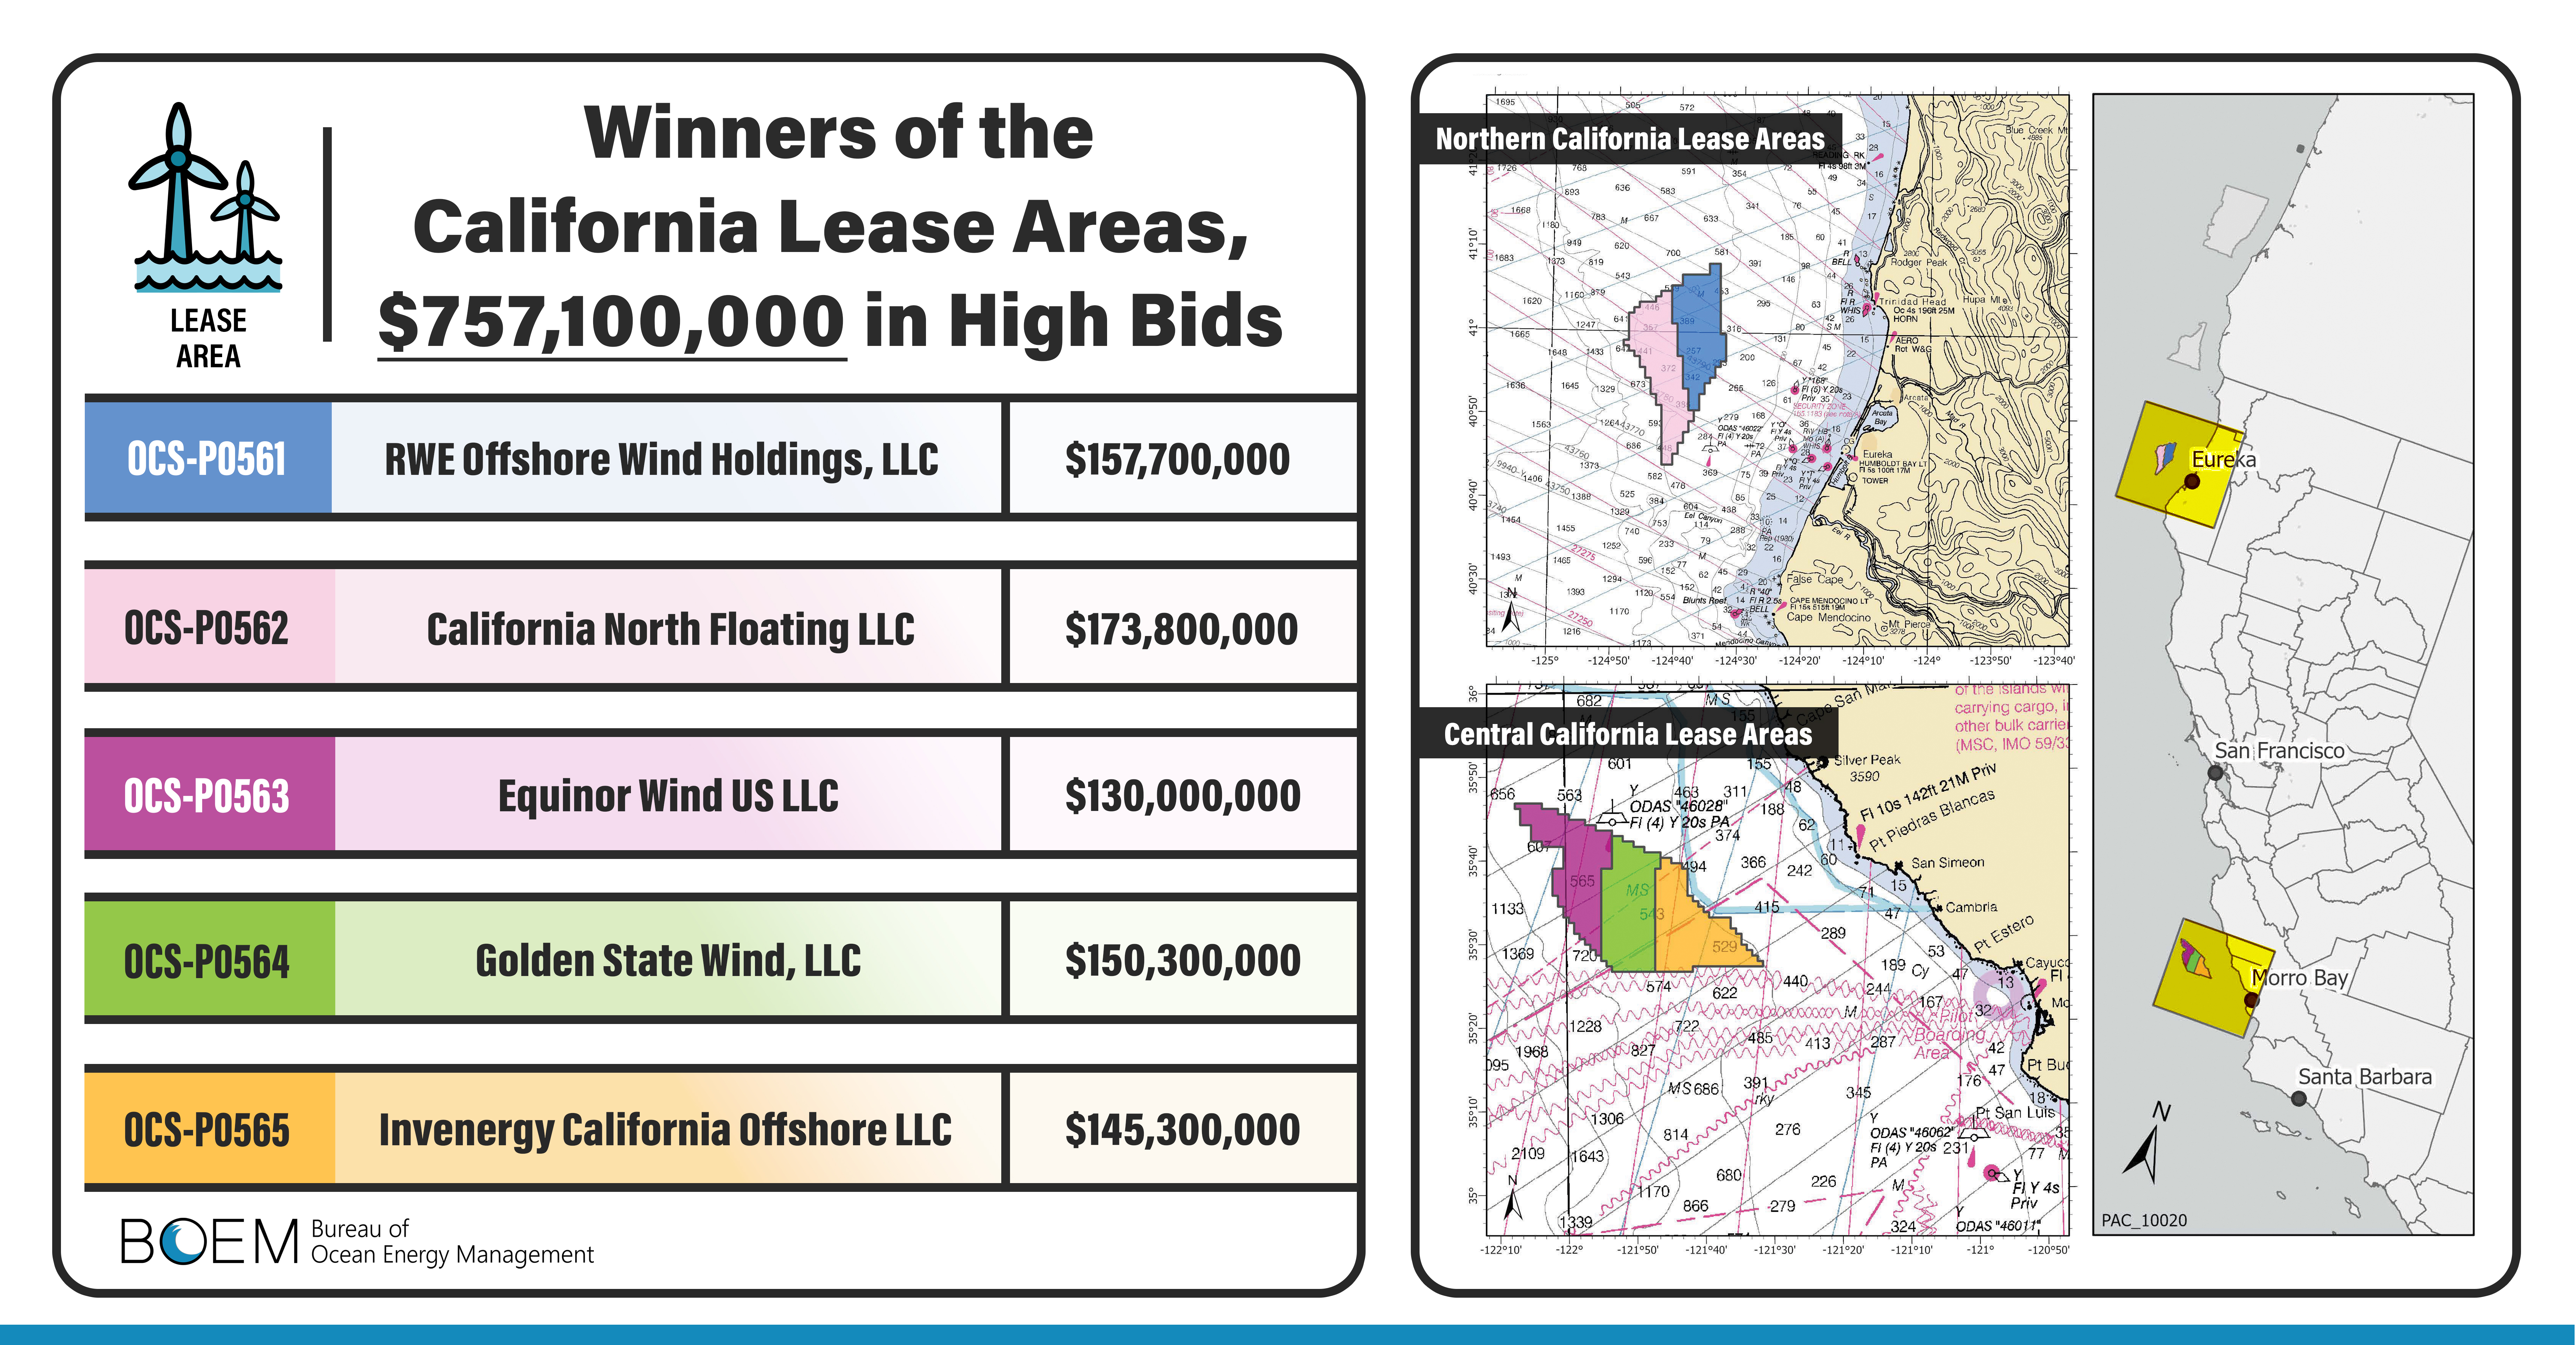
Two of the three Central Coast wind lessees (diagram below) have agreed to lease buyback deals. A lease cancellation letter is attached. The State is challenging the buyback agreements, and is thus in the difficult position of opposing deals that the wind developers voluntarily agreed to and believe are in their best interest. Does the State lose regardless of the outcome of their challenge?
The third Central Coast lessee, Equinor, is curtailing wind investments and has no plans to pursue new offshore wind projects in the US. A buyback deal with Equinor would be complicated by the company’s Empire Wind commitments, and is probably unnecessary given that Equinor has taken itself out of the game.
The two Northern California leases are still active, but the focus has been on regional planning. Funding for necessary infrastructure projects is uncertain and any wind lease development is far in the future.
Posted in California, energy policy, Offshore Wind | Tagged California, challenges, Equinor, floating turbines, infrastructure, Invenergy, lease buybacks, Offshore Wind | Leave a Comment »
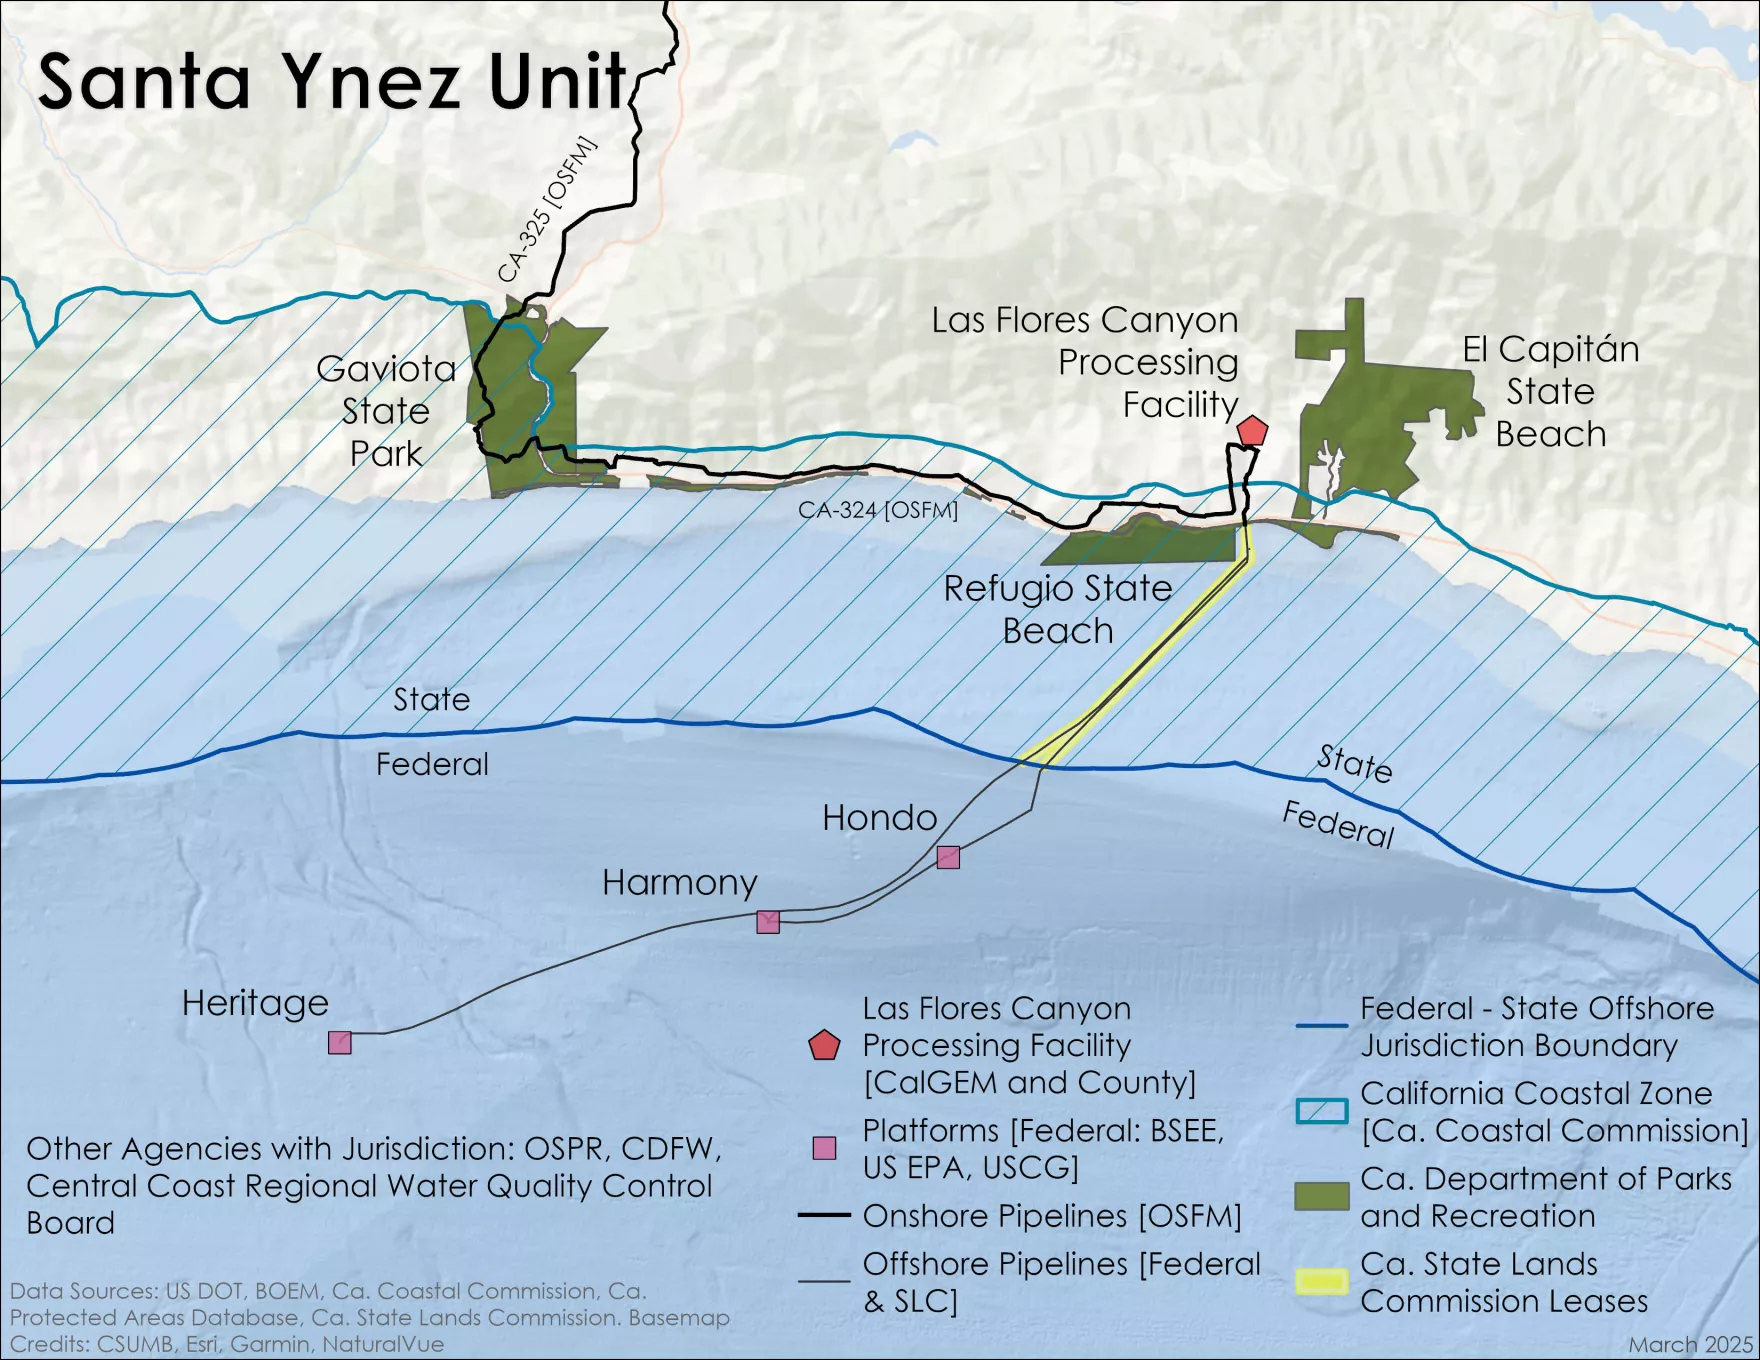
The National Defense Authorization Act (NDAA), as passed by the House this week, includes an amendment (attached) authorizing the Federal govt to acquire all lands along the Santa Ynez Pipeline System route. Wesley Hunt (TX), who introduced the amendment, comments in the short video below. The Senate has yet to approve the bill.
Assuming Sable’s attorneys are able to continue navigating through the legal minefield, the success of the project will depend on the performance of Sable’s well operations and production teams, and the extent to which they have the authority and confidence to curtail operations when deemed necessary to protect workers and the environment. In that regard, MMA engineers and inspectors have an important role in identifying risks and assuring that they are mitigated.
Excerpt from the amendment:
SEC. 28ll. ACQUISITION OF EASEMENTS FOR DEFENSE FUEL SUPPLY INFRASTRUCTURE.
(a) AUTHORITY TO ACQUIRE.—The Secretary of Defense is authorized to acquire, by purchase, donation, exchange, or condemnation, on behalf of the United States, such permanent easements over all lands along the route of the Santa Ynez Pipeline System, including all lands owned or otherwise held by the State of California or any agency, department, or instrumentality thereof, as the Secretary of Defense determines necessary to ensure continuous pipeline transportation of crude oil from the Santa Ynez Unit to domestic refineries supplying Department of Defense installations in the State of California
Posted in California, energy policy, Offshore Energy - General, Regulation | Tagged amendment, NDAA, pipeline, Sable Offshore, Santa Ynez Unit, Wesley Hunt | Leave a Comment »
MMA and NRC signed an MOU (attached) to strengthen cooperation on potential nuclear projects on the OCS. Nuclear power has been on the alternate use list (Rigs-to-Reefs+++) from the outset, so this is pretty exciting. Challenges and opportunities!
“Submerged reactor systems have been safely deployed in naval applications for decades, demonstrating their potential as a reliable source of energy in demanding marine environments. While no commercial deployment on the Outer Continental Shelf is planned or approved at this time, it could greatly strengthen America’s energy security in the future,” said MMA Acting Director Matt Giacona. “With nearly 3.2 billion acres of the Outer Continental Shelf under federal jurisdiction, this MOU is an important step toward building the technical expertise, regulatory clarity, and interagency coordination needed to assess whether and how this technology could be responsibly implemented in the years ahead.”
Posted in energy policy, Offshore Energy - General, rigs-to-reefs, Uncategorized | Tagged MMS, MOU, NRC, Offshore nuclear plants, Rigs-to-Reactors | Leave a Comment »
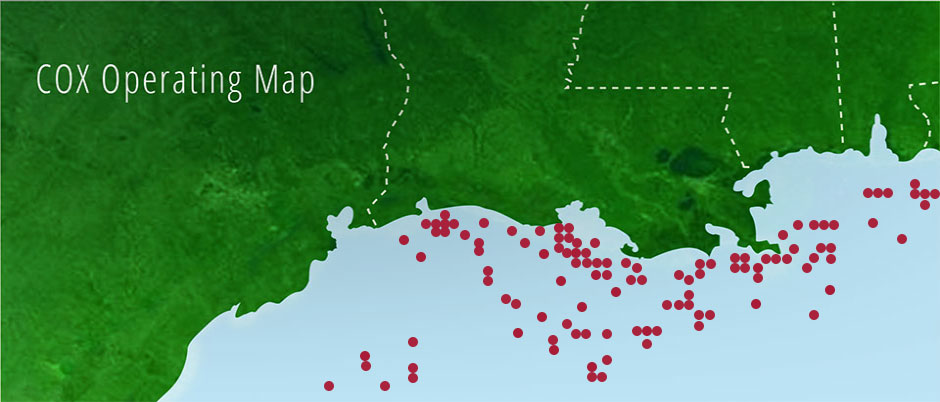


On February 12, 2024, the bankruptcy court approved the sale of certain Cox Operating assets to Natural Resources Worldwide LLC (NRW), a company that had no prior offshore experience. NRW contracted with Array Petroleum to operate 154 Cox legacy platforms (per MMA data). NRW is listed as the operator of just one platform.
The bankruptcy court had previously approved the sale of Cox assets in 6 Gulf of America fields to W&T Offshore.
As noted in previous posts, the Cox legacy of non-compliance has continued under new ownership. In 2026 YTD, Array Petroleum accounted for 52% of Gulf of America Incidents of Non-Compliance (INCs) while operating only 12% of the platforms, and producing only 0.06% of the oil and 0.17% of the gas (2025 production data). Their 2026 YTD INCs/inspection ratio is 7.55 times the Gulf average and 14.6 times the Gulf average if Array inspections are excluded.
The only platform operated directly by NRW was cited for 3 INCs on 2 inspections.
Per MMA data, W&T operates 117 platforms in the Gulf. The number of platforms that were included in the acquisition of the 6 Cox fields is unknown. W&T’s INC/inspection ratio in 2023, the year before the Cox acquisition, was 0.72 (80/111), which was better than their 2026 performance (0.94), but worse than the Gulf-wide 2023 average of 0.57. So W&T’s compliance relative to other Gulf operators was about the same before and after the acquisition.
According to the borehole file, neither Array, NRW, nor W&T conducted any drilling operations in 2026 YTD.
Kudos to the MMA inspectors for their diligence in identifying INCs and issuing citations. The 2026 YTD data table is below.
| W | CSI | FSI | total INCs | facility insp | INCs/isp | |
| Array | 403 | 115 | 4 | 522 | 88 | 5.93 |
| NRW | 1 | 2 | 0 | 3 | 2 | 1.50 |
| W&T | 38 | 46 | 4 | 88 | 94 | 0.94 |
| GoA total | 653 | 296 | 56 | 1005 | 1280 | 0.785 |
Posted in Offshore Energy - General, Regulation, Gulf of Mexico | Tagged Array Petroleum, bankruptcy, compliance, Cox Operating, INCs, inspections, Natural Resources Worldwide, violations, W&T offshore | Leave a Comment »
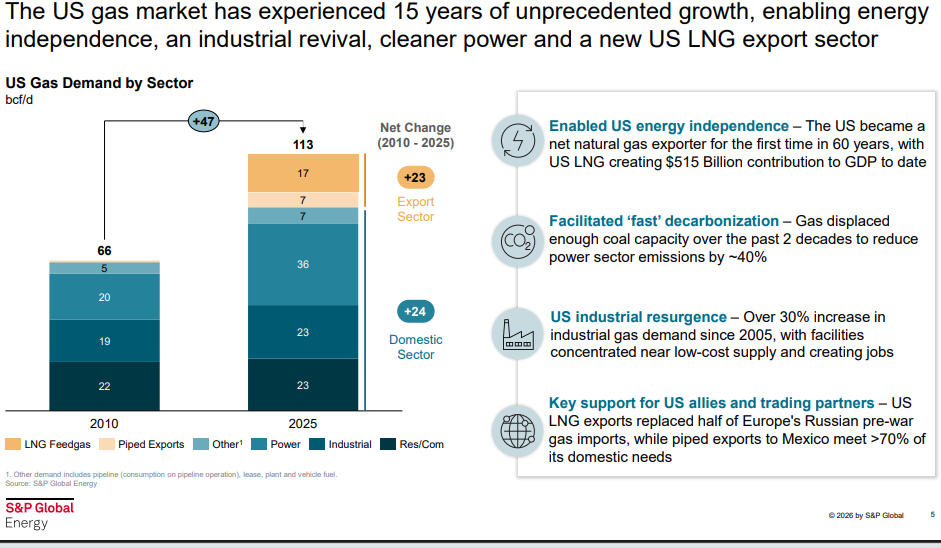
Quotes and graphics from S&P Global:
“Profound growth of LNG is exceeding all expectations,” said Daniel Yergin. “Economic gains in terms of jobs, GDP and labor income are on track to surpass all prior expectations, while the abundance of U.S. gas means that domestic prices remain among the lowest in the world.”
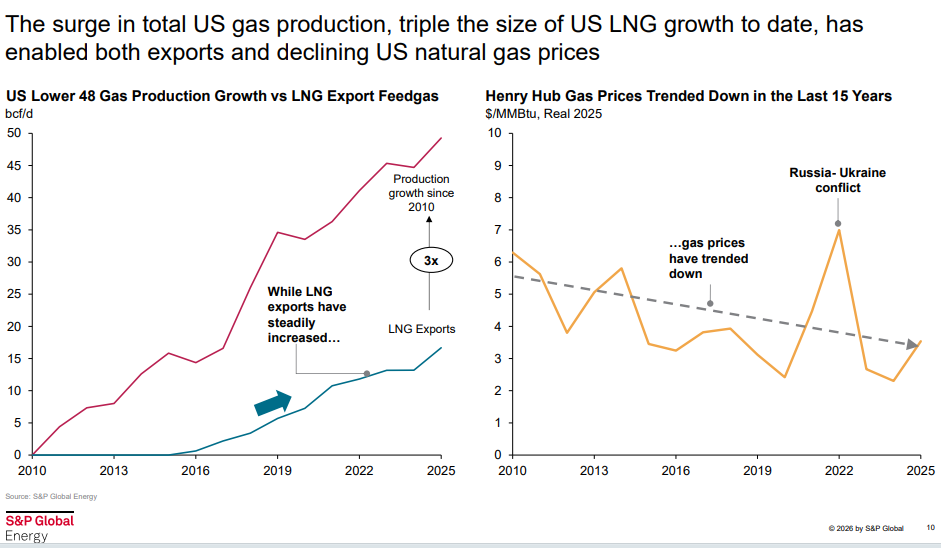
“More than 45 years of identified commercial gas resource in the United States at today’s production levels and the world’s most interconnected pipeline network are what enable both exports and low domestic prices,” said Eric Eyberg, Vice President, Gas and LNG, S&P Global Energy. “Since 2010, domestic prices have trended downward even as demand for U.S. gas has grown 70 percent. The recent Iran conflict has proven the U.S. domestic gas market resilient to external shocks relative to global gas and other commodities. U.S. Henry Hub gas prices declined during the conflict.”
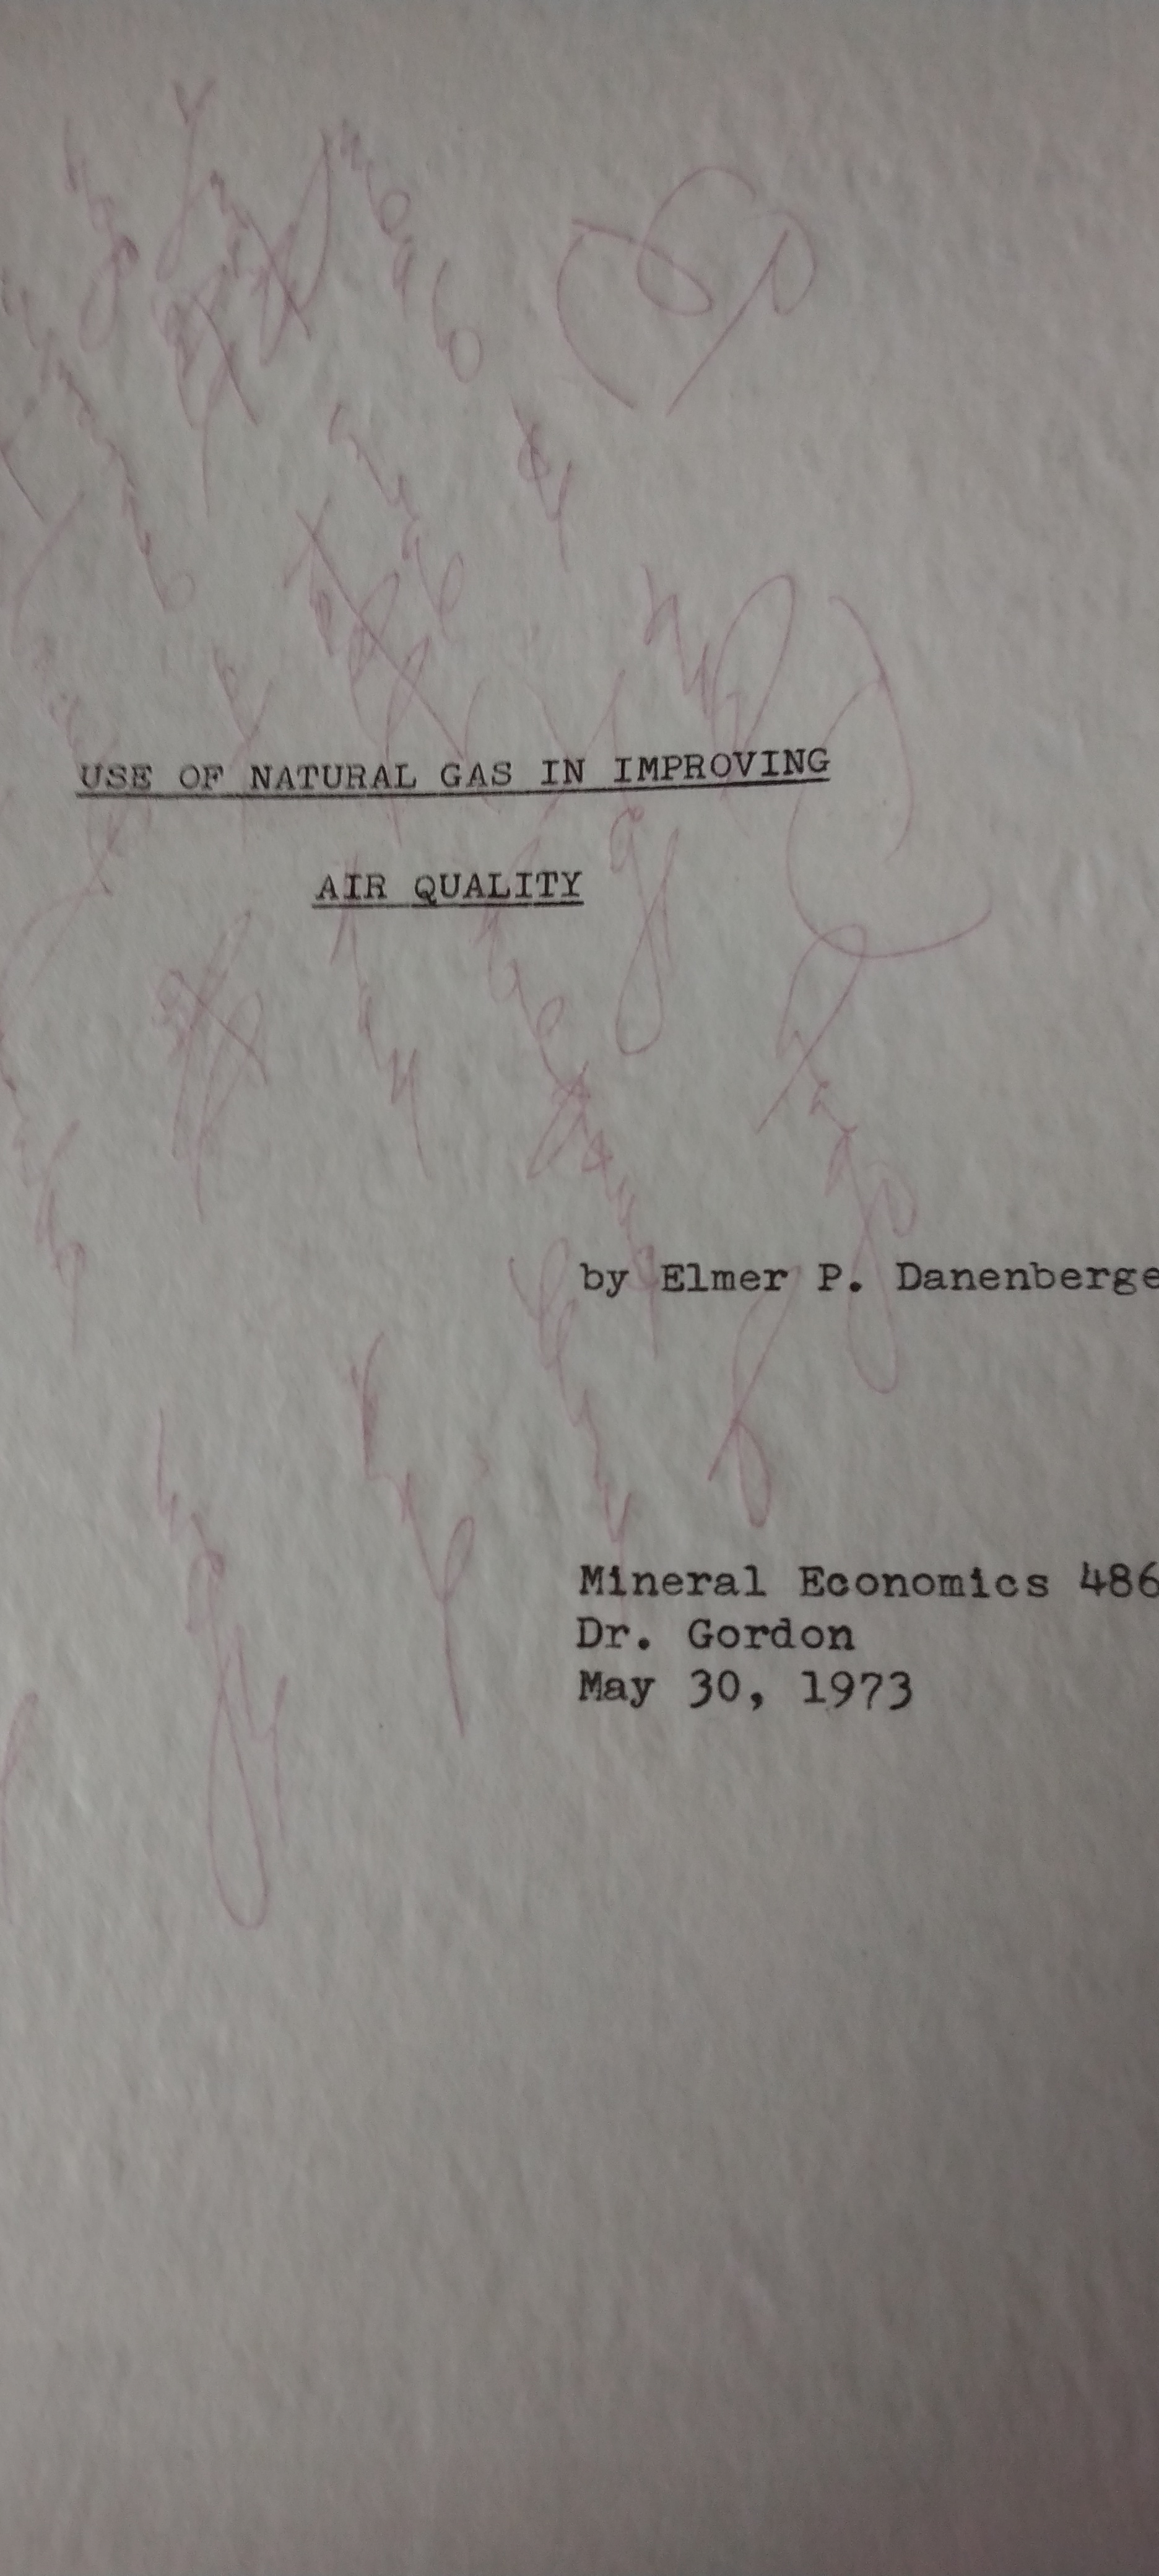
More than 50 years ago as a graduate student, I wrote a paper entitled “The Use of Natural Gas in Improving Air Quality.” My professor, Dr. Richard Gordon, a brilliant economist who greatly influenced my thinking about energy, liked the paper (grade of 93), but thought I was too optimistic about the availability of natural gas (the title page and his comment are captured below). The sense at the time was that natural gas was a premium energy source in short supply, but technical innovation unlocked massive shale gas resources and justified my optimism.
BOE has been celebrating the natural gas revolution since the blog began in 2010. Methane (CH4) is essentially a hydrogen transporter that emits far less CO2 than other fossil fuels when burned. Natural gas’s other important air quality advantages – low NOx, SO2, and particulate emissions – have far greater significance from a human health standpoint. (Many in the US and Canada learned a lot about particulates last weekend!)
The environmental case for offshore natural gas is particularly strong. However, Gulf of America gas production has struggled to compete with the onshore shale sector. Total Gulf production fell to 757 bcf in 2025. 91% of that gas production was from oil wells, primarily high rate deepwater wells.
Sobering resource conservation and emissions fact: The top two 2025 flarers, Russia and Iran, each flared 300 bcf more than the entire 2025 gas production in the Gulf of America. On top of that, keep in mind that the World Bank flaring estimates are probably low.

Posted in flaring and venting, natural gas | Tagged natural gas, shale gas, LNG, Russia, flaring, Iran, US production, air quality | Leave a Comment »
See attached. This is a well written directive. Kudos to the authors.
Retaining the revenue management functions in ONRR is prudent.
There has been no specific announcement regarding the MMA Director, but a quote in the American Samoa lease sale announcement cites Matt Giacona, Acting MMA Director. Congrats to him.
Posted in energy policy, Offshore Energy - General, Regulation | Tagged BOEM, BSEE, Marine Minerals Administration, Matt Giacona, MMS, ONRR, SECRETARIAL Order 3451 | 1 Comment »
