Feeds:
Posts
Comments

Posts Tagged ‘Dos Cuadras field’

World Bank global flaring estimates are now derived from 3 satellites carrying NOAA VIIRS detectors. The increased number of observations improves the precision and accuracy of the flare locations and volume estimates.

The World Bank (WB) Global Gas Flaring Tracker is the only worldwide flaring data source. Offshore and onshore data are segmented, so offshore flaring can be considered separately for each country.

The WB estimates that 21600.03 million cu m (762.5 bcf) of gas were flared at offshore locations worldwide in 2025. This is an increase from 2024 when the total offshore flaring volume was 21159.91 million cu m.

The flaring totals for prominent offshore producers are entered in the table below. Also included are the largest offshore flares for each country.

Unsurprisingly, Norway led the pack in minimizing offshore flaring. Their total of 36.11 million cu m (1.3 bcf) is very impressive for such a large producer. The US offshore total of 160.95 cu m (5.7 bcf) is also quite respectable relative to production.

At the other end of the scale are Iran – 3329 million cu m (118 bcf), Nigeria – 2566 (91 bcf), Angola – 2300 (81 bcf), and Mexico 2068 (73 bcf). These 4 countries accounted for nearly half of all 2025 offshore flaring. They were also massive offshore flarers in 2024: Iran – 3753 million cu m, Nigeria – 2867, Angola – 2040, and Mexico – 2223.

If both onshore and offshore flaring are considered, Iran flared 29931 million cu m in 2025. That equates to 1.057 trillion cu ft!

2025 WB flaring total
million cu meters
largest flarelargest flare volume
Angola2300.26Lombo East862.02
Australia268.36Santos61.89
Brazil969.16Albacora Leste118.93
Canada145.12Terra Nova95.83
China535.56Weizhou 12-168.26
Congo, Rep.788.98Kitina384.12
Gabon368.91Tchatamba Marin37.46
Ghana351.81Sankofa East184.97
Guyana227.38Yellowtail164.06
Indonesia292.16Belida30.84
Iran3329.19Foroozan1360.09
Libya313.78Bouri74.07
Malaysia1459.32Kasawari205.8
Mexico2067.62Akal386.44
Nigeria2565.88Oso308.37
Norway36.11Balder6.38
Qatar688.19Ras Laffan LNG54.65
Russia227.27Yuri Korchagin82.07
Trinidad87.66Atlantic LNG53.23
UK234.08Penguins22.94
US160.95NA*22.77
*The WB lists the field name for the largest US flare as NA. The lat/long for the Whale deepwater platform in the Western Gulf matches the identified flare location (26.22 lat., -94.67 long.)

The WB tracker identifies the Gulf of America facilities with the highest flaring volumes. The 2025 list is pasted below. Repeat top ten Gulf flarers from 2024 were Vito (14.55 million cu m in 2024), Pompano (11.68), and Lucius (5.72).

The WB lists the field name for the largest US flare as NA. The lat/long for the Whale deepwater platform in the Western Gulf matches the identified flare location (26.22 lat., -94.67 long.)

Per the WB tracker, the Terra Nova FPSO, offshore Newfoundland, was the top North American offshore flarer by a considerable margin (data for Canada below). Terra Nova was also the top flarer in 2024 (95.56 million cu m).

The location of the only flare identified offshore California corresponds with that of the Dos Cuadras field in the Santa Barbara Channel. The estimated 2025 flaring volume was 0.10 million cu m.

The WB flaring tracker is an excellent data source, but doesn’t capture vented gas and likely understates the total volume flared. The WB estimated that 160.95 million cu m (5.68 bcf) were flared at US offshore facilities in 2025. This compares with the 9.7 bcf (flaring and venting) and 8.0 bcf (flaring only) totals derived from ONRR data (chart below). The flaring difference is not surprising given that the WB numbers are dependent on satellite imagery and the ONRR data are from mandated/audited production reports. A previous comparison also showed that the WB flaring estimates are significantly lower than the ONRR numbers. From a regulatory oversight perspective, this is rather reassuring given that the reverse (WB>ONRR) would imply serious reporting issues.

Read Full Post »

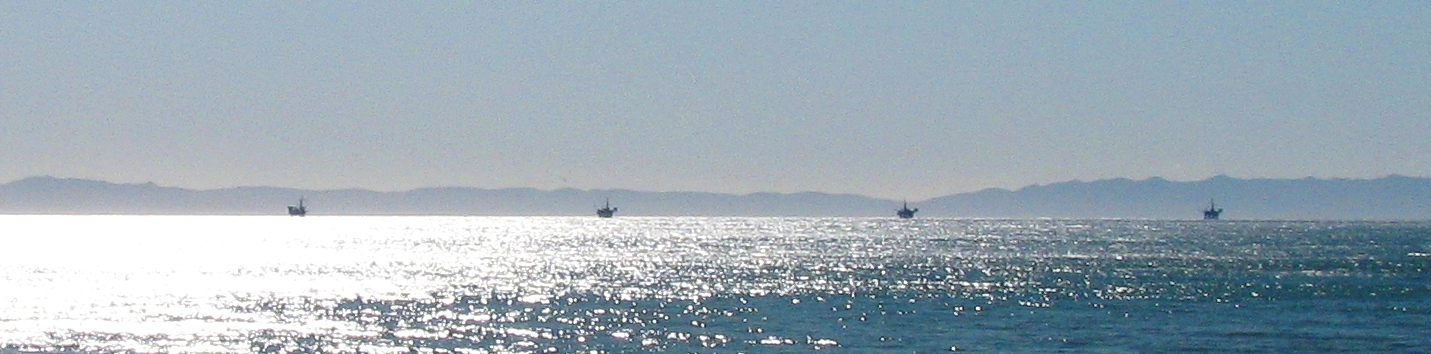
Santa Barbara Channel, Dos Cuadras Field platforms (L to R): Hillhouse, A, B, and C; Antandrus Wiki photo

As part of the recent focus on decommissioning and financial assurance requirements, I looked at borehole data for platforms A, B, and C on Lease OCS-P 0241 in the Santa Barbara Channel. Platform “A” is where a well blew out in 1969, permanently scarring the US offshore program. Observations:

  • There are 140 completed and unplugged wells on the 3 platforms. None of the wells on these platforms have been permanently plugged and only one is temporarily abandoned.
  • The latest available production information (2024 data) indicates ave. daily oil production of 3791 bopd for the lease, including 1901 bopd from Platform A, the highest production for any platform in the region in 2024.
  • 41 of the lease’s completed (unplugged) wells are on Platform A.
    • The number of these wells that are currently producing is not publicly available.
    • 30 of the completed Platform A wells were drilled prior to 1985.
    • The blowout well was the 5th well drilled from platform A. All 4 of the wells drilled prior to the 1/28/1969 blowout are still unplugged:
      • well A-20: spudded on 11/19/1968, reached total depth on 12/2/1968
      • well A-41: spudded on 11/27/1968, TD on 12/19/1968
      • well A-25: spudded on 12/18/1968, TD on 12/28/1969
      • well A-38: spudded on 1/12/1969, TD on 1/24/1969
      • Note how quickly the wells were drilled. The wells were shallow (2299-4051′ true vertical depth), and the operator (Union Oil) saved time by omitting a casing string. (This decision was a root cause of the blowout and thus changed history 😡)

Lease documents and regulations at 30 CFR § 250.1710 require that all wells be permanently plugged within one year of lease termination. For leases like 0241 that are still active, 30 CFR § 250.1711 stipulates that BSEE will order a well to be permanently plugged if the well poses a hazard to safety or the environment, or is not useful for lease operations and is not capable of oil, gas, or sulphur production in paying quantities. In the Gulf of America Region, the policy is to require wells that have not been used in the past 5 years to be permanently plugged. Allowing old wells to remain unplugged is neither prudent nor consistent with the regulations.

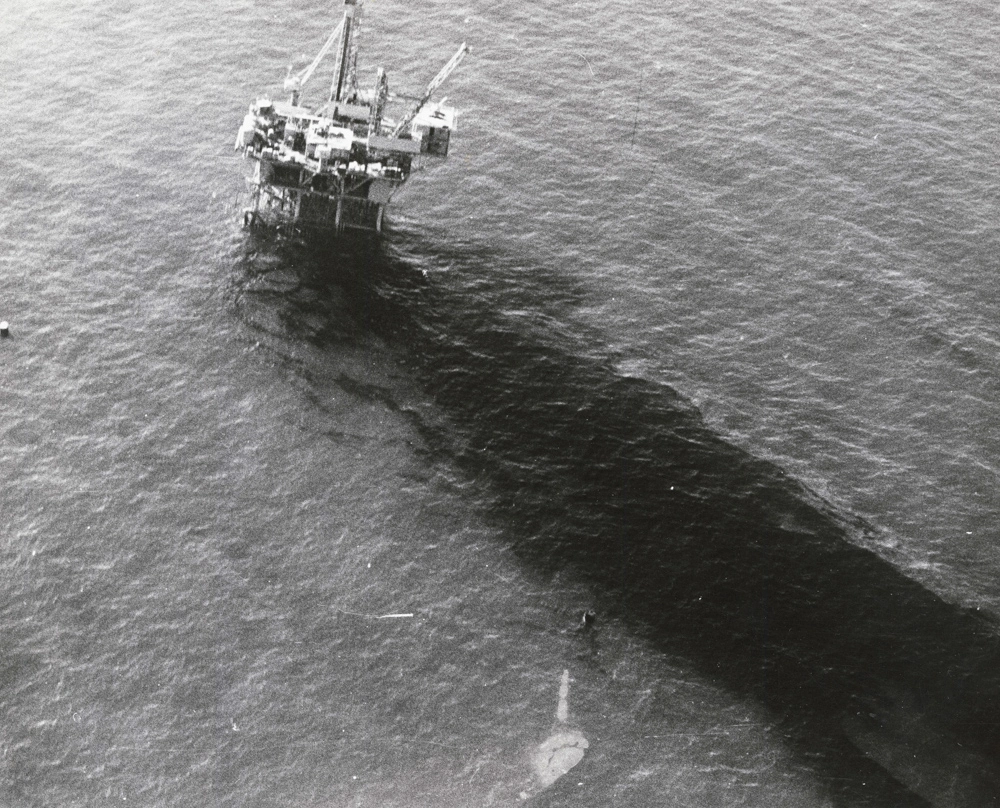
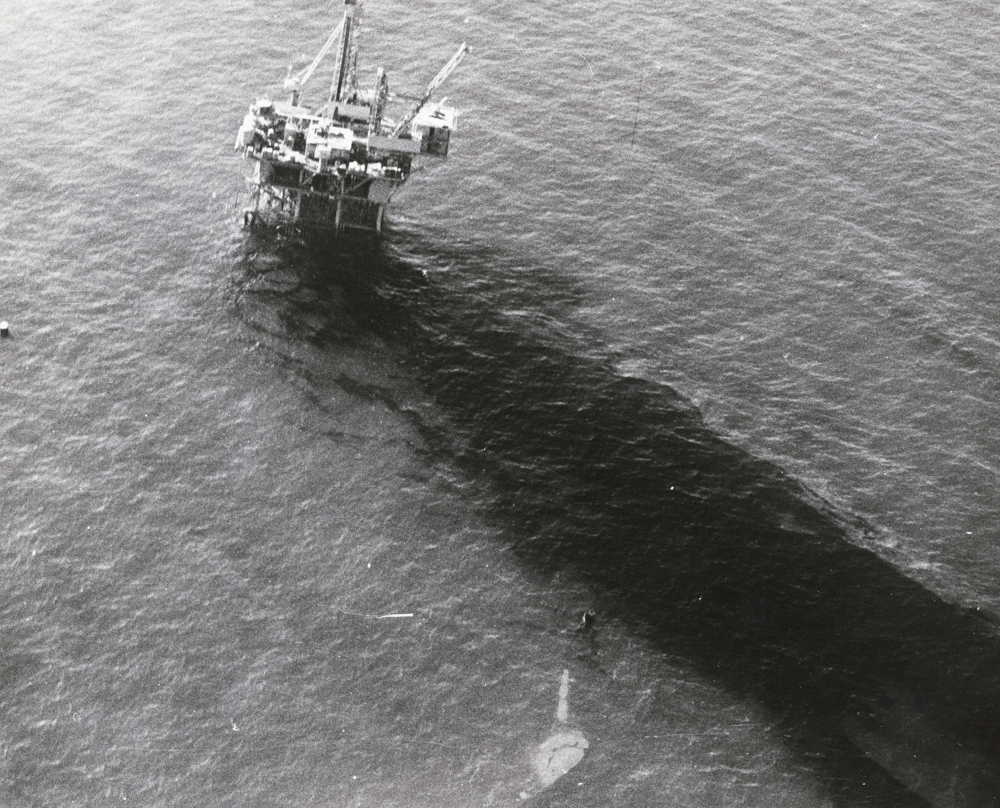
Platform A during 1969 blowout

Read Full Post »

On January 28, 1969, well A-21, the 5th well to be drilled from Union Oil Company’s “A” platform began flowing uncontrollably through fractures into the Santa Barbara Channel.

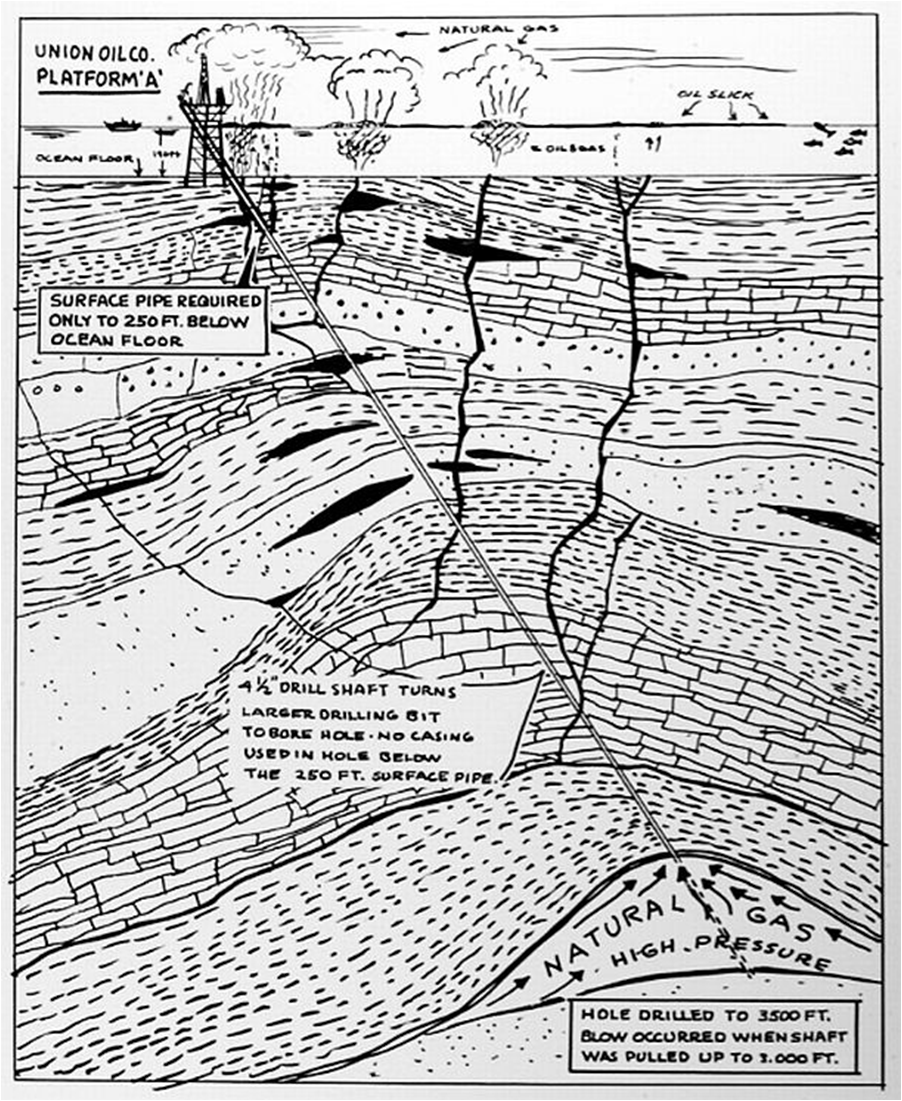
The absence of any well casing to protect the permeable, fractured cap rock meant that the operator couldn’t safely shut-in a sudden influx of hydrocarbons into the well bore (i.e. a “kick”). Shutting-in the well at the surface would create well bore fractures through which oil and gas could migrate to shallow strata and the sea floor. The probability of an oil blowout was thus essentially the same as the probability of a kick (>10-2). Compare this with the historical US offshore oil blowout probability (<10-4) and the probability of <10-5 for wells with optimal barrier management.

Here, in brief, is the well A-21 story:

  • Well drilled to total depth of 3203′ below the ocean floor (BOF).
  • 13 3/8″ casing had been set at 238′ BOF. The well was unprotected from the base of this casing string to total depth.
  • Evidence of natural seeps near the site suggested the presence of fracture channels
  • The well was drilled through permeable cap rock and a small high pressured gas reservoir before penetrating the target oil sands.
  • When the well reached total depth, the crew started pulling drill pipe out of hole to in preparation for well logging.
  • The first 5 stands of drill pipe pulled tight; the next 3 pulled free suggesting the swabbing of fluids into the well bore..
  • The well started flowing through the drill pipe. The crew attempted to stab an inside preventer into the drill pipe, but the well was blowing too hard. The crew then attempted unsuccessfully to stab the kelly into the drill pipe and halt the flow.
  • The crew dropped the drill pipe into the well bore and closed the blind ram to shut-in the well.
  • Boils of gas began to appear on the water surface. Oil flowed to the surface through numerous fracture channels. The above sketch by former colleague Jerry Daniels (RIP) depicts the fracturing, which greatly complicated mitigation of the flow.

Here is the link to an excellent US Geological Survey report from 1969 that describes the geologic setting, well activities, and remedial measures after the blowout.

We need to continue studying these historically important incidents, not just the technical details but also the human and organizational factors that allowed such safety and environmental disasters to occur. The idea is not to shame, but to remember and better understand.

Read Full Post »

Details on the Santa Barbara blowout from last year’s BOE post.

Read Full Post »