The World Bank (WB) Global Gas Flaring Tracker is the only worldwide flaring data source. Offshore and onshore data are segmented, so offshore flaring can be considered separately for each country.
The WB estimates that 21600.03 million cu m (762.5 bcf) of gas were flared at offshore locations worldwide in 2025. This is an increase from 2024 when the total offshore flaring volume was 21159.91 million cu m.
The flaring totals for prominent offshore producers are entered in the table below. Also included are the largest offshore flares for each country.
Unsurprisingly, Norway led the pack in minimizing offshore flaring. Their total of 36.11 million cu m (1.3 bcf) is very impressive for such a large producer. The US offshore total of 160.95 cu m (5.7 bcf) is also quite respectable relative to production.
At the other end of the scale are Iran – 3329 million cu m (118 bcf), Nigeria – 2566 (91 bcf), Angola – 2300 (81 bcf), and Mexico 2068 (73 bcf). These 4 countries accounted for nearly half of all 2025 offshore flaring. They were also massive offshore flarers in 2024: Iran – 3753 million cu m, Nigeria – 2867, Angola – 2040, and Mexico – 2223.
If both onshore and offshore flaring are considered, Iran flared 29931 million cu m in 2025. That equates to 1.057 trillion cu ft!
| 2025 WB flaring total million cu meters | largest flare | largest flare volume | |
| Angola | 2300.26 | Lombo East | 862.02 |
| Australia | 268.36 | Santos | 61.89 |
| Brazil | 969.16 | Albacora Leste | 118.93 |
| Canada | 145.12 | Terra Nova | 95.83 |
| China | 535.56 | Weizhou 12-1 | 68.26 |
| Congo, Rep. | 788.98 | Kitina | 384.12 |
| Gabon | 368.91 | Tchatamba Marin | 37.46 |
| Ghana | 351.81 | Sankofa East | 184.97 |
| Guyana | 227.38 | Yellowtail | 164.06 |
| Indonesia | 292.16 | Belida | 30.84 |
| Iran | 3329.19 | Foroozan | 1360.09 |
| Libya | 313.78 | Bouri | 74.07 |
| Malaysia | 1459.32 | Kasawari | 205.8 |
| Mexico | 2067.62 | Akal | 386.44 |
| Nigeria | 2565.88 | Oso | 308.37 |
| Norway | 36.11 | Balder | 6.38 |
| Qatar | 688.19 | Ras Laffan LNG | 54.65 |
| Russia | 227.27 | Yuri Korchagin | 82.07 |
| Trinidad | 87.66 | Atlantic LNG | 53.23 |
| UK | 234.08 | Penguins | 22.94 |
| US | 160.95 | NA* | 22.77 |
The WB tracker identifies the Gulf of America facilities with the highest flaring volumes. The 2025 list is pasted below. Repeat top ten Gulf flarers from 2024 were Vito (14.55 million cu m in 2024), Pompano (11.68), and Lucius (5.72).

Per the WB tracker, the Terra Nova FPSO, offshore Newfoundland, was the top North American offshore flarer by a considerable margin (data for Canada below). Terra Nova was also the top flarer in 2024 (95.56 million cu m).

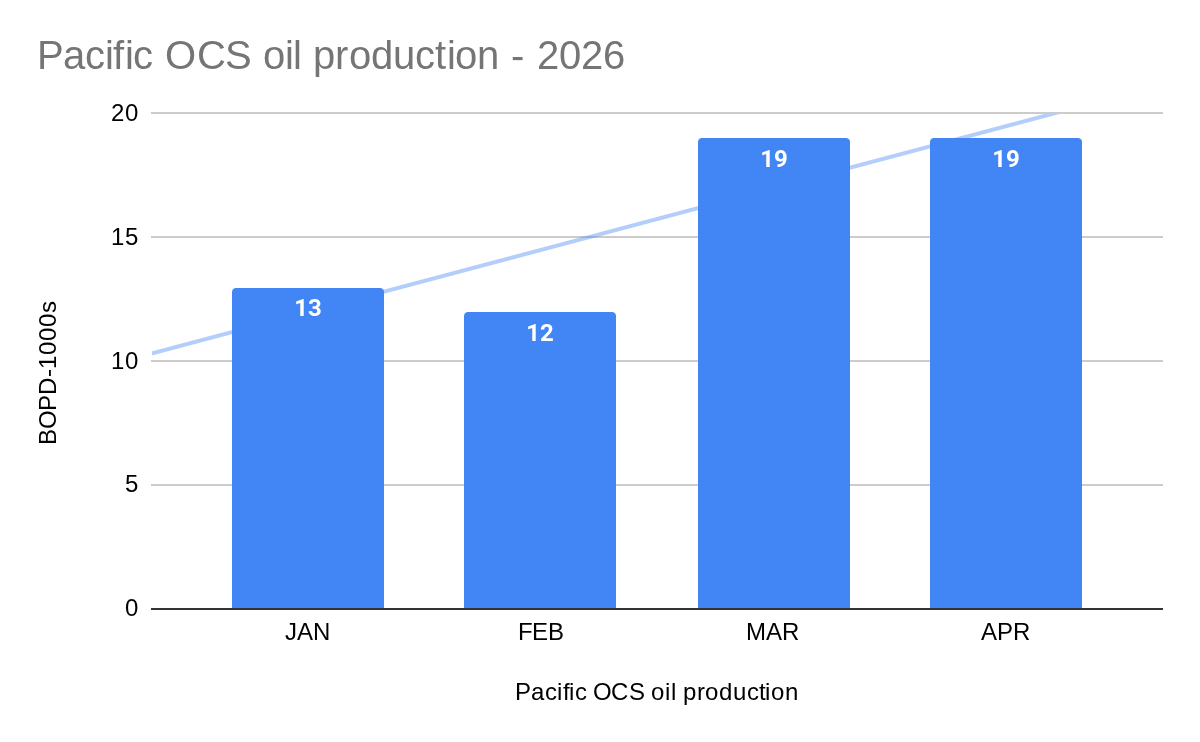
The location of the only flare identified offshore California corresponds with that of the Dos Cuadras field in the Santa Barbara Channel. The estimated 2025 flaring volume was 0.10 million cu m.
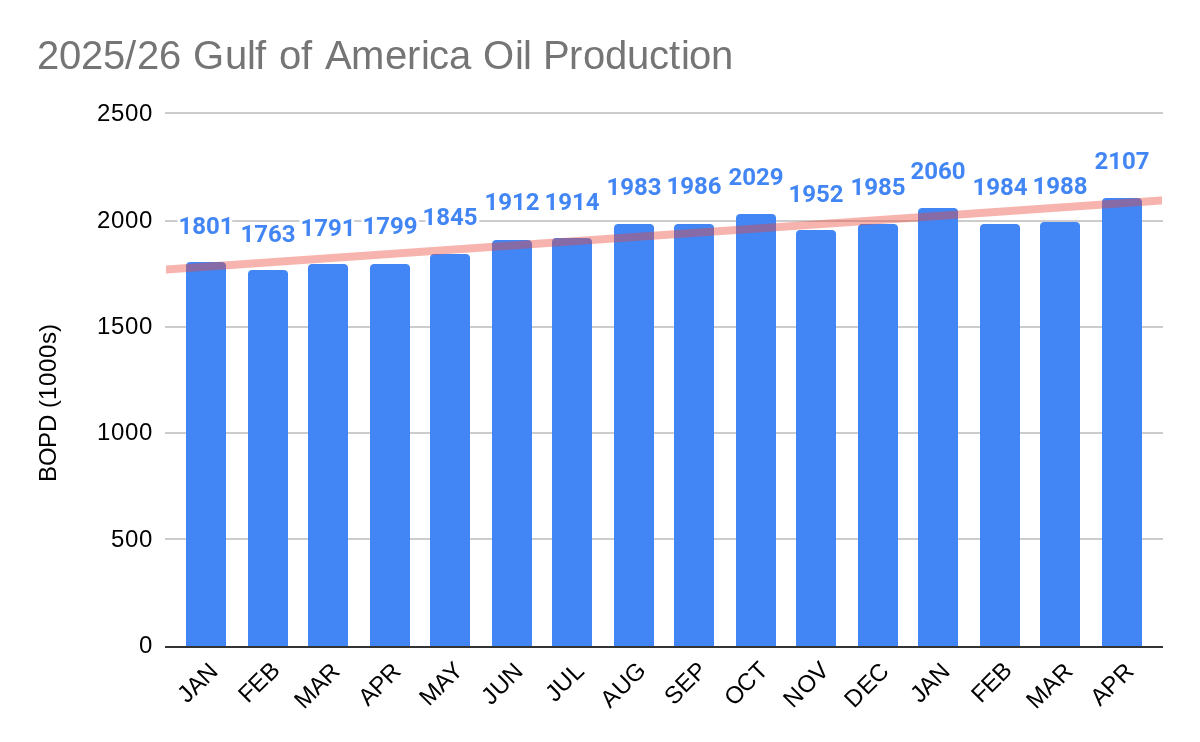
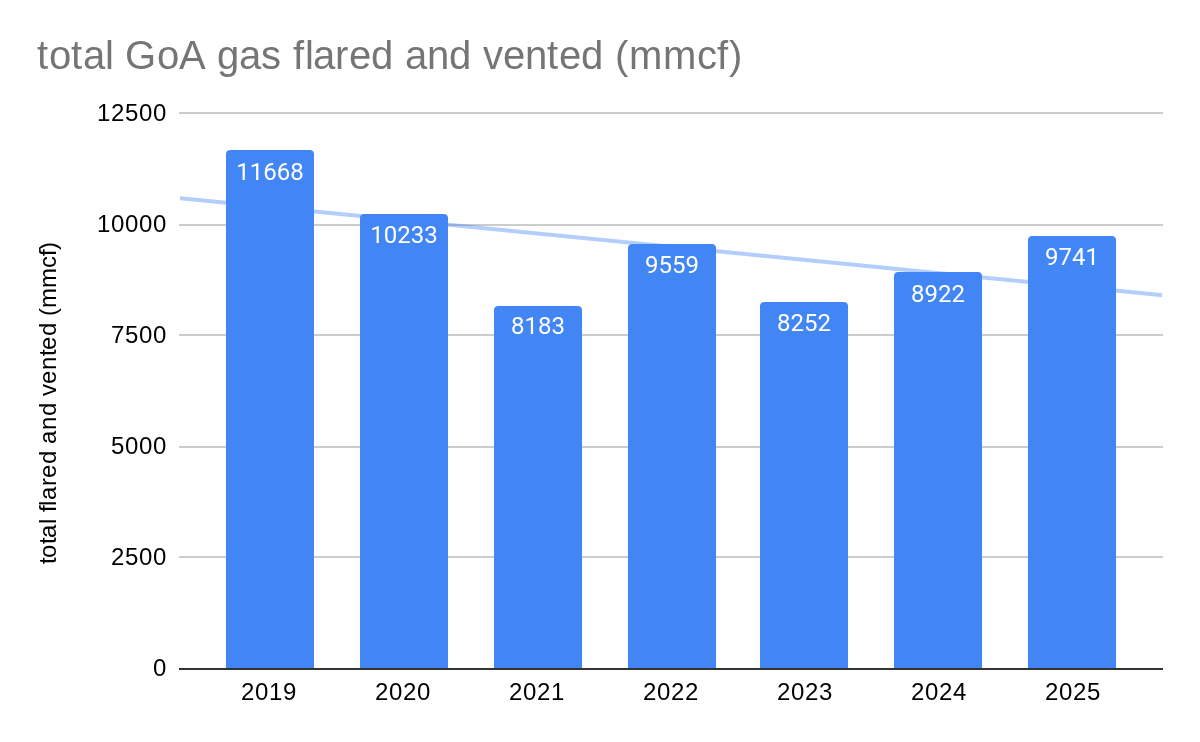
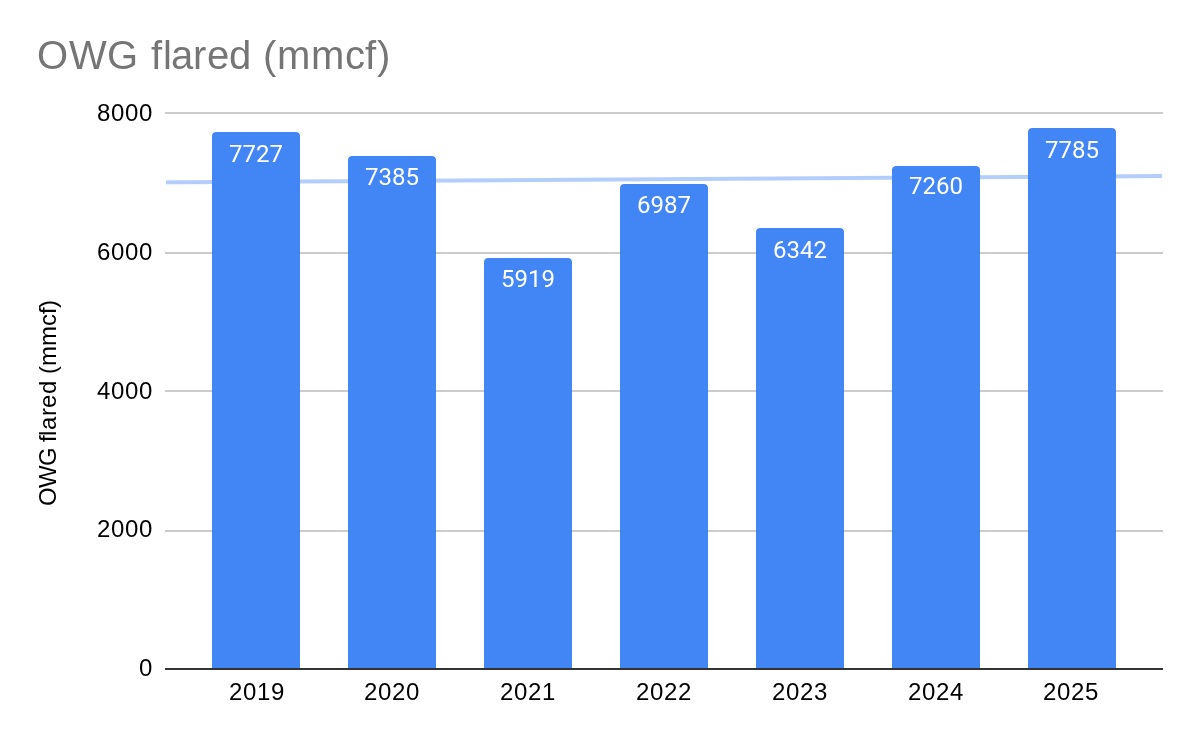
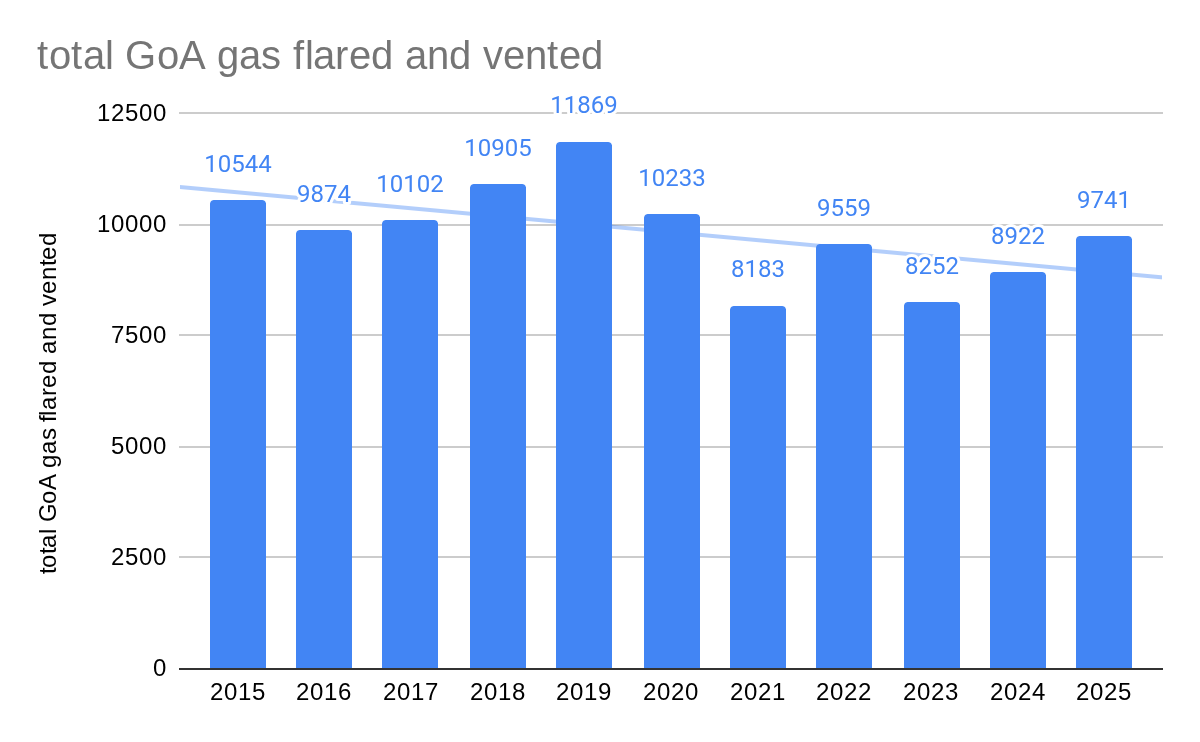
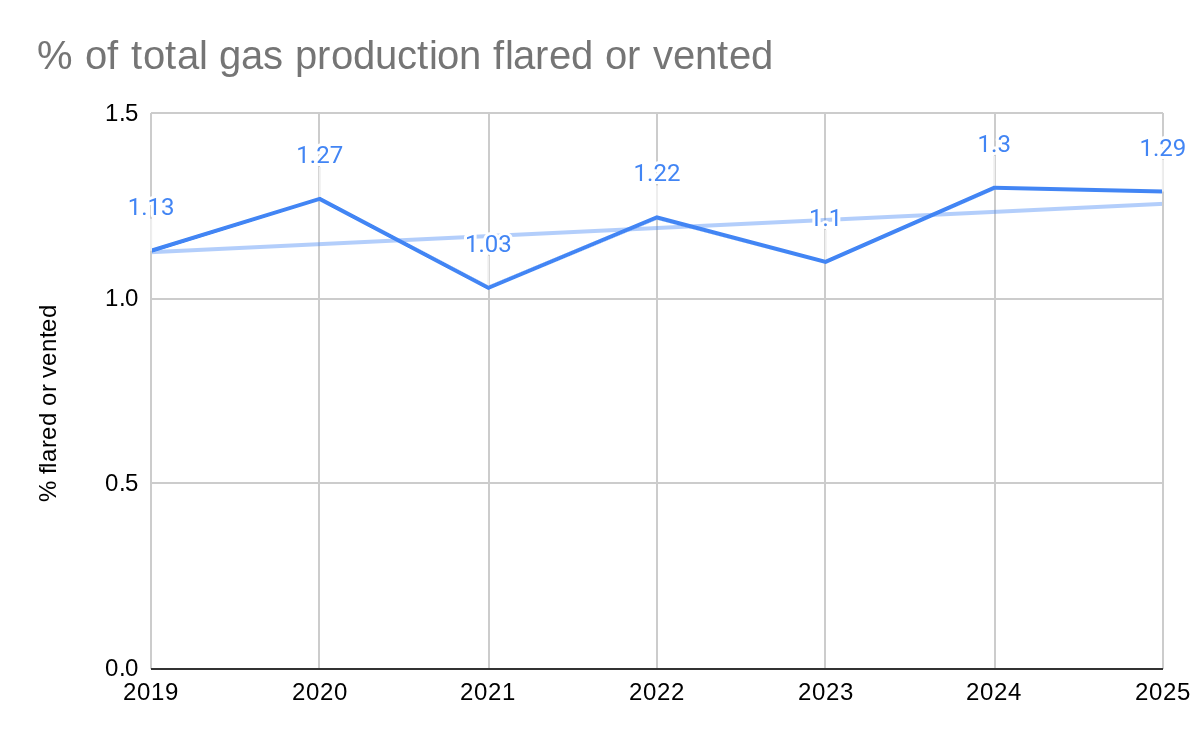
The WB flaring tracker is an excellent data source, but doesn’t capture vented gas and likely understates the total volume flared. The WB estimated that 160.95 million cu m (5.68 bcf) were flared at US offshore facilities in 2025. This compares with the 9.7 bcf (flaring and venting) and 8.0 bcf (flaring only) totals derived from ONRR data (chart below). The flaring difference is not surprising given that the WB numbers are dependent on satellite imagery and the ONRR data are from mandated/audited production reports. A previous comparison also showed that the WB flaring estimates are significantly lower than the ONRR numbers. From a regulatory oversight perspective, this is rather reassuring given that the reverse (WB>ONRR) would imply serious reporting issues.