Gulf of America flaring and venting data for 2019-2025 are summarized in the attached table. The preferred performance indicators are the percentages of produced gas that are flared and vented both for oil-well gas (OWG, also known as associated or casinghead gas) and gas-well gas (GWG or non-associated gas).
The flaring and venting table was compiled using monthly data submitted to the Office of Natural Resources Revenue (ONRR). This is the best data source because reporting is mandatory and strictly enforced, and flaring and venting are accounted for separately. All volumes are in millions of cubic feet (MMCF).
The venting and flaring volumes are segmented for both OWG and GWG production. Venting produced gas (mostly methane) is a more significant environmental concern from both air quality and greenhouse gas (GHG) perspectives.
Observations and Comments:
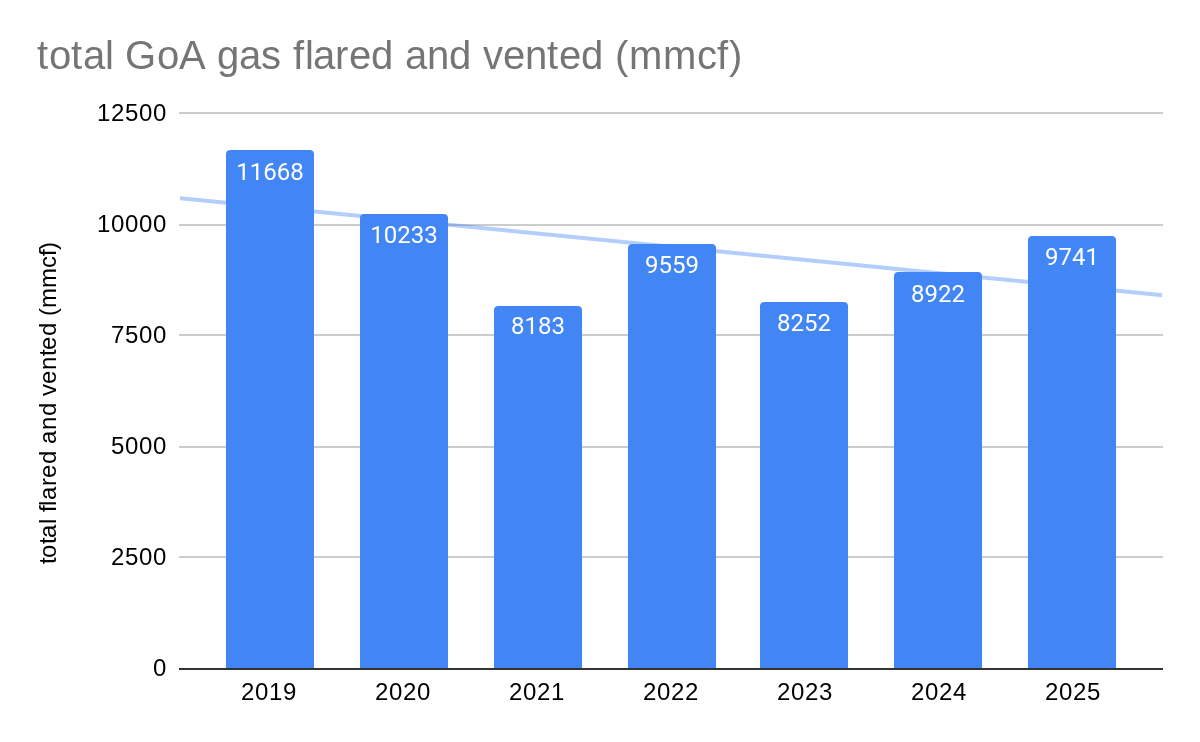
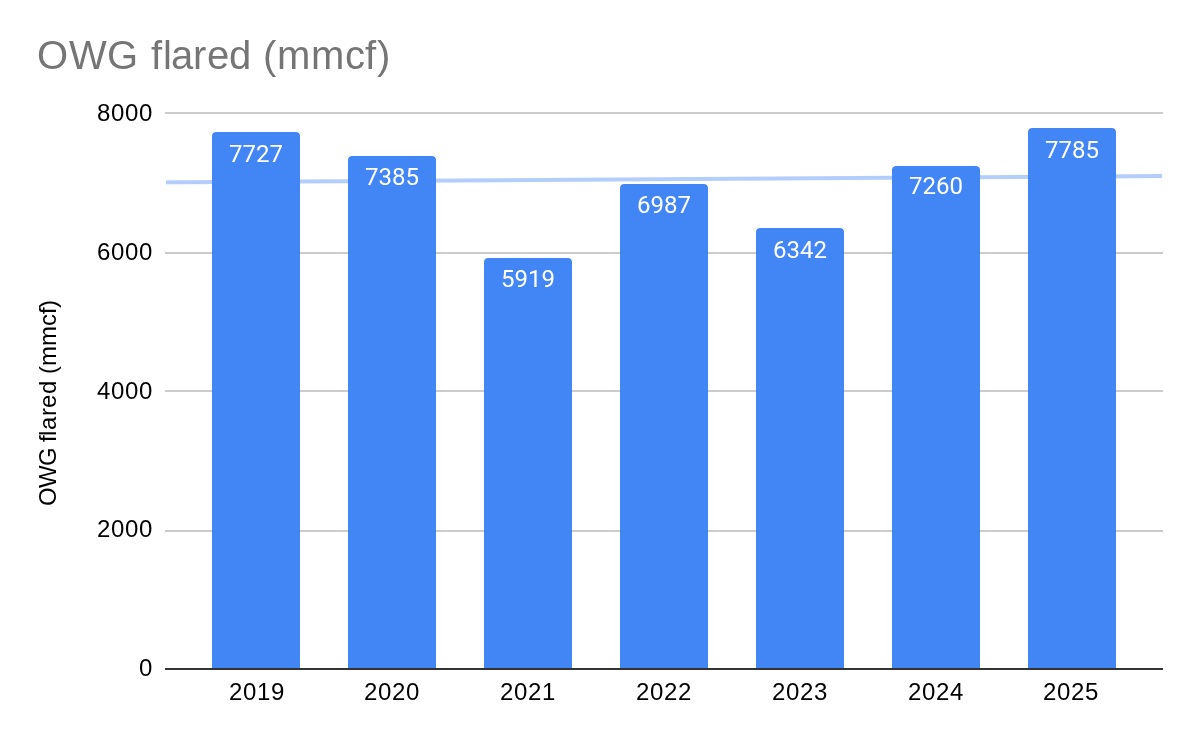
- The total volume of gas flared and vented in 2025 was 9.7 bcf (chart 1). 80% of that volume was flared, leaving 20% vented. OWG flaring (chart 5) reached a new high of 7.785 bcf in 2025, a near record oil production year for the Gulf.
- Total venting and flaring in 2025 increased by 819 million cubic feet vs. 2024. However, the 7-year trend line remains favorable (chart 1).
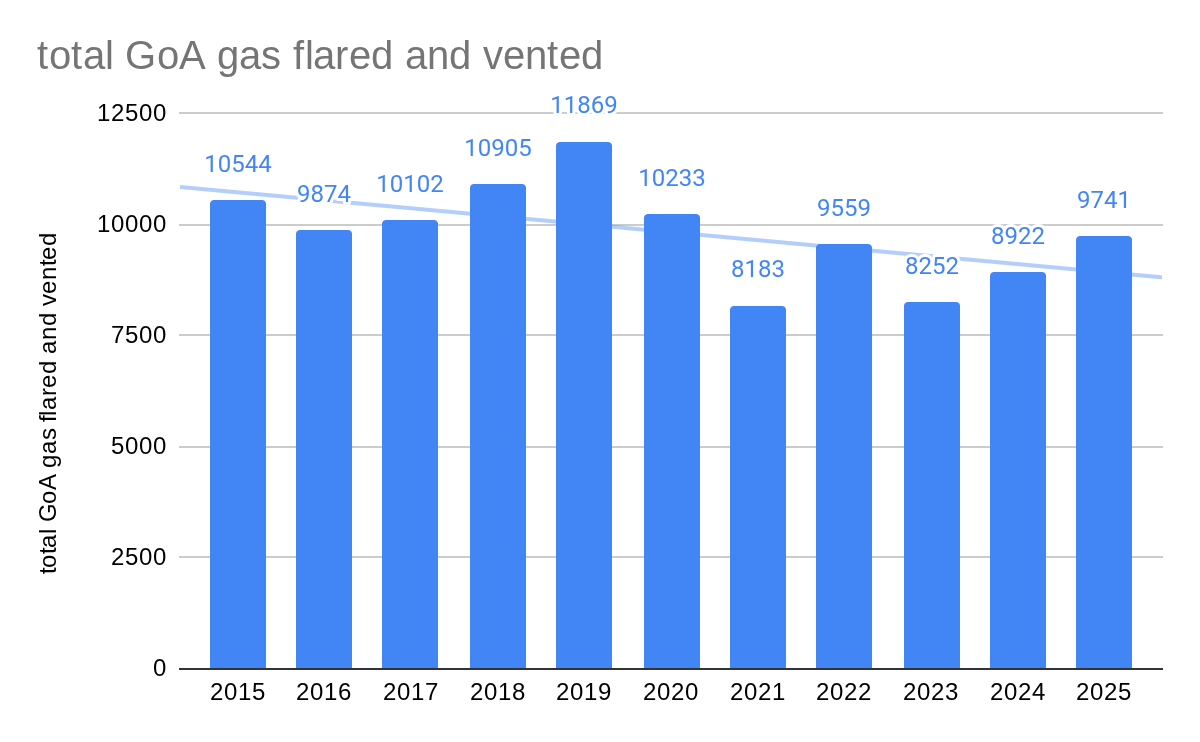
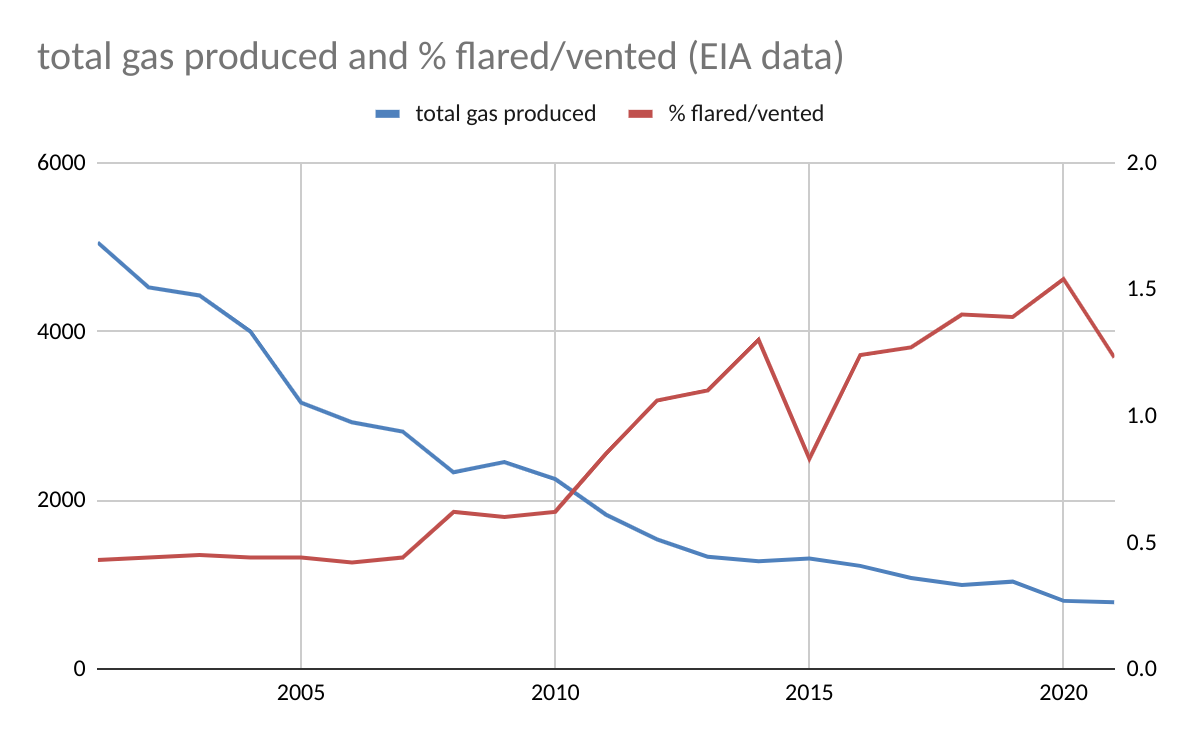
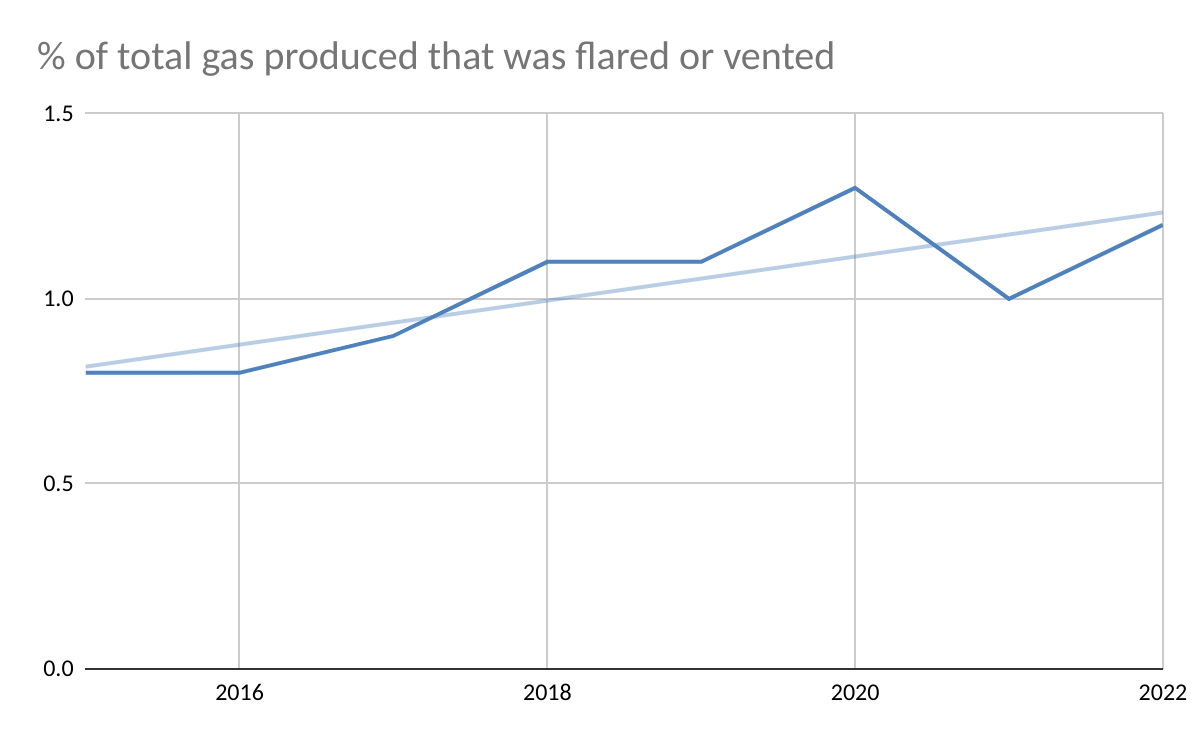
- Thinking that 2019, a record year for total flaring and venting, may have biased the trend line, I extended the chart back to 2015, the first year for which I have ONRR data. As you can see in chart 2, the overall trend is still favorable.
- The % of produced gas that was flared or vented remains persistently above the historical 1.0% target (chart 3). Flared/vented volumes were below 1% of production prior to 2018.
- The higher flaring/venting % may be because most gas production is now from oil wells, which typically have higher flaring rates associated with processing upsets.
- The flaring and venting gap between GWG and OWG has narrowed, largely because of an increase in GWG flaring/venting. The combined rate for GWG more than doubled over the 7 year period, rising to 0.81% vs. 1.34% for OWG. (chart 3)
- Total venting rose to 1.7 bcf in 2025, the highest venting volume in 3 years.
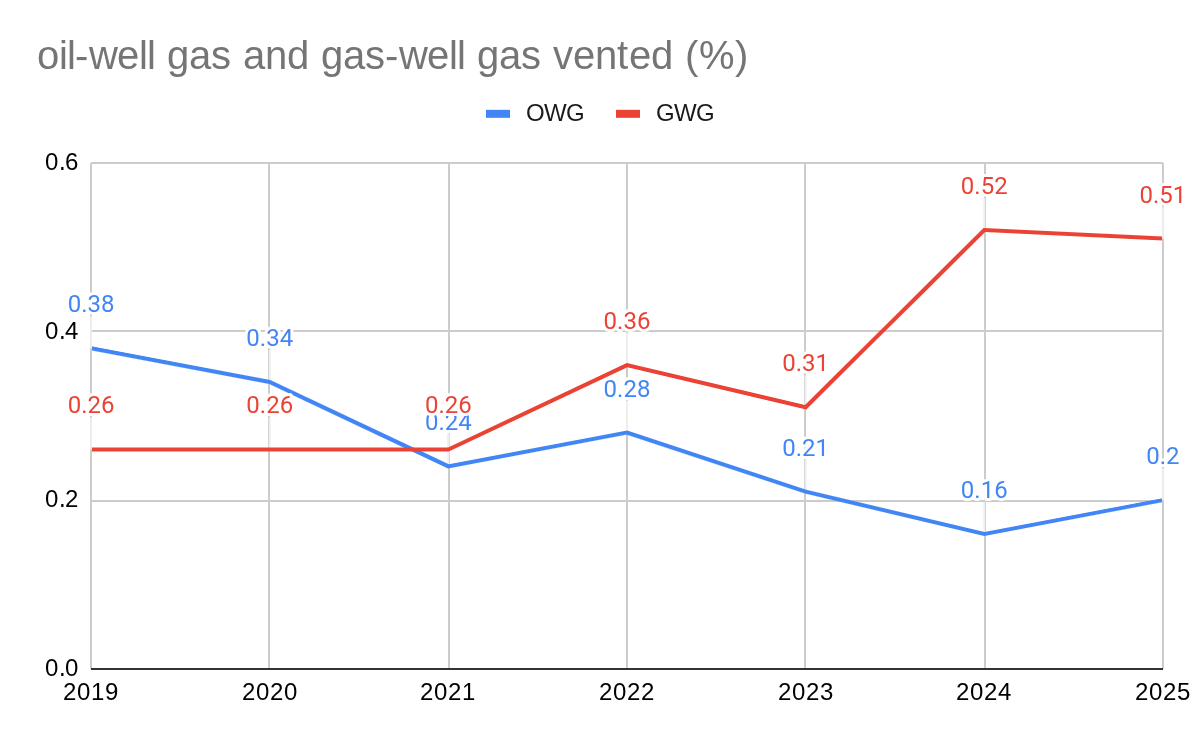
- The % of GWG being vented doubled over the past 5 years to over 0.50% (chart 4). The growth in venting warrants further investigation.
- The % of OWG vented increased slightly to 0.20%. Further reduction in OWG venting had been expected given that OWG production is increasingly from deepwater facilities with modern flaring systems.
- A 2020 Univ. of Michigan study found “Large, older facilities situated in shallow waters tended to produce episodic, disproportionally high spikes of methane emissions. These facilities, which have more than seven platforms apiece, contribute to nearly 40% of emissions, yet consist of less than 1% of total platforms.”
- Platform specific data would be helpful in further assessing flaring/venting sources and trends.



 Bud's Offshore Energy (BOE)