From ONRR OGOR B data:
| 2021 | 2022 | |
| OWG flared | 5919 | 6987 |
| OWG vented | 1405 | 1638 |
| GWG flared | 311 | 213 |
| GWG vented | 548 | 722 |
| total flared and vented | 8183 | 9559 |
| total gas prodution | 791,983 | 784,238 |
| % flared or vented | 1.03 | 1.22 |
Observations:
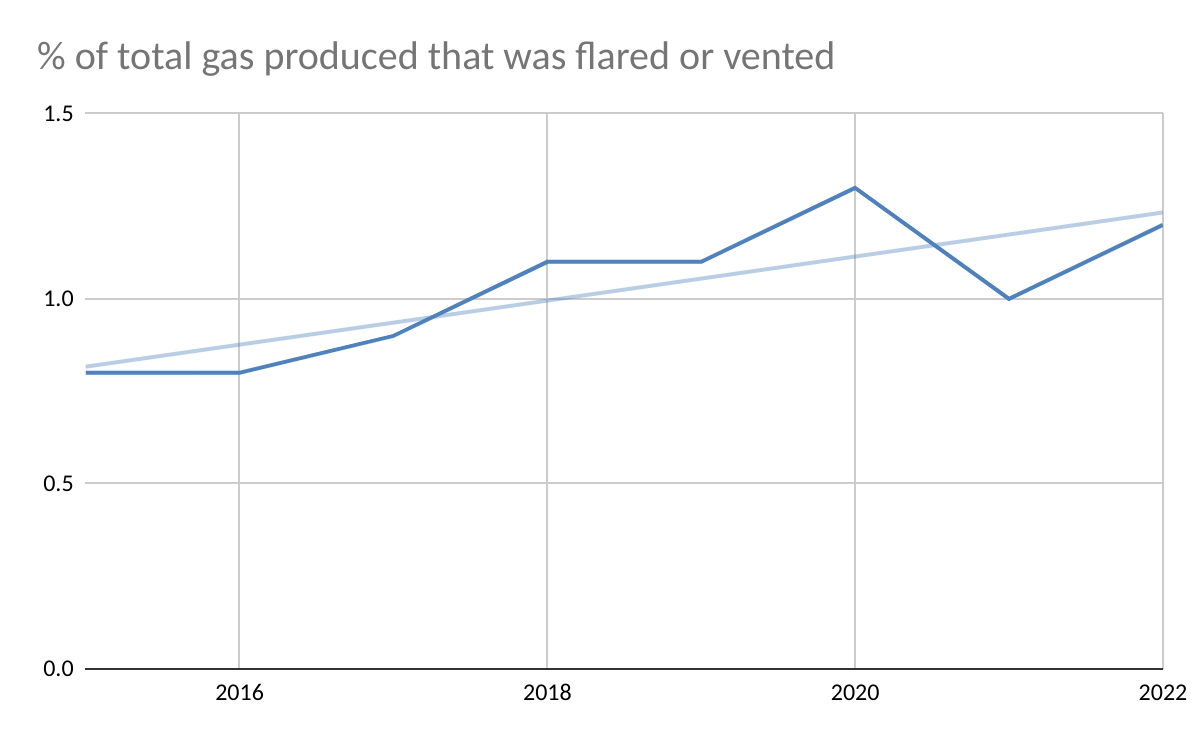
- Of the 784 bcf produced, 9.6 bcf (1.2%) were either vented or flared (vs. 1.03% in 2021). With the exception of 2020 (1.3%), this is the highest % of gas flared/vented from 2015-2022.
- The % of gas produced that is flared or vented is trending upward (first chart below).
- Both the gas flaring and venting volumes were higher in 2022 (vs. 2021) despite lower gas production.
- Assuming oil-well gas (OWG) production of 600 bcf (final 2022 volume not yet available), approximately 1.4% (8.6/600) of the OWG was flared or vented.
- 2022 OWG flaring volume increased by 18% vs. 2022 despite nearly identical total oil production
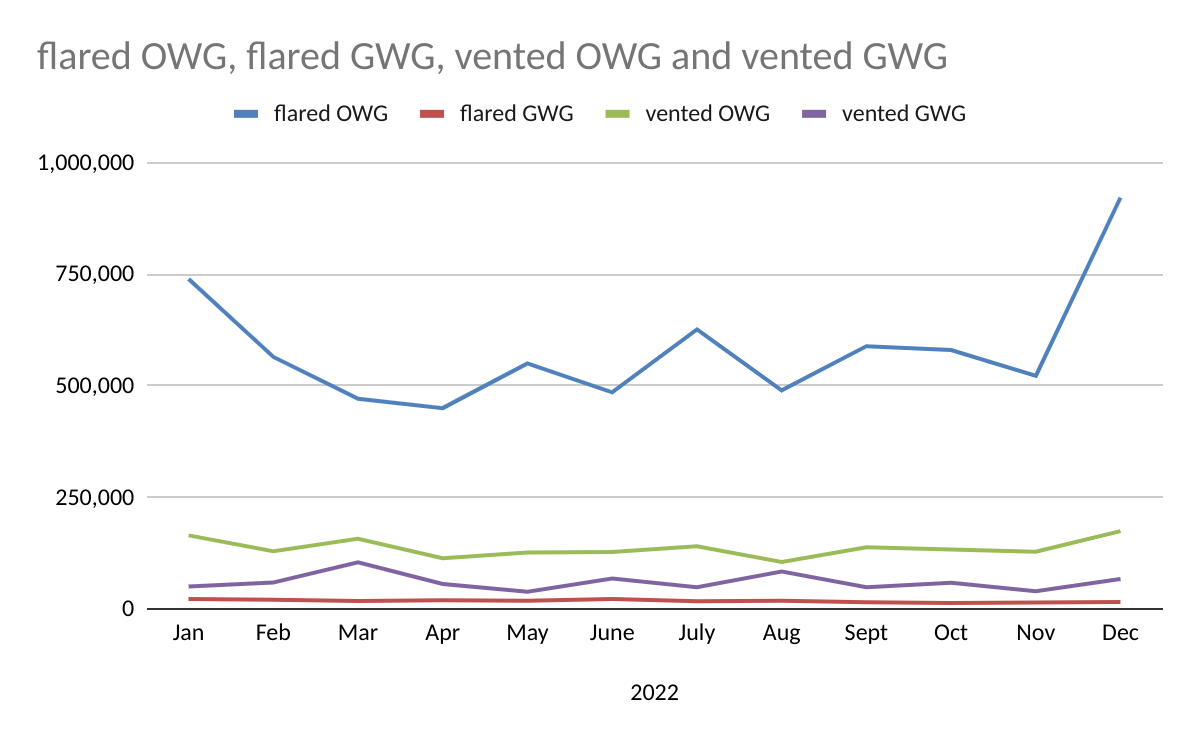
- A very large increase in OWG flaring in December skewed the 2022 data (921 million cu ft vs 522 million in November, see 2nd chart below). OWG vented and gas-well gas (GWG) vented also spiked in December (third chart). Were these spikes associated with production startups, major compressor issues, administrative/accounting corrections, or other issues?
- Although total venting increased by 407 million cu ft (21%) in 2023 vs. 2022, the overall venting trend is still favorable (last chart).
- The previously noted inconsistencies in flaring data sets remain a concern.
- Kudos to ONRR for posting the flaring/venting data.
- More regulator/industry transparency on flaring episodes is needed, particularly in light of the PNAS paper and the June 2022 Inspector General Report.


related:

Leave a comment