Quotes and graphics from S&P Global:
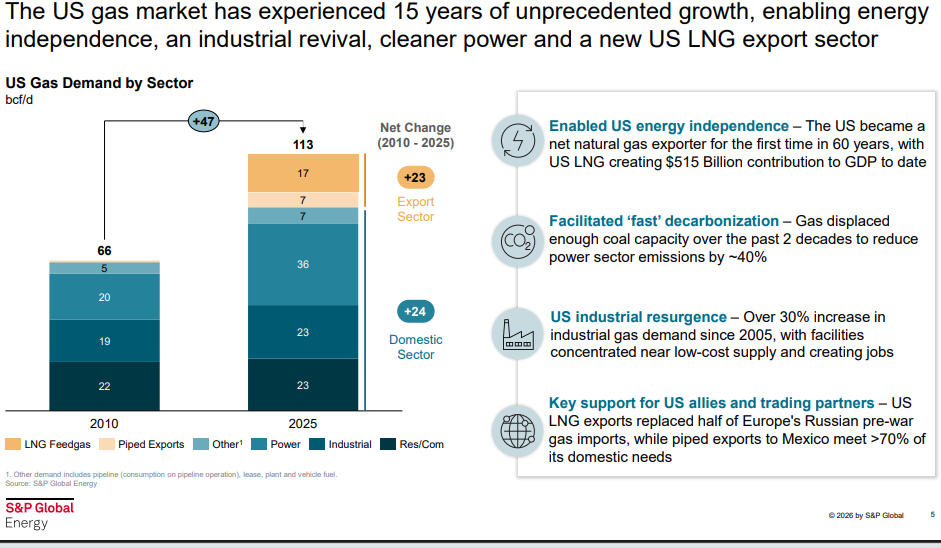
“Profound growth of LNG is exceeding all expectations,” said Daniel Yergin. “Economic gains in terms of jobs, GDP and labor income are on track to surpass all prior expectations, while the abundance of U.S. gas means that domestic prices remain among the lowest in the world.”
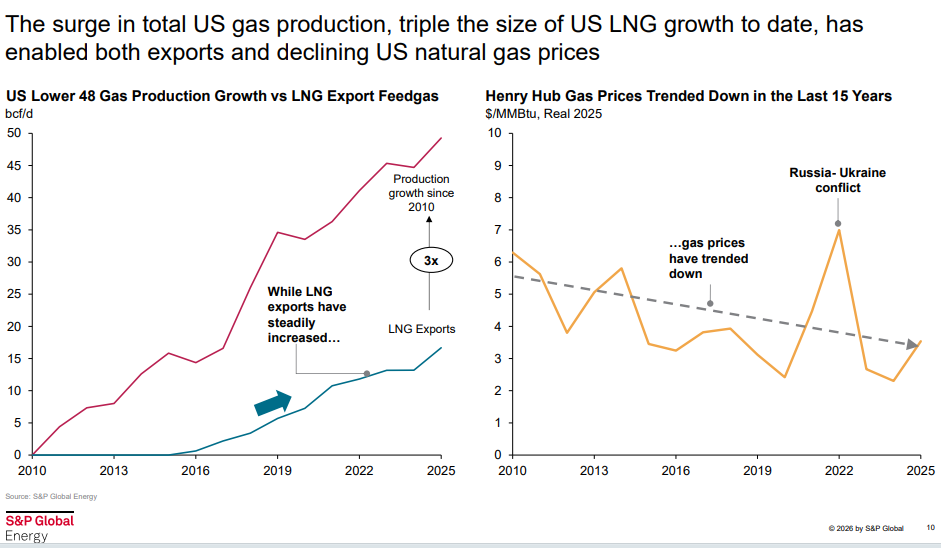
“More than 45 years of identified commercial gas resource in the United States at today’s production levels and the world’s most interconnected pipeline network are what enable both exports and low domestic prices,” said Eric Eyberg, Vice President, Gas and LNG, S&P Global Energy. “Since 2010, domestic prices have trended downward even as demand for U.S. gas has grown 70 percent. The recent Iran conflict has proven the U.S. domestic gas market resilient to external shocks relative to global gas and other commodities. U.S. Henry Hub gas prices declined during the conflict.”
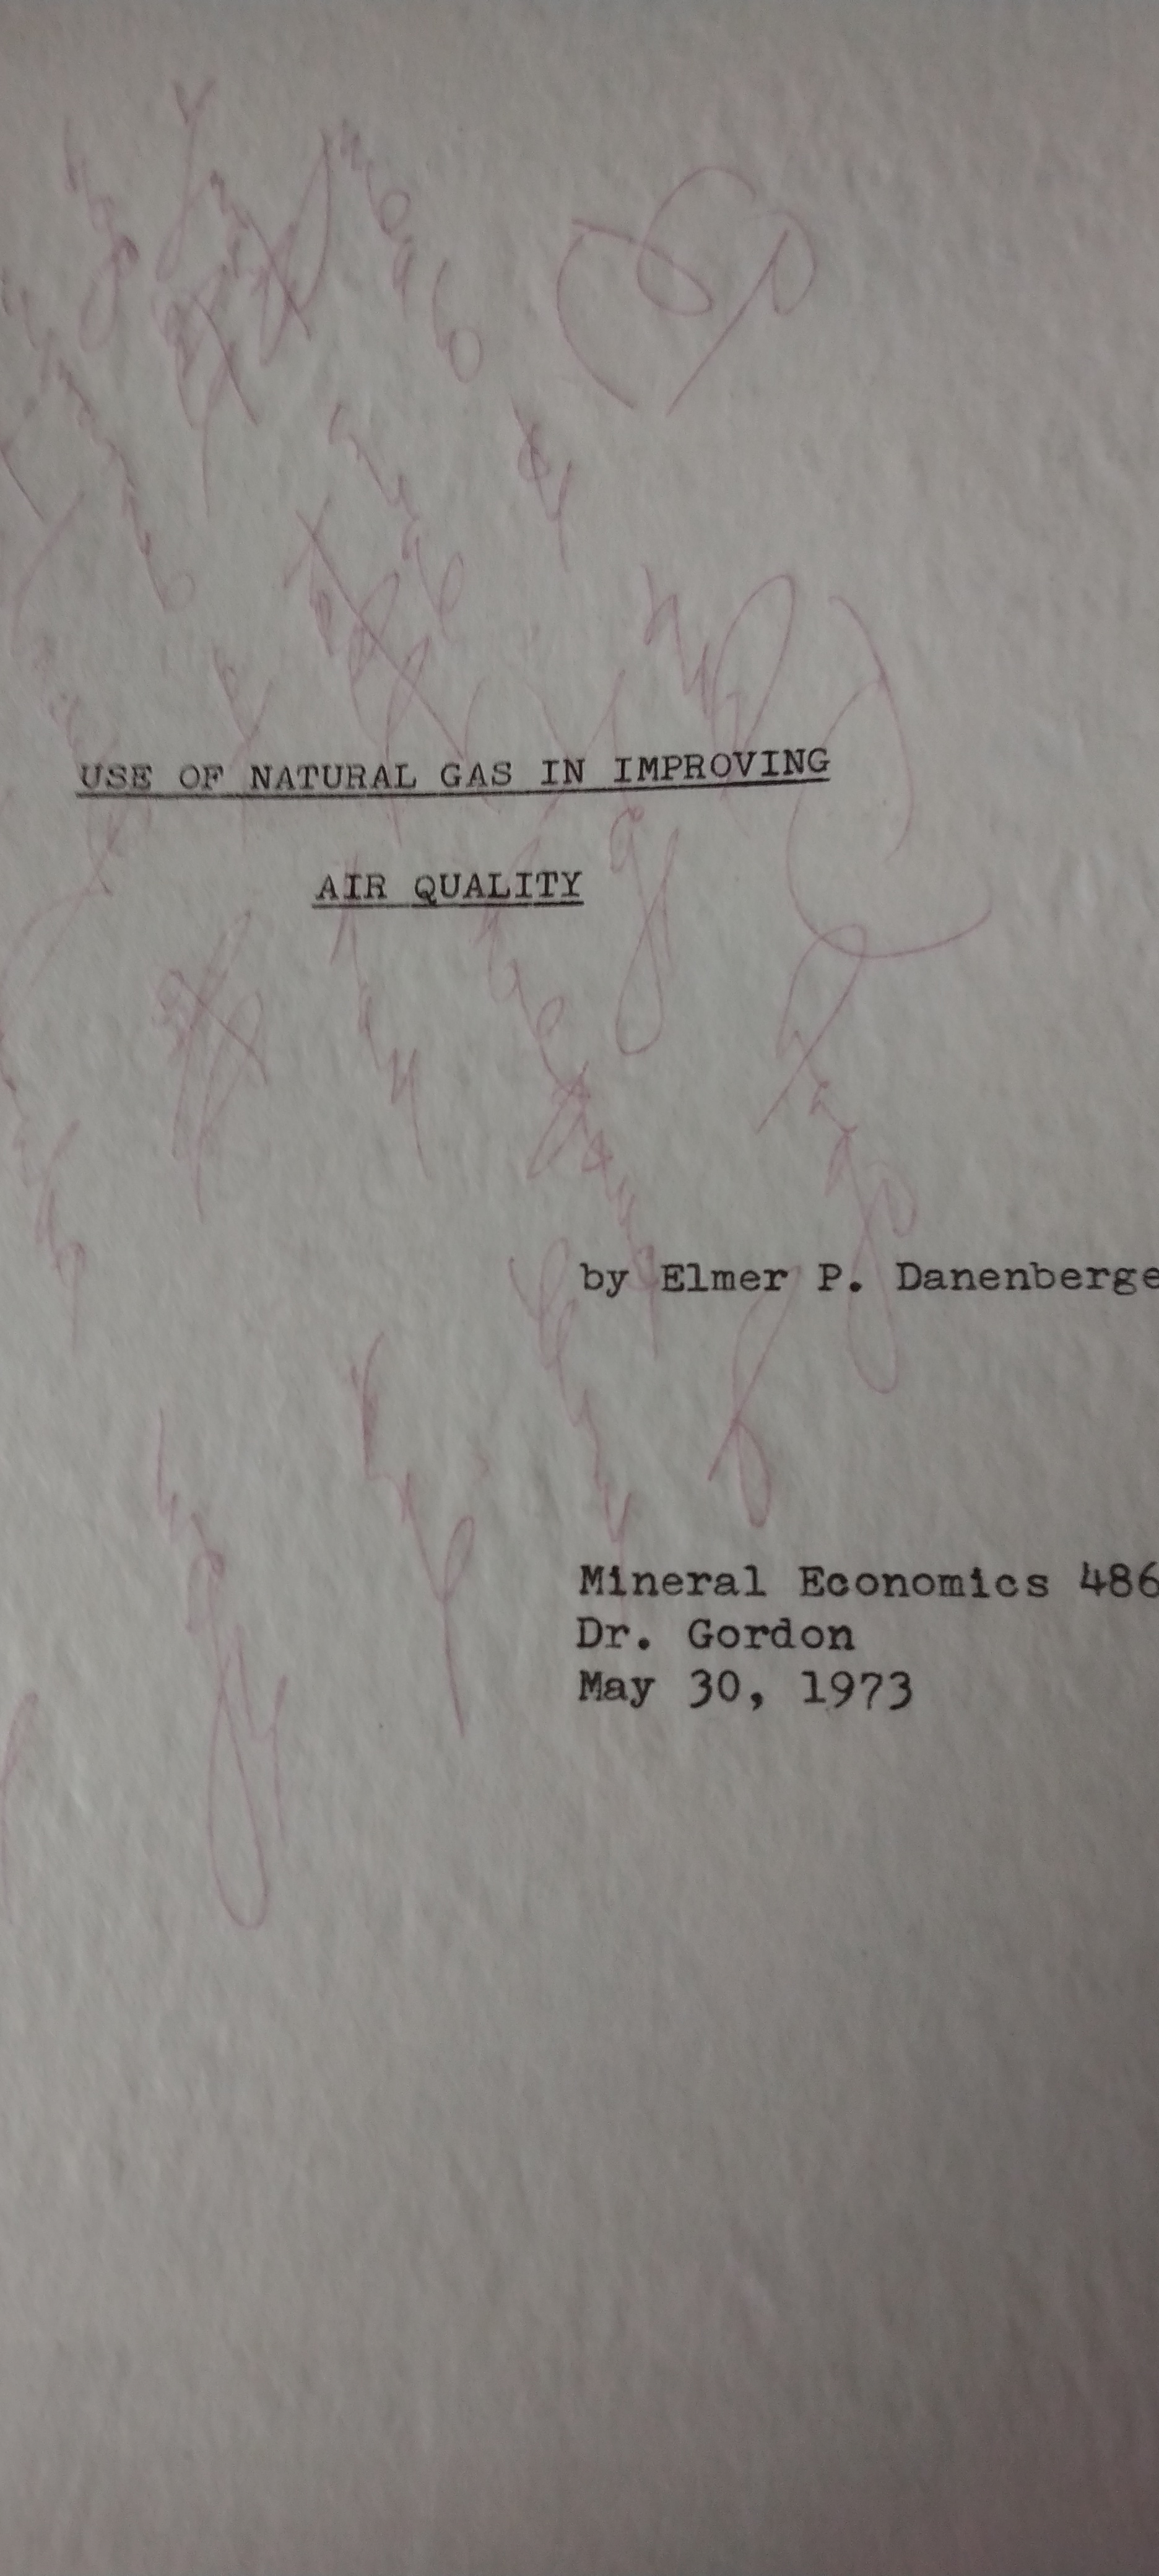
More than 50 years ago as a graduate student, I wrote a paper entitled “The Use of Natural Gas in Improving Air Quality.” My professor, Dr. Richard Gordon, a brilliant economist who greatly influenced my thinking about energy, liked the paper (grade of 93), but thought I was too optimistic about the availability of natural gas (the title page and his comment are captured below). The sense at the time was that natural gas was a premium energy source in short supply, but technical innovation unlocked massive shale gas resources and justified my optimism.
BOE has been celebrating the natural gas revolution since the blog began in 2010. Methane (CH4) is essentially a hydrogen transporter that emits far less CO2 than other fossil fuels when burned. Natural gas’s other important air quality advantages – low NOx, SO2, and particulate emissions – have far greater significance from a human health standpoint. (Many in the US and Canada learned a lot about particulates last weekend!)
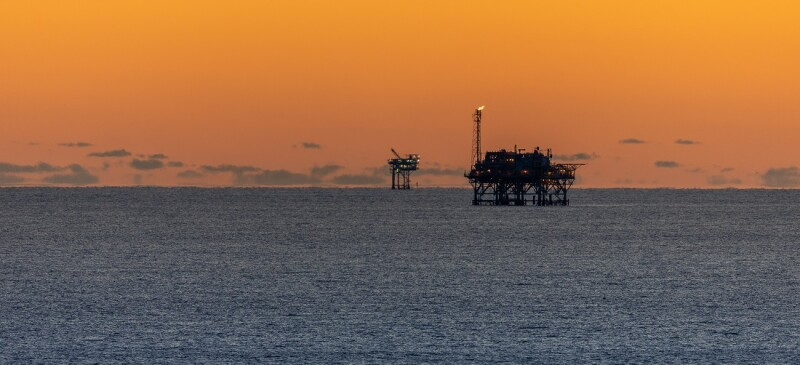
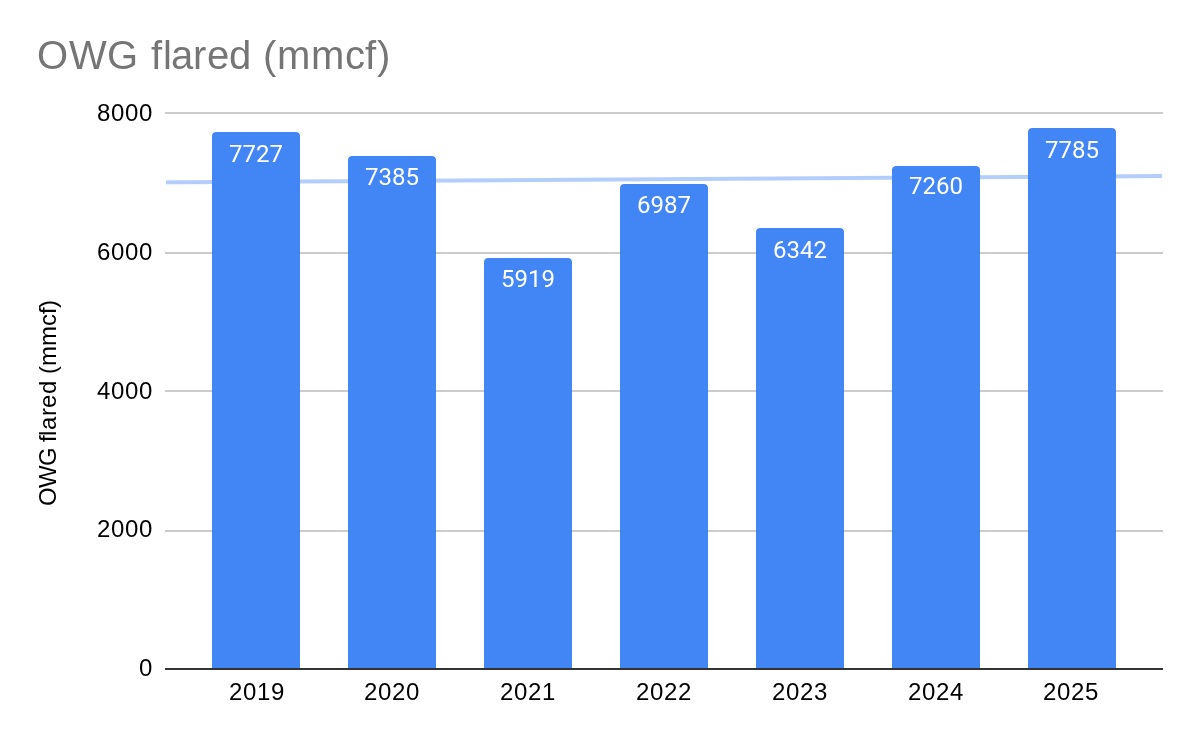
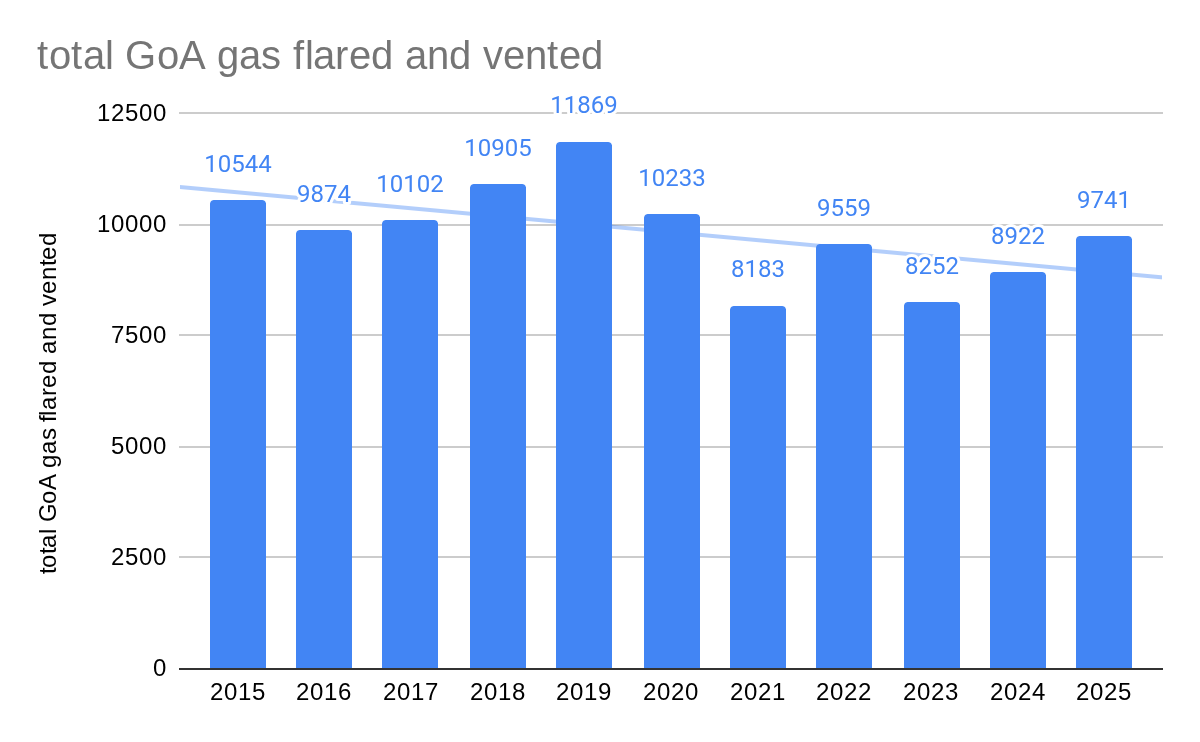
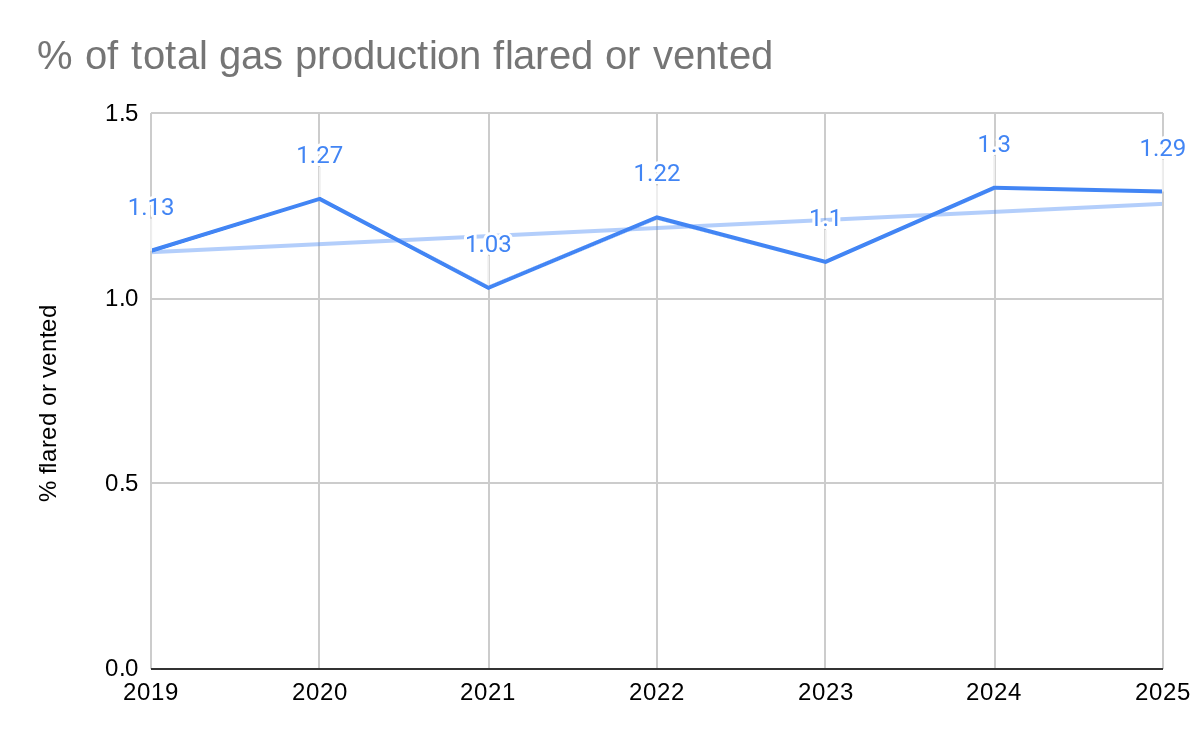
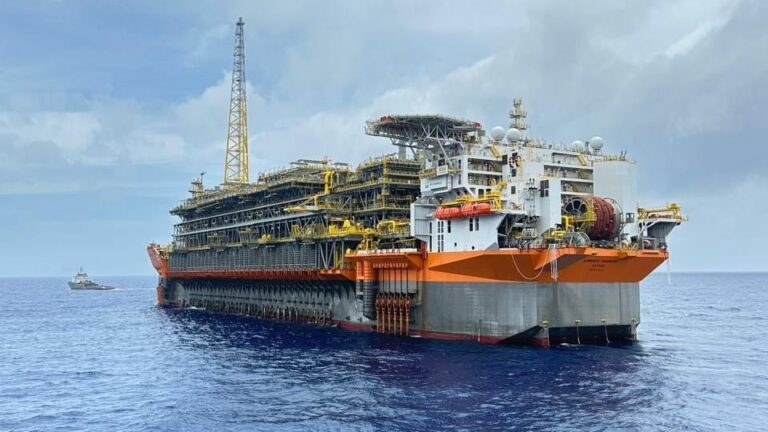
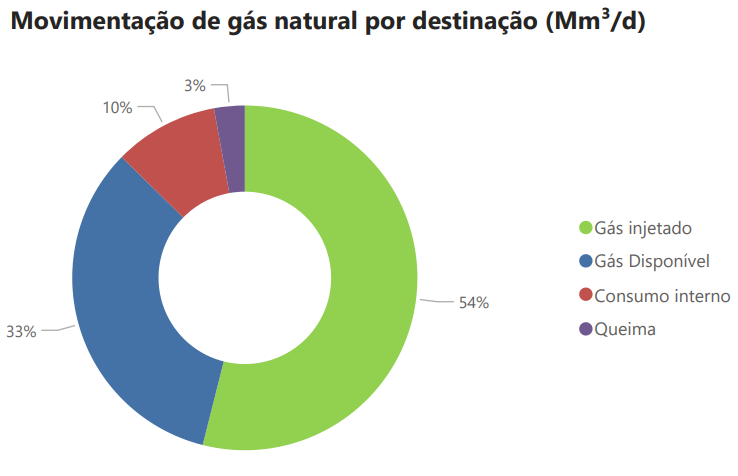
The environmental case for offshore natural gas is particularly strong. However, Gulf of America gas production has struggled to compete with the onshore shale sector. Total Gulf production fell to 757 bcf in 2025. 91% of that gas production was from oil wells, primarily high rate deepwater wells.
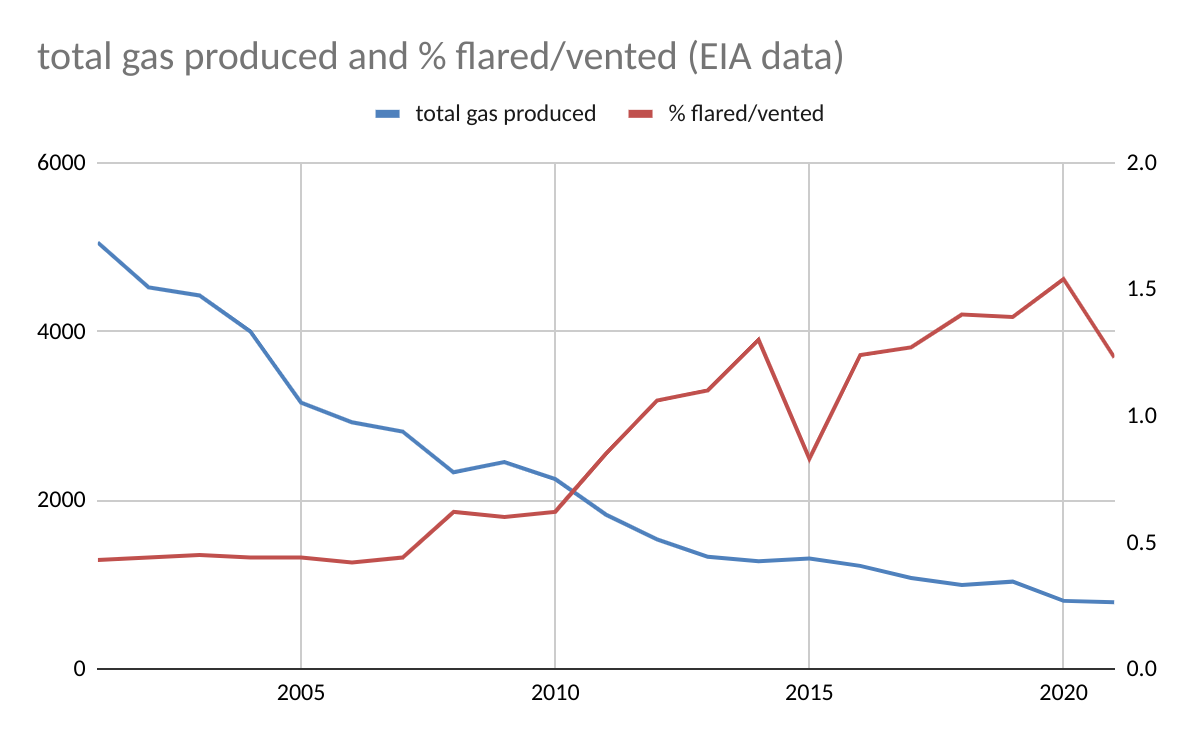
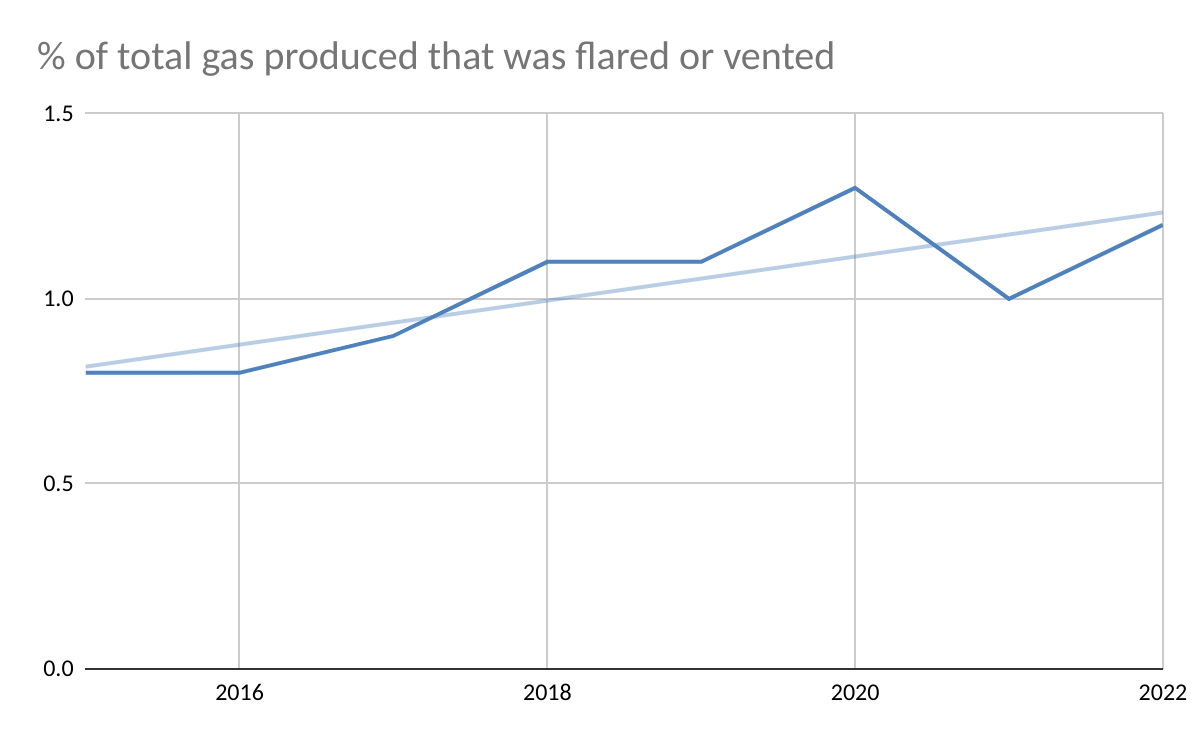
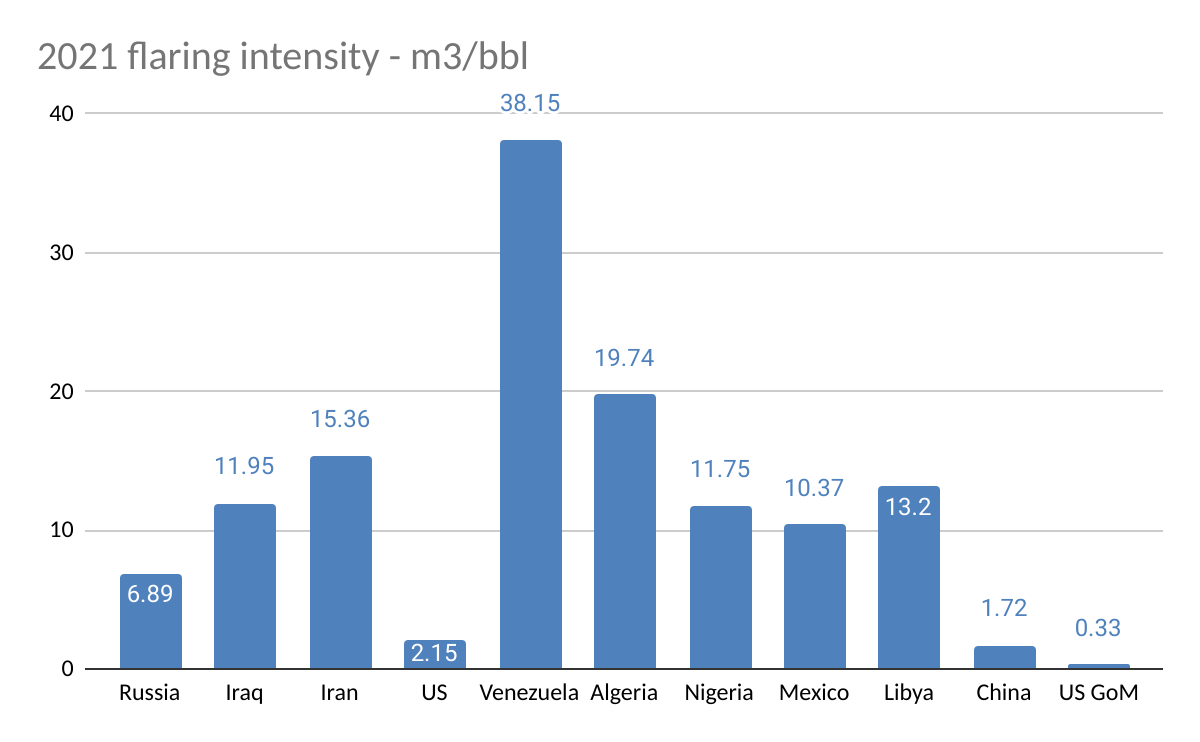
Sobering resource conservation and emissions fact: The top two 2025 flarers, Russia and Iran, each flared 300 bcf more than the entire 2025 gas production in the Gulf of America. On top of that, keep in mind that the World Bank flaring estimates are probably low.