Thirty years ago, when industry majors shied away from exploration offshore Israel, Noble Energy (then Samedan) boldly stepped forward and partnered with the Delek Group to explore the Eastern Mediterranean.
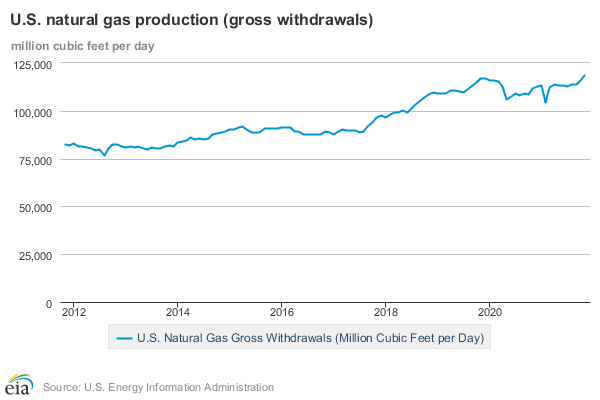
Exploration success was accompanied by national security, legal, and regulatory challenges. Nonetheless, Israel’s gas production has grown rapidly and is expected to exceed 3 bcf/day in 2026, which is > current gas production in the Gulf of America.
Chevron is now the main operator in Israel, having purchased Noble’s assets in 2020. The company has taken another major step by signing an MOU with Syrian Petroleum Co. and Qatar-based Power International Holding. The document is not currently accessible online, but appears to be substantive based on press reports.
The agreement focuses on preliminary cooperation for exploring and developing offshore oil and gas resources offshore Syria. It’s noteworthy that the MOU will only remain in effect for two months, after which “formal contracts and operational work are expected to follow.”
Having done some work for Noble Energy in the 2010s, I’m very impressed by the progress that has been made given the geopolitical challenges.
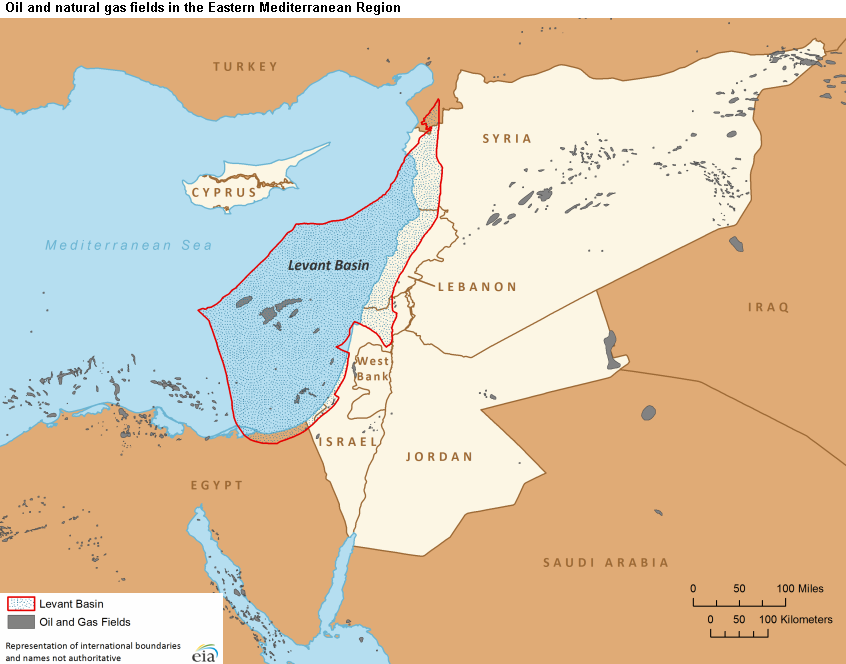
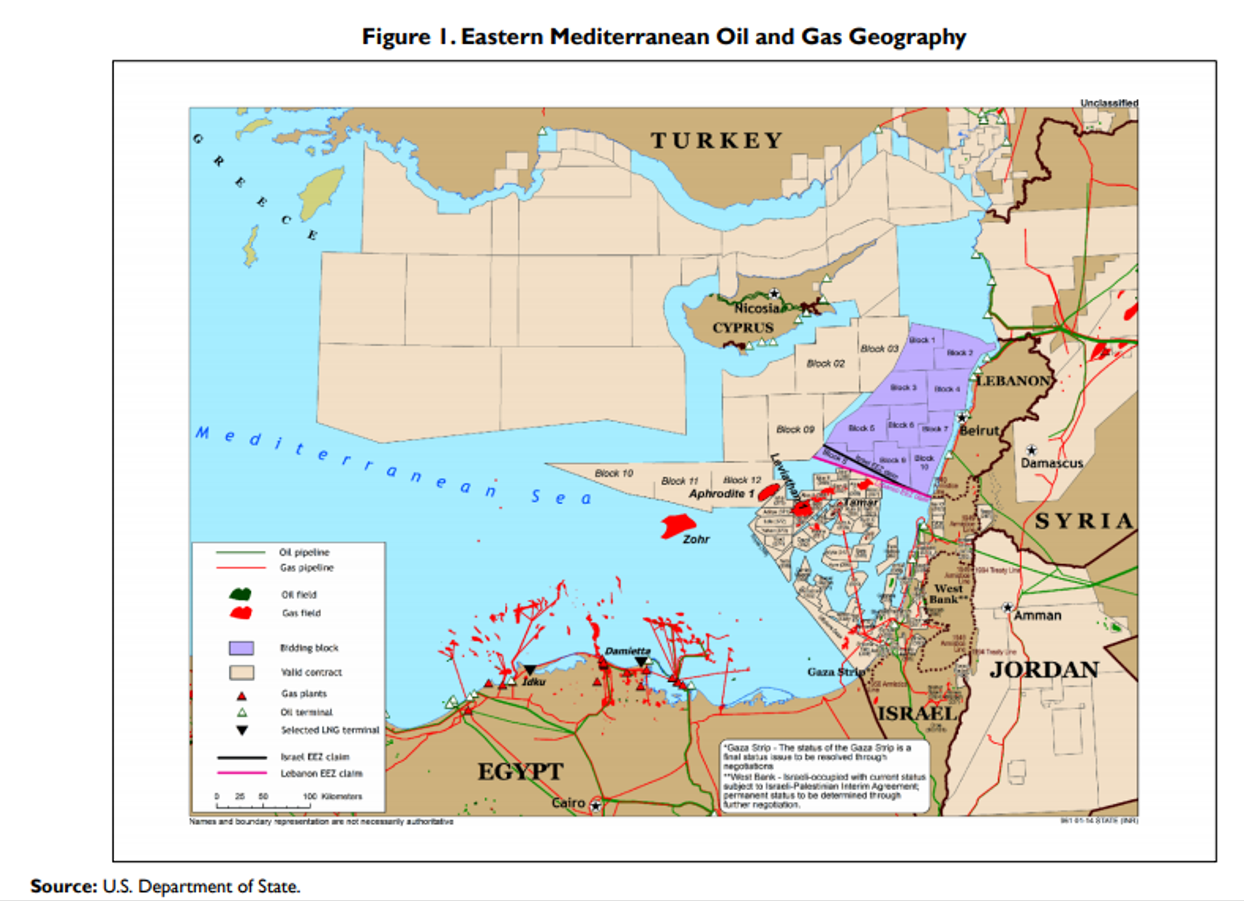
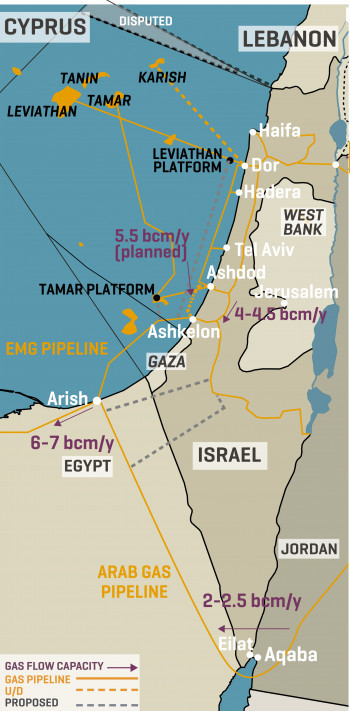
The EIA’s Eastern Mediterranean overview is attached.