See attached. This is a well written directive. Kudos to the authors.
Retaining the revenue management functions in ONRR is prudent.
There has been no specific announcement regarding the MMA Director, but a quote in the American Samoa lease sale announcement cites Matt Giacona, Acting MMA Director. Congrats to him.
Six months after the year ended, the Office of Natural Resources Revenue (ONRR) has completed their precise, to the barrel, production accounting. BOEM was correct – 2025 was a record OCS oil production year by a considerable amount. Total OCS production, nearly 714 million bbls, exceeded the 2019 record by 14 million bbls. EIA data still favor 2019 by a slight margin.
The 16+ million barrel difference between the 2025 ONRR and EIA OCS production totals is much larger than any such differential in recent years and warrants an explanation. Below are the 2025 OCS totals (first table) and the 2019 to 2025 Gulf totals (2nd table). As indicated in the second table, all other differentials between ONRR and EIA were <2 million bbls, and only the 2024 differential was >1 million bbls.
BOEM Press Release: “The Bureau of Ocean Energy Management announced today the critical role of offshore leasing, resource assessment and long-term planning in supporting record oil production on the U.S. Outer Continental Shelf, which reached more than 714 million barrels in 2025.”
Was 2025 a record OCS oil production year?No, 2025 came very close, but barring belated revisions, 2019 retains the record.
Did 2025 oil production exceed 714 million barrels? Not even close according to the US Energy Information Administration (EIA), which reported a final OCS production total of 692.6 million barrels for 2025. The Office of Natural Resources Revenue (ONRR), to whom all production data must be reported, has yet to post their final 2025 numbers, but they are normally very close to the EIA totals. Also, ONRR’s fiscal year totals do not suggest calendar year production in excess of 700 million barrels. BOEM’s announced 714 million barrel CY 2025 total is more than 60,000 bopd higher than the actual EIA CY or ONRR FY daily averages, and even exceeds the total posted in BOEM’s data center.
See the 2019 and 2025 oil production totals in the table below. The BOEM 2025 numbers appear to be erroneous.
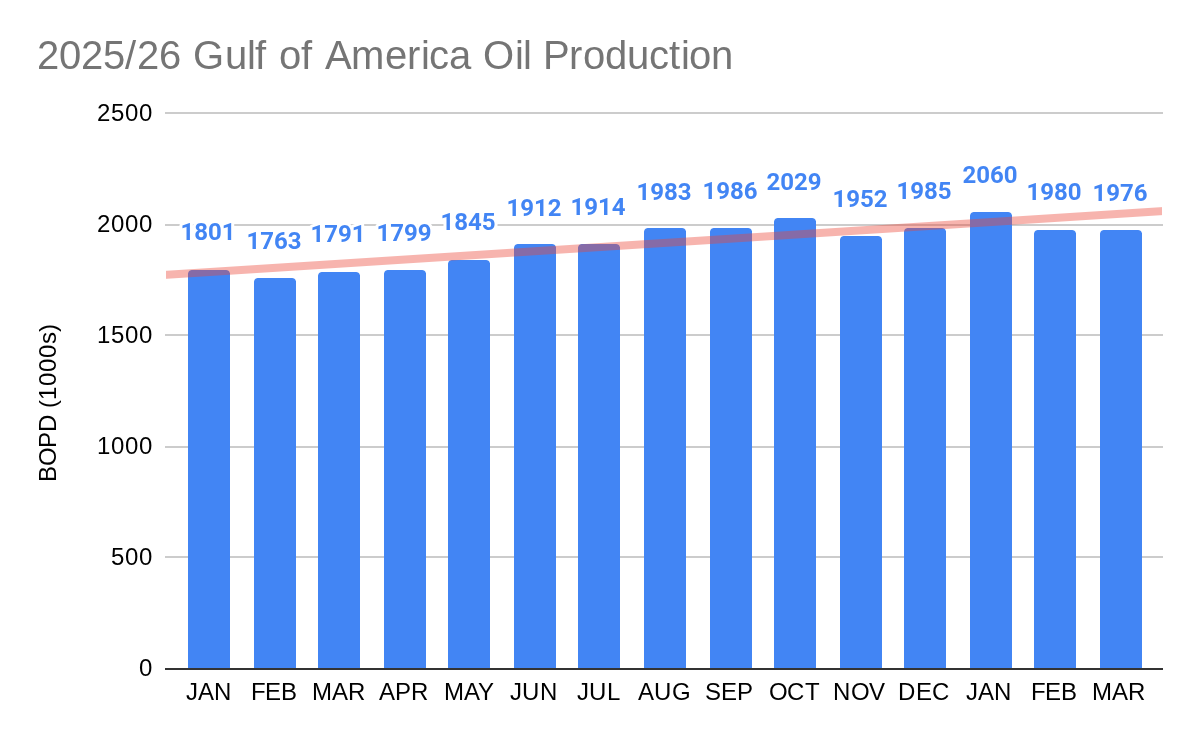
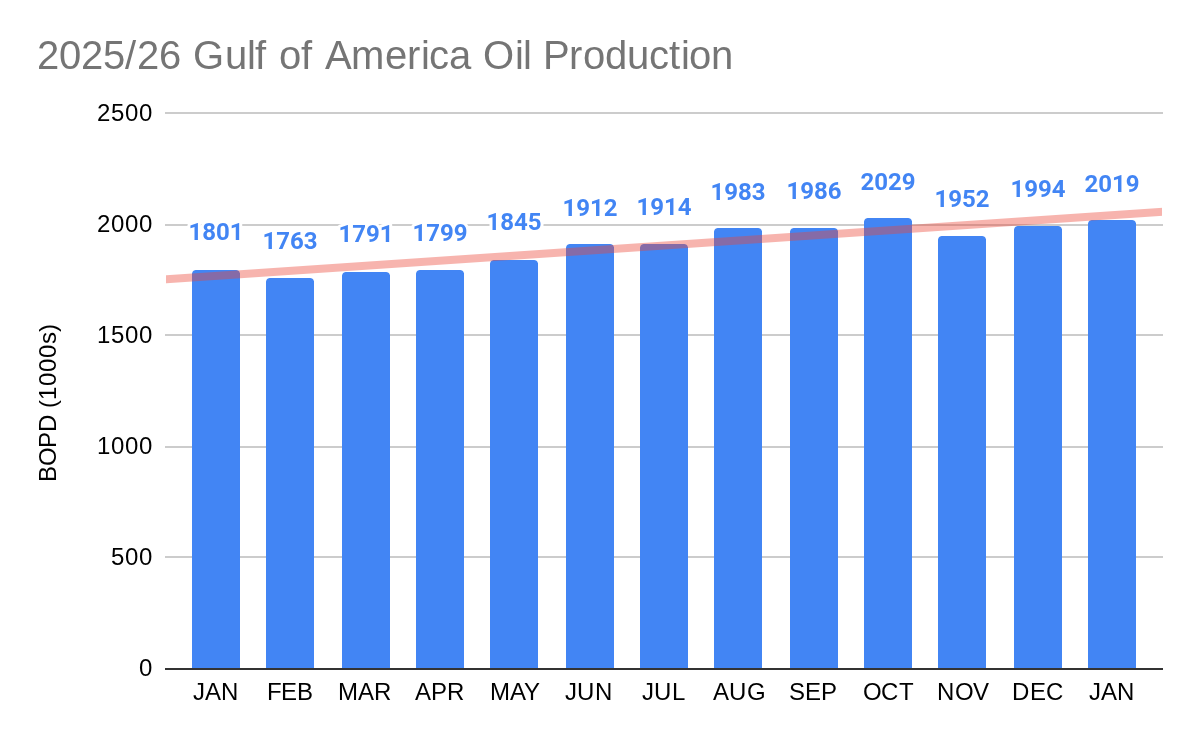
On the plus side, per EIA’s latest update, Jan. 2026 was a record production month for the Gulf. January’s ave. production of 2.060 million bopd surpassed the Aug. 2019 ave. of 2.044 million bopd.
Barring significant tropical storm shut-ins over the next 6 months (hurricane season starts today!), a production record in 2026 seems like a good possibility.
The EIA has revised Gulf of America oil production slightly downward for Nov. and Dec. such that we now have an absolute dead heat between 2025 and 2019. Production for both years averaged exactly 1.898 million bbls/day.
Because of the ~6 month lag in obtaining verified OCS production data from the Office of Natural Resources Revenue (ONRR), the monthly EIA reports are based on ONRR’s more timely sales of production data. The final sales and production numbers are typically very close. For the 2019 record OCS production year, both the EIA and ONRR report identical Gulf production of 1.898 million bopd.
Meanwhile, 2026 Gulf production (chart below) is off to a strong start – 2.019 million bopd in January. This is the third highest monthly oil production in the history of Gulf operations.
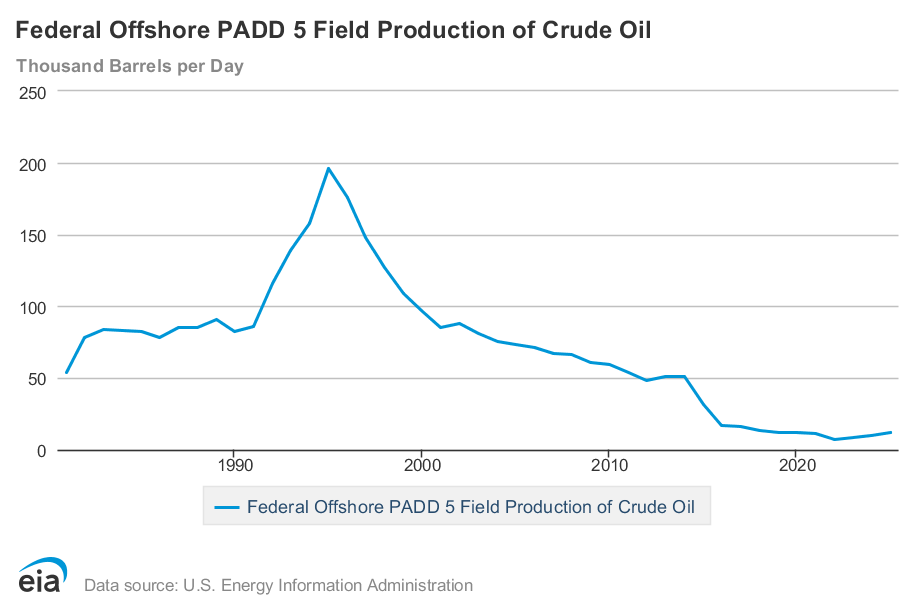
Finally, California OCS oil production, which has been hobbling along at ~10,000 bopd (2nd chart) will see a massive increase of up to 500% should Santa Ynez Unit production continue.
Minimizing flaring and venting is important from both environmental and resource conservation standpoints.Flaring and venting volumes are also good indicators of how well production systems are designed, managed, and maintained.
The best performance indicators are the percentages of produced gas that are flared and vented both for oil-well gas (OWG, also known as associated or casinghead gas) and gas-well gas (GWG or non-associated gas).
Updated flaring and venting volumes for the Gulf of America have been compiled using monthly data submitted to the Office of Natural Resources Revenue (ONRR). This is the best data source because reporting is mandatory and strictly enforced, and flaring and venting are accounted for separately.
In assessing performance trends, it’s important to segment venting and flaring volumes for both OWG and GWG production. Venting produced gas (mostly methane) is a more significant environmental concern from both air quality and greenhouse gas (GHG) perspectives.
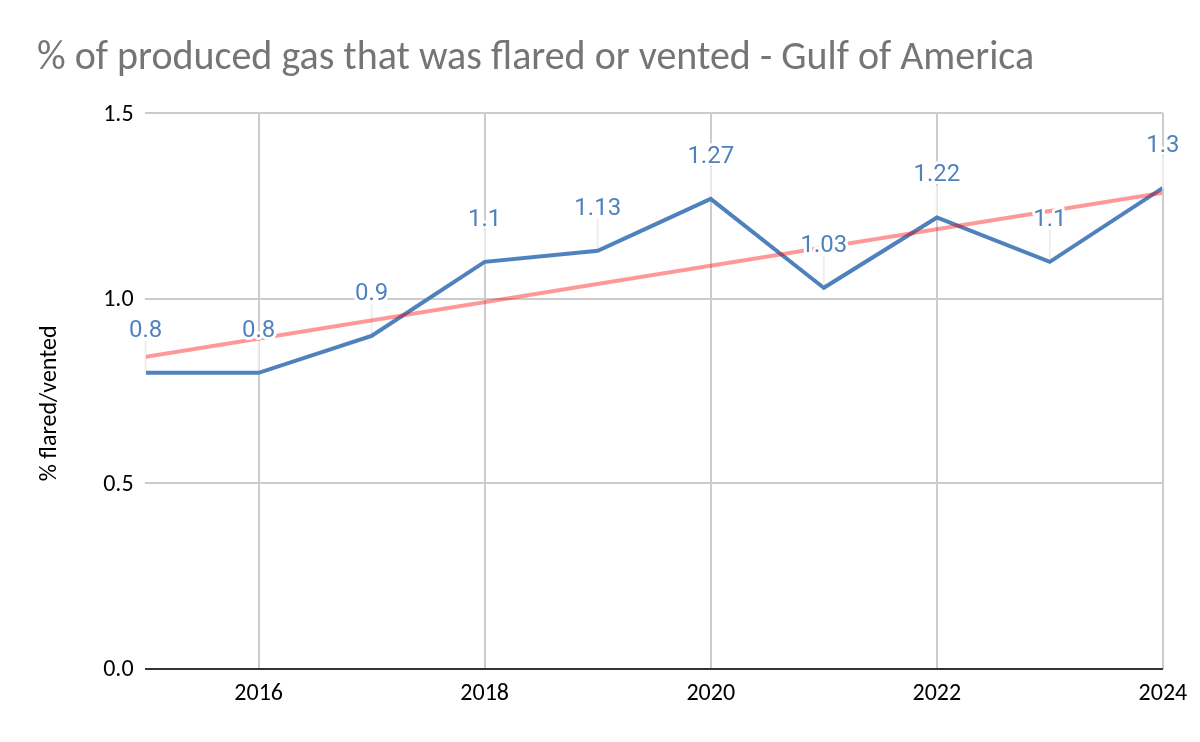
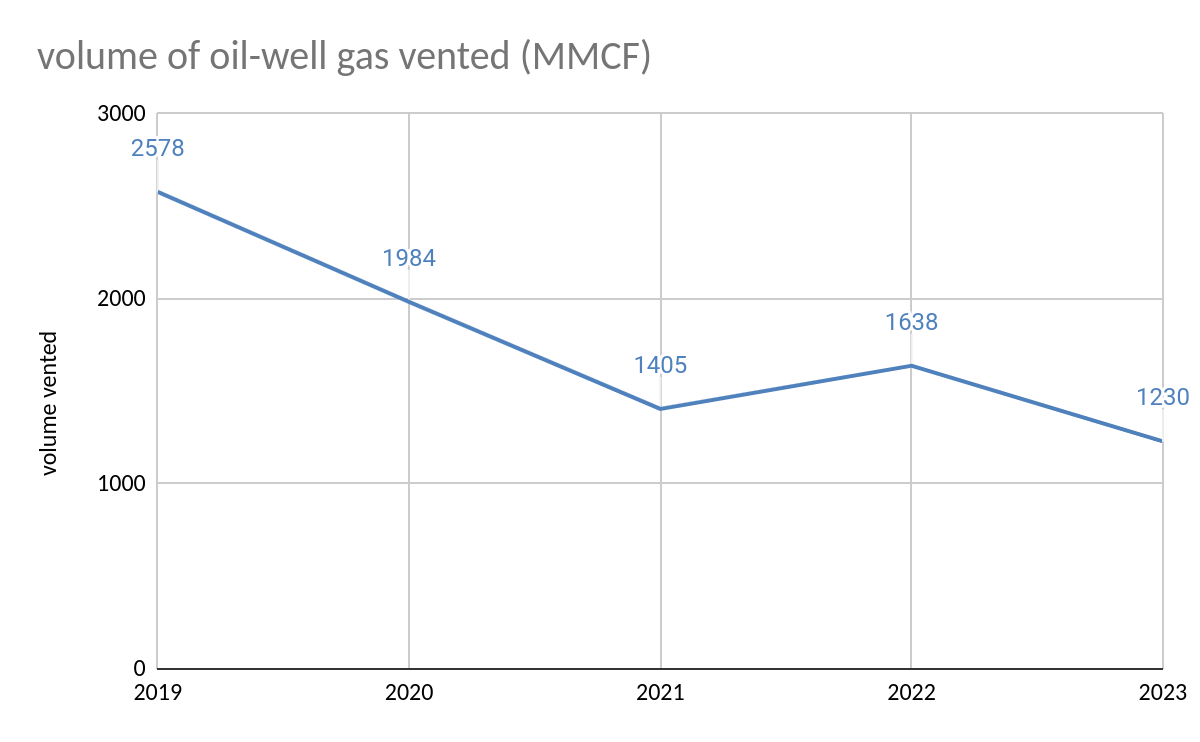
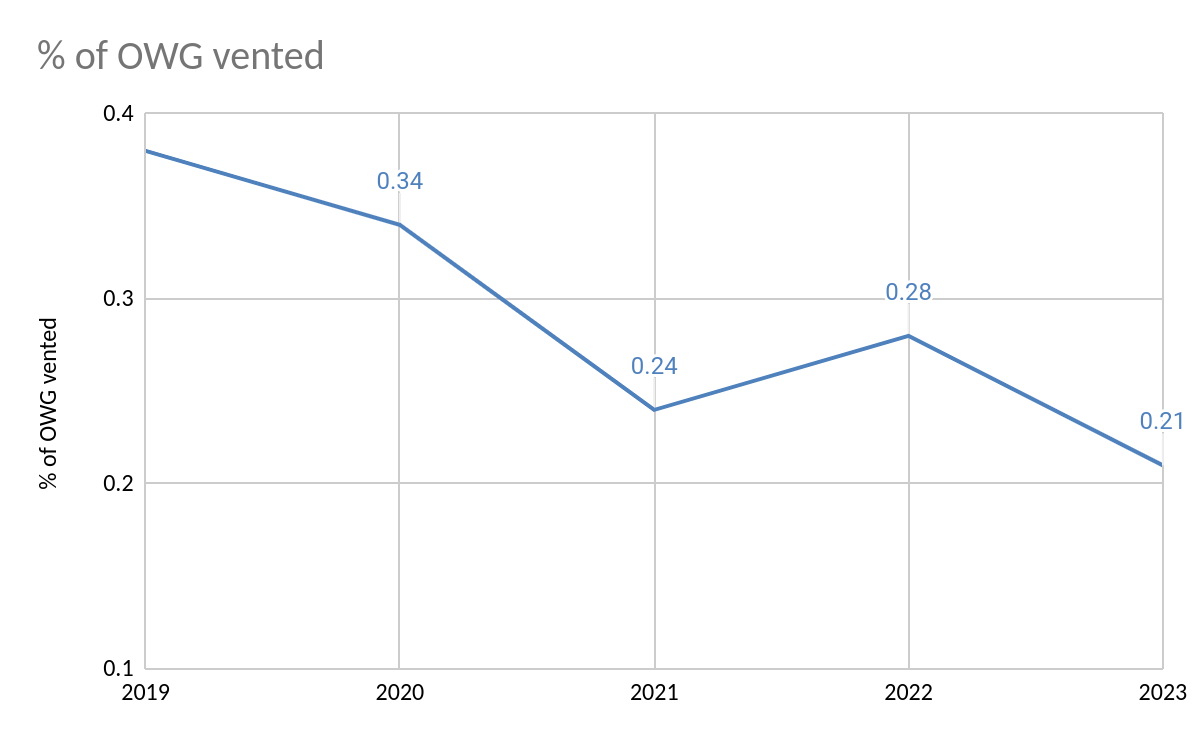
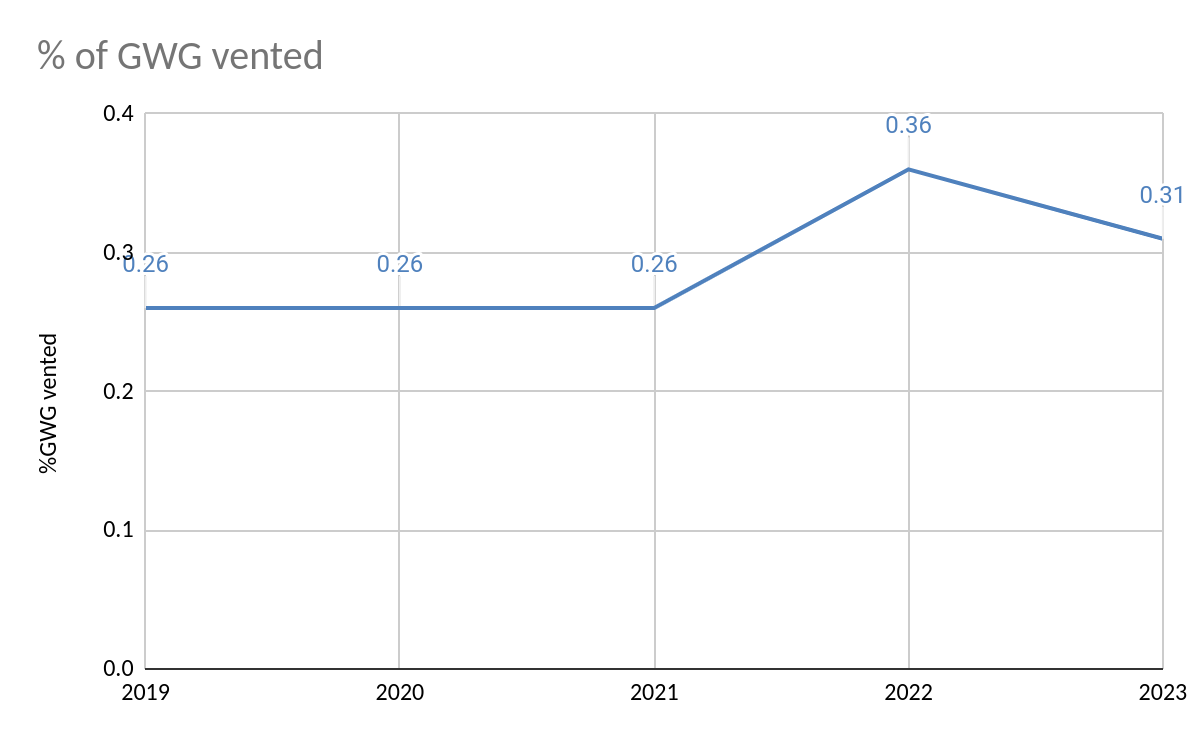
Flaring and venting data for 2019-2024 are summarized in the table below. All volumes are in millions of cubic feet (MMCF).
Notes and comments:
The more disappointing 2024 numbers are entered in red. The blue numbers, all related to OWG venting, are encouraging.
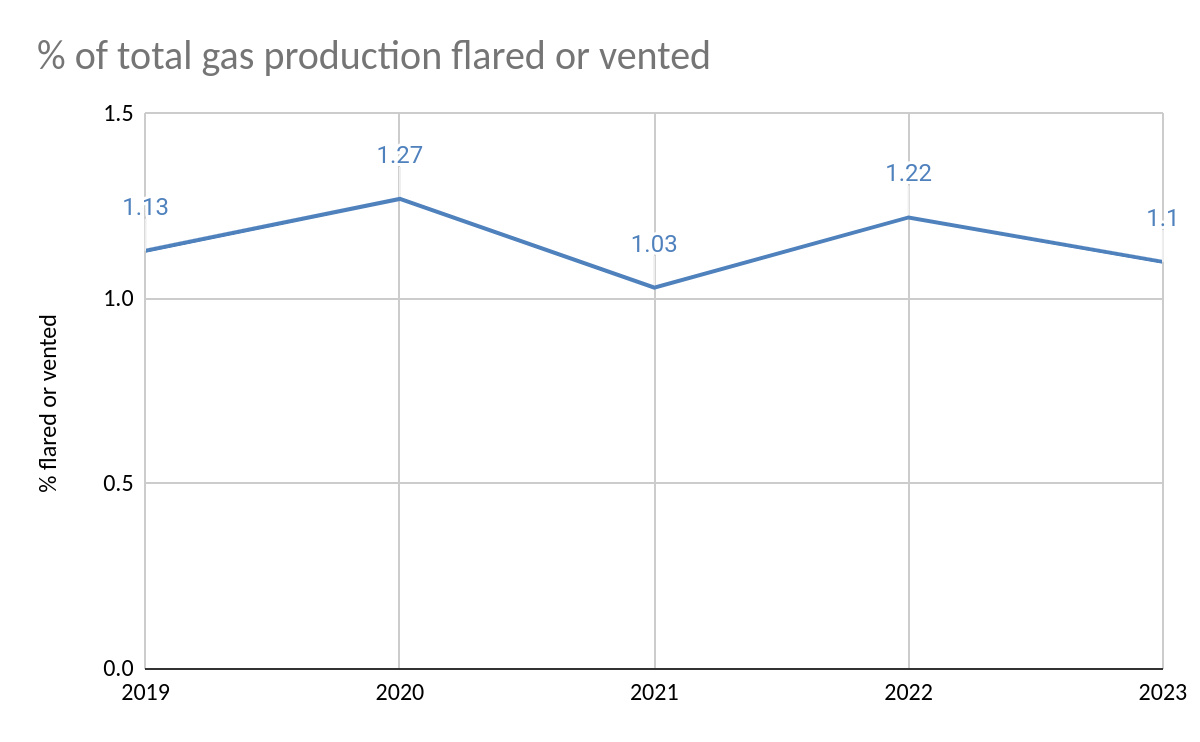
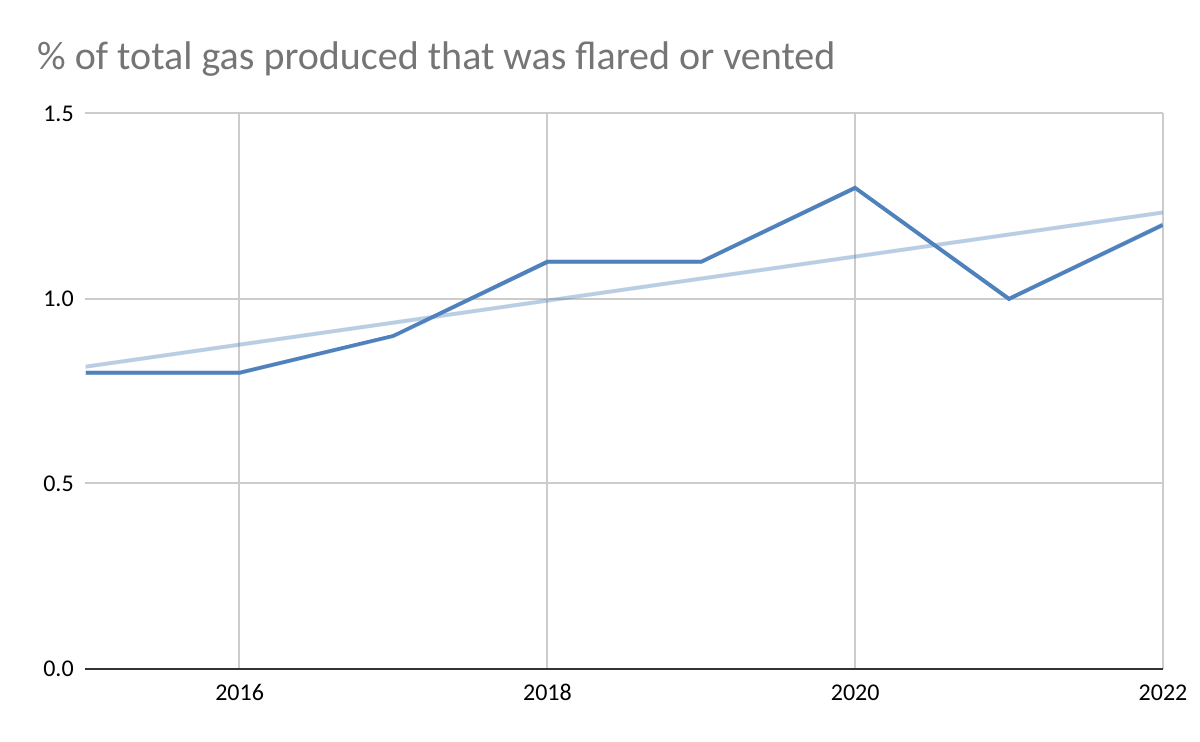
The % of all produced gas that was flared or vented in 2024 (1.3%) was the highest in the past 10 years (see the chart below the table). Until 2018, annual flaring/venting rates of <1% of production were commonly achieved. This should be the target going forward.
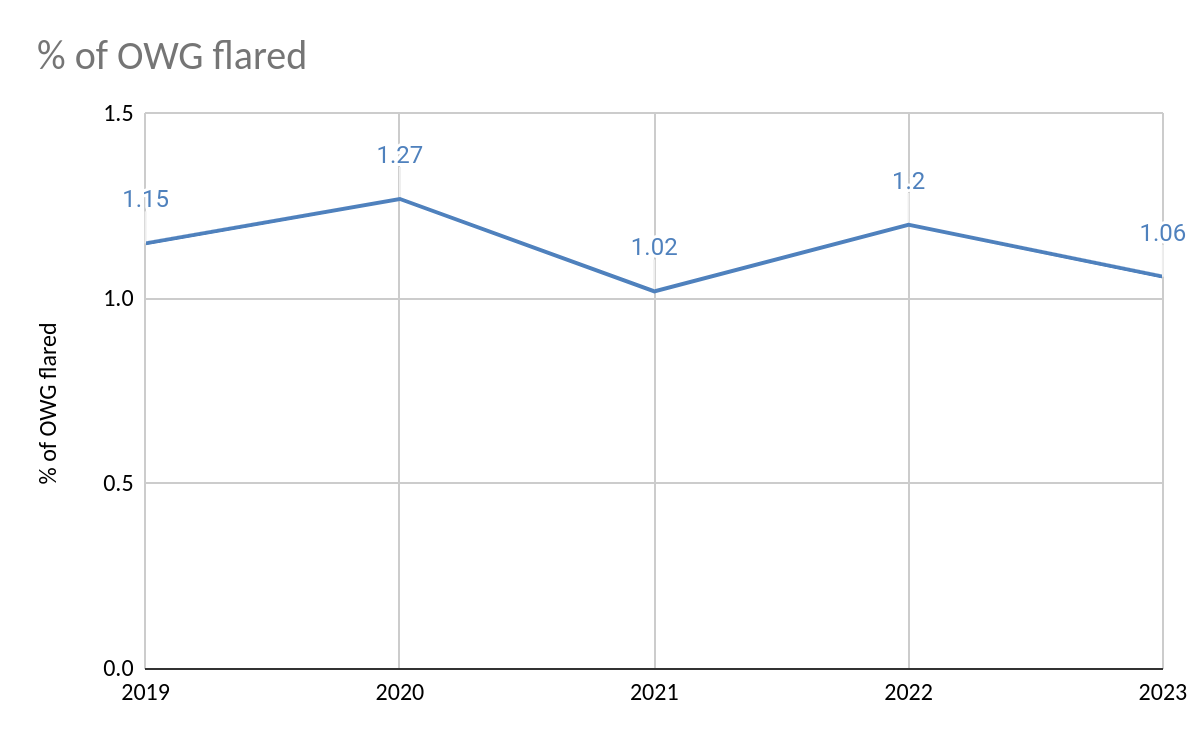
OWG flared increased significantly from 2023 levels, both in terms of the volume (7.26 billion cu ft) and the % of OWG produced (1.22%).
Production curtailments and restarts related to Tropical Storms Francine and Helene may have contributed significantly to the 2024 flaring increase. ONRR’s monthly reports show a near doubling of the average monthly flaring volume in Sept., when Francine and Helene shut-in 42% and 29% of oil production respectively. However, even if the Sept. flaring surge is normalized to the monthly average for the other 11 months, the total 2024 flaring still exceeds the 2023 volume by 361 MMCF.
The % of GWG vented in 2024 was the highest in the 6 year period and double the 2019, 2020, 2021 rates. Inefficiencies associated with the dramatic decline in GWG production, down 41.5% from 2023, may be a contributing factor.
The continued decline in OWG venting to only 0.16% in 2024 is encouraging. The decline should be sustainable given that most OWG is now produced at modern deepwater platforms equipped with efficient flare stacks.
Given the significance of these data, from safety, conservation, and environmental perspectives, a more comprehensive analysis by the offshore industry and regulators should be a priority.
Note: I have attached a PDF for those who want to download the charts and table.I have also added a “flaring and venting” category for easy access to these posts.
Minimizing flaring and venting is important from both environmental and resource conservation standpoints.Flaring and venting volumes are also good indicators of how well production systems are designed, managed, and maintained.
The best performance indicators are the percentages of produced gas that are flared and vented both for oil-well gas (OWG, also known as associated gas or casinghead gas) and gas-well gas (GWG or non-associated gas).
I compile monthly flaring and venting volumes for the Gulf of Mexico using data submitted to the Office of Natural Resources Revenue (ONRR). Reporting these data is mandatory and strictly enforced. Violators are subject to civil and criminal penalties.
In assessing performance trends, it’s important to segment venting and flaring volumes for both OWG and GWG production. Venting produced gas (mostly methane) is a more significant environmental concern from both air quality and greenhouse gas (GHG) perspectives. Reductions in methane emissions are a priority for regulators and leading operators.
Flaring and venting data for 2019-2023 are summarized in the charts and table below. All volumes are in millions of cubic feet (MMCF). For the last chart (% of total gas production vented), I added ONRR data for 2015-2018 to provide a longer term perspective on overall venting performance.
Observations:
OWG venting has declined significantly both in terms of the total volume and % flared. Most OWG is now produced at modern deepwater platforms equipped with efficient flare stacks. Venting from these facilities is minimal. A performance target of <0.2% for OWG venting should therefore be achievable.
GWG venting volumes have declined sharply. However, given the parallel decline in GWG production, the % of GWG vented has actually increased. Most gas wells are on older shelf platforms where flare booms cannot be safely and economically added. Nonetheless, it’s disappointing that the % of GWG vented increased to > 0.3% in both 2022 and 2023.
OWG flaring has remained relatively constant both in terms of the volume and % flared. Given that most OWG is produced at deepwater facilities, reduction of the flaring % to <1.0 should be achievable.
The % of the total gas flared or vented has remained relatively constant at >1.0%. Again, a target of <1.0% should be achievable.
In the table, the figures in blue are particularly encouraging and the figures in red are the most disappointing.
Overall, the numbers are good, but continuous improvement should be the objective. Reductions in GWG venting and OWG flaring should be prioritized.
As previously discussed, flaring/venting performance could be better assessed if information on large flaring/venting episodes was made publicly available. Explanations are needed for spikes in monthly ONRR flaring/venting volumes. Are these spikes associated with production startups, tropical storm restarts, major compressor issues, administrative/accounting corrections, or something else?
2019
2020
2021
2022
2023
OWG flared
7727
7385
5919
6987
6342
OWG vented
2578
1984
1405
1638
1230
OWG produced
670,699
582,254
582,824
581,235
598,005
% OWG flared
1.15
1.27
1.02
1.20
1.06
% OWG vented
0.38
0.34
0.24
0.28
0.21
GWG flared
405
432
311
213
212
GWG vented
958
578
548
722
468
GWG produced
364,082
224,808
209,558
203,342
152,400
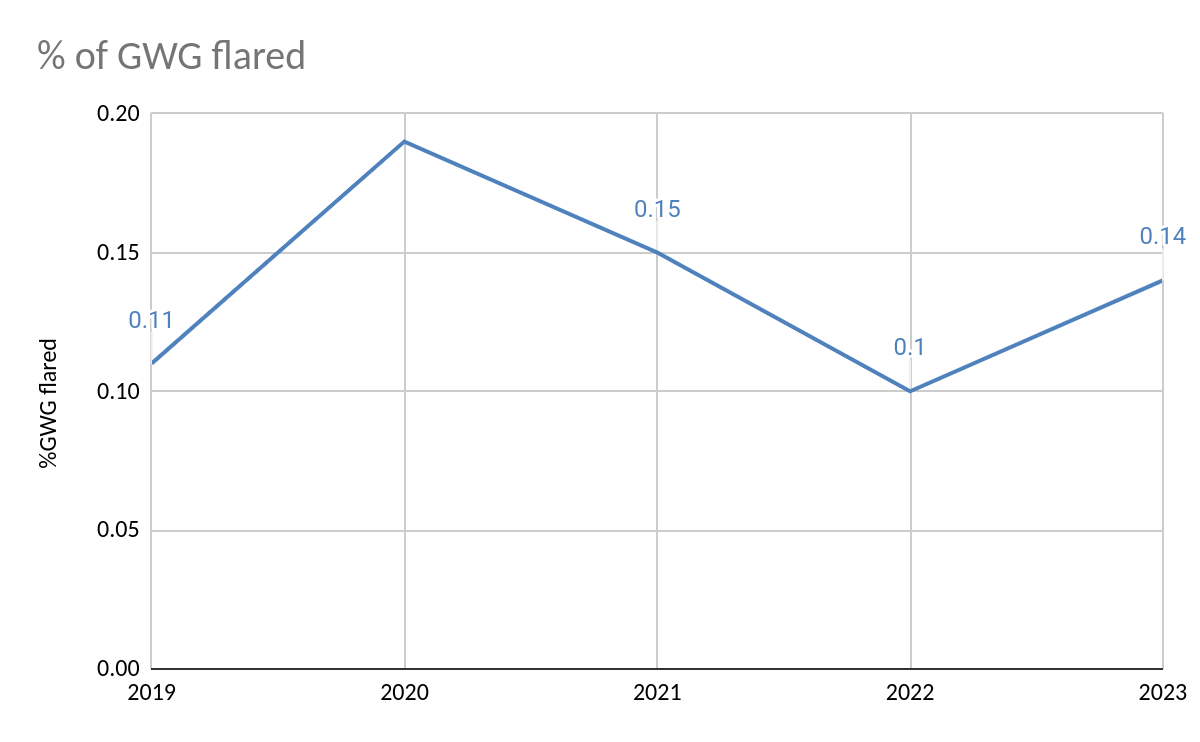
%GWG flared
0.11
0.19
0.15
0.10
0.14
%GWG vented
0.26
0.26
0.26
0.36
0.31
total flared and vented
11668
10233
8183
9559
8252
total gas production
1,034,782
807,062
792,382
784,577
750,405
% flared or vented
1.13
1.27
1.03
1.22
1.10
total vented
3536
2416
1953
2360
1698
% vented
0.34
0.30
0.25
0.30
0.22
total flared
8132
7817
6230
7200
6554
% flared
0.79
0.97
0.79
0.92
0.87
OWG=oil well gas; GWG=gas well gas; all volumes are in MMCF
Regardless of one’s opinion about the causes of climate change, minimizing methane emissions makes good safety, conservation, and environmental sense. The emerging international consensus on methane emission reductions thus merits broad industry and governmental support.
Because of the resource conservation mandate in the OCS Lands Act, minimizing the waste of natural gas has been a point of emphasis in the US offshore program for 50+ years. If you couldn’t utilize or market the natural gas, your project wouldn’t be approved. This requirement delayed the entry of some floating production systems into the Gulf of Mexico, but the pipeline network ultimately expanded to support deepwater development with floating units. Those associated with the offshore program are rightfully proud of their success in prohibiting the waste of gas and minimizing flaring and venting.
Despite the historical commitment to restricting flaring and venting, the data suggest that further improvement may be needed. The concerns listed below are based on the compilation and review of flaring and venting data that operators are required to report to ONRR.
The % of US OCS gas produced that is flared or vented is trending upward (first chart below).
Both the gas flaring and venting volumes were higher in 2022 (vs. 2021) despite lower gas production.
More regulator/industry transparency on flaring episodes is needed, particularly in light of the PNAS paper and the June 2022 Inspector General Report.
In particular, there should be a process for explaining large spikes in monthly flaring and venting volumes. Were these spikes associated with production startups, major compressor issues, administrative corrections, or other factors?
Venting, which is a more significant environmental concern than flaring, increased by 407 million cu ft (21%) in 2023 vs. 2022. Although the overall venting trend is still favorable (second chart), the 2022 jump should be explained.
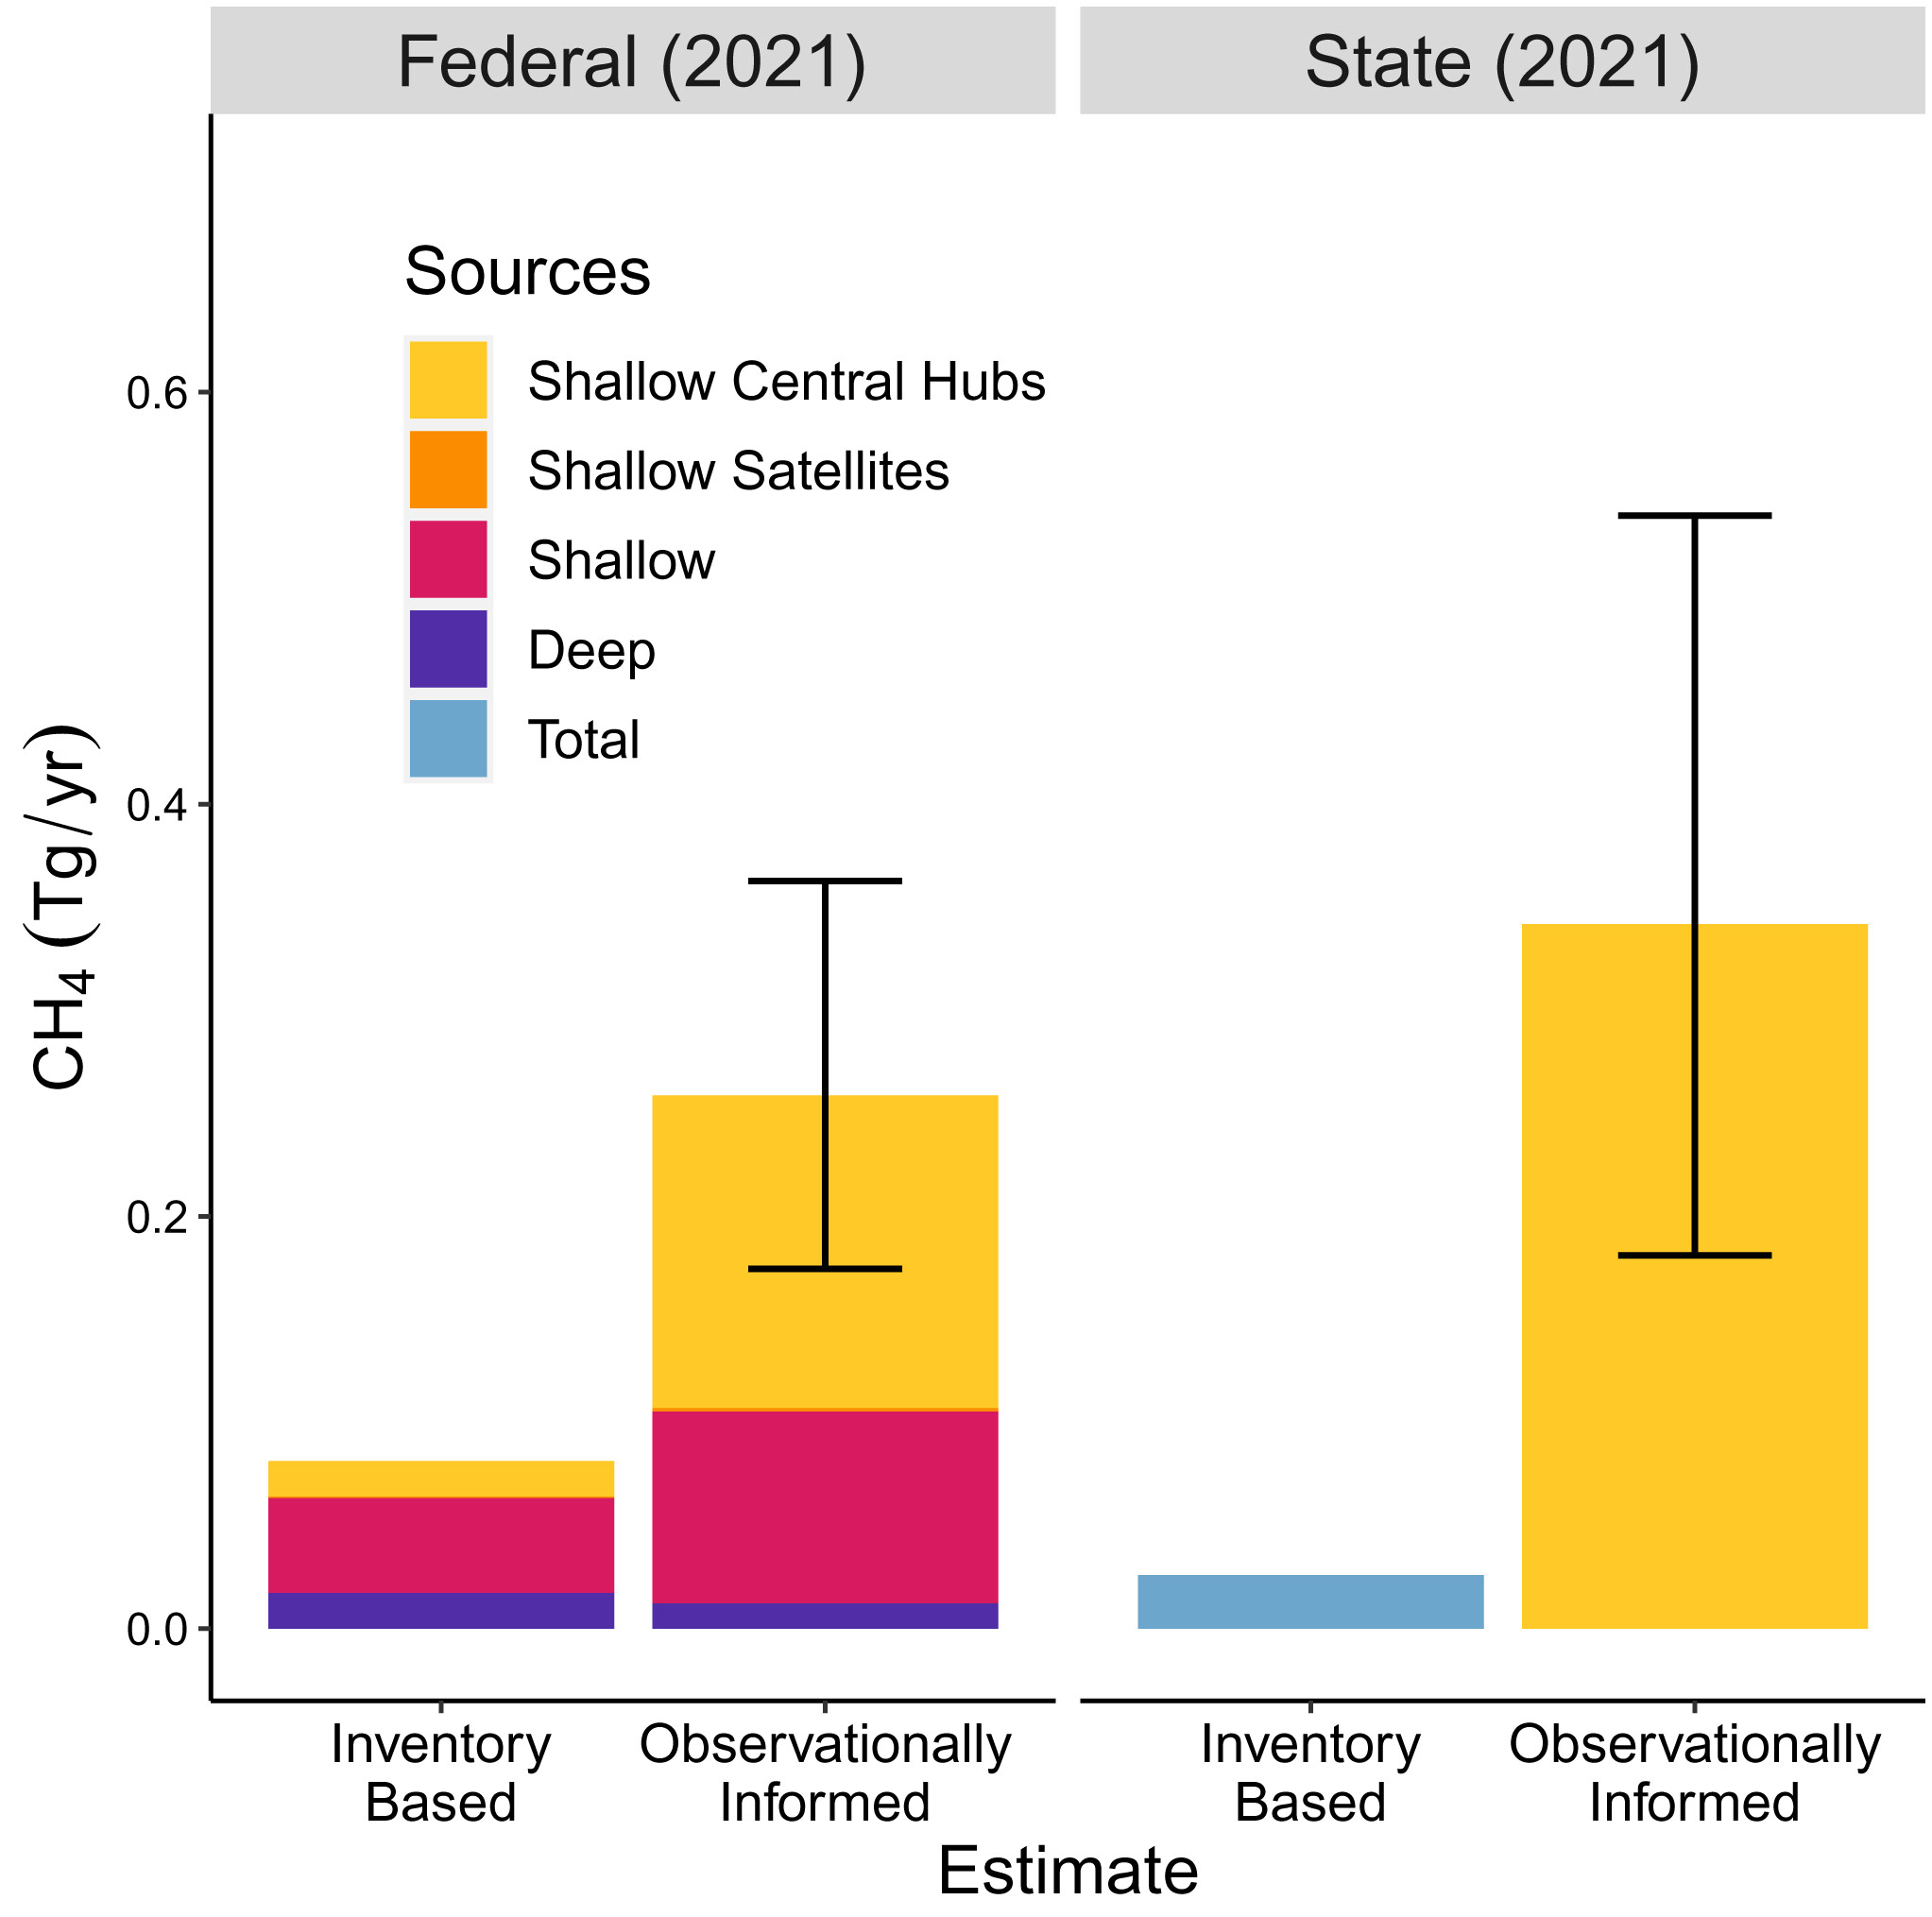
As summarized in the third chart below, deepwater facility methane emissions are consistent with the reported inventories, but shelf emissions in State and Federal waters differ significantly.
Regulating venting from older shelf platforms is difficult. About 15 years ago, the Federal government (MMS) considered requiring that older production platforms be retrofitted with flare booms, but safety, space limitations, and cost considerations precluded such a regulation. Instead, additional flaring/venting limits, and measurement and reporting requirements were imposed. What is next for these facilities?
Compiling and posting flaring and venting data should be a priority for BOEM/BSEE.
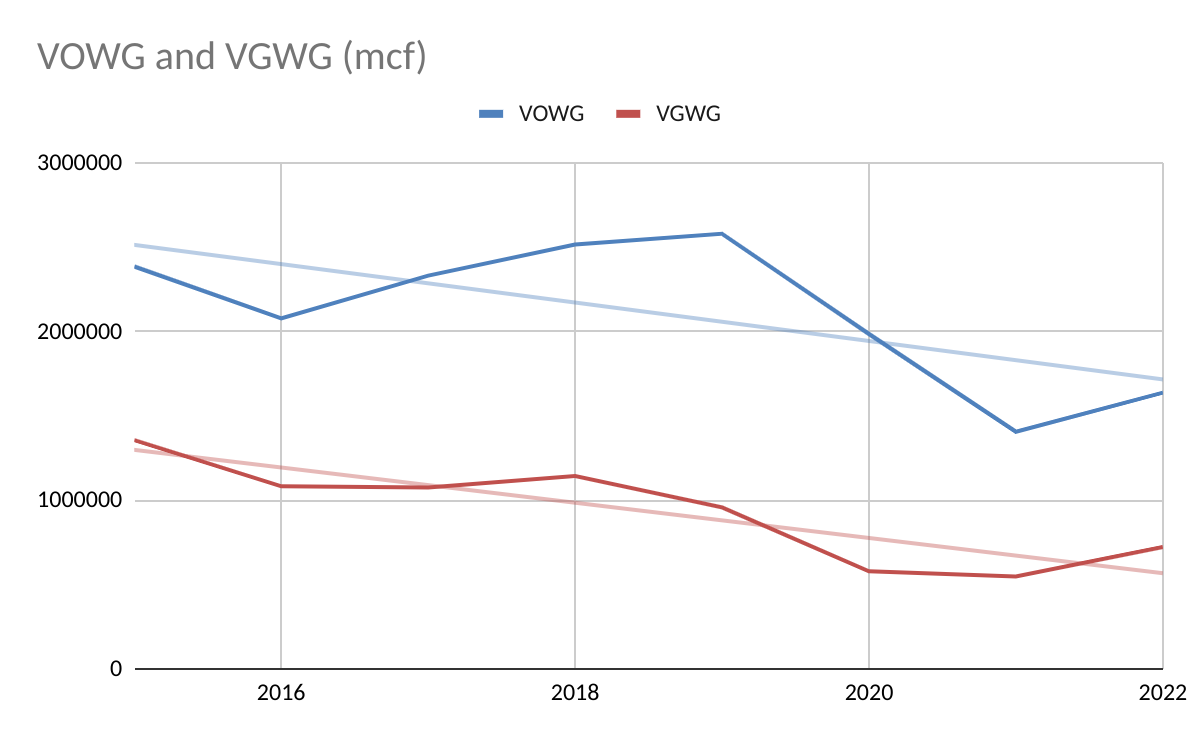
vented oil-well gas (VOWG) and vented gas-well gas (VGWG) vs. timeTotal CH4 emissions for the GOM from inventories and observations for federal waters (Left) and state waters (Right). Observationally informed emissions are shown for the resampling of absolute flux rates (resampling approach A), with a mean and 95% confidence interval. The inventory estimates represent values adjusted for the year 2021.PNAS, 2023
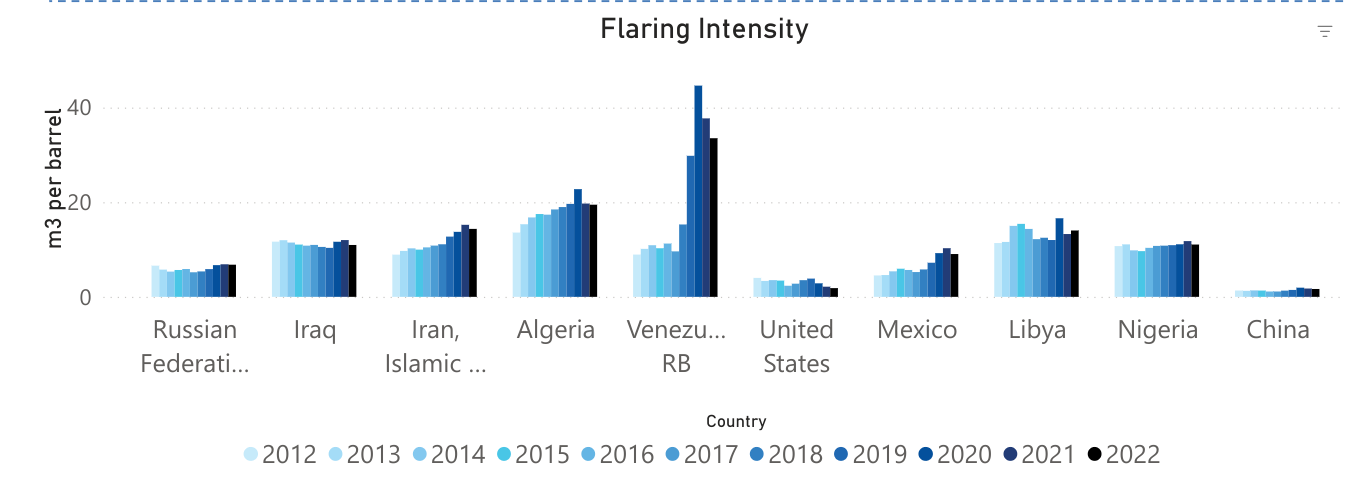
The latest World Bank data tell us that significant gas flaring issues persist. Worldwide, 138,549 million m3 of gas were flared in 2022. This equates to a massive 4 tcf, the equivalent of the reserves in a major gas field and more than 5 times the total gas production in the Gulf of Mexico in 2022.
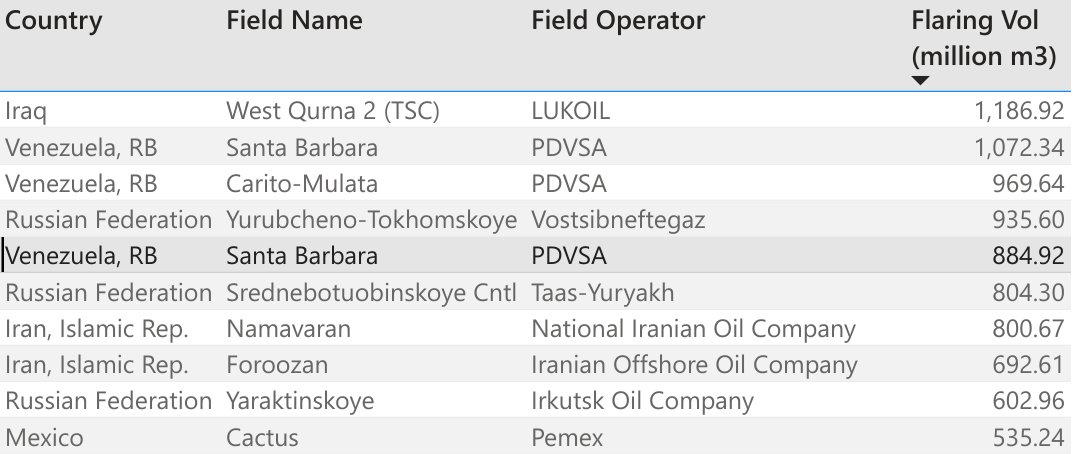
The top ten “flarers” are listed below. Each of these fields flared from 19 to 42 bcf. For comparison, the top ten GoM gas producers in 2022 produced 10 to 57 bcf, so single fields are flaring more than GoM companies are producing in total. Assuming for discussion purposes a gas-oil ratio of 1000 cu ft/bbl, all of the gas associated with 19 million to 42 million barrels of oil production was wasted from each field.
Posted below are the World Bank’s flaring intensity data (m3 of gas flared per bbl of oil produced) for the 10 countries with the highest flaring volumes. Venezuela’s flaring intensity rose to 44.6 m3/bbl in 2020, before declining moderately the following 2 years. 44.6 m3/bbl equates to 1575 cu ft/bbl. This gas flaring to oil production ratio implies that a very high percentage of Venezuela’s associated gas production was flared.
Here in North America, we have flaring issues of our own. Mexico’s Cactus Field is a top ten flarer (first table above) with 534.5 million m3 flared in 2022. The World Bank also lists 6 Permian Basin fields with >50 million m3 of gas flared in 2022.
Zeroing in on the US/Canada offshore sectors, fields with >1 million m3 of gas flared (2022) are listed below. Four of the top 7 are offshore Alaska and Newfoundland where the gas cannot currently be marketed and reinjection, field use, and flaring are the only options. Can production from these fields be better managed to reduce flaring volumes?
The NOIA/ICF report is favorable from a Gulf of Mexico perspective, but 2 general caveats should be highlighted:
“The estimation of the production related GHG for various crude oils and condensates is a complex process that is hindered by lack of public, up-to-date, and high-quality data.“
“There is considerable controversy regarding certain critical data including quantity of gas flared, operational flare efficiencies, and the volumes of methane releases along oil and gas supply chains.”
Comments:
More work is needed to better determine cold venting volumes:
Table 7, p. 13, of the NOIA/ICF report indicates venting (methane) emissions of 71,200 metric tons/year for GoM operations. That number is aligned with the 2017 GOADS data (70,488 tons per Table 6-11, p. 112).
The recent PNAS report found that much more gas is being vented: 410,000 – 810,000 tons annually. If the PNAS findings are accurate, venting is being significantly underestimated and/or under-reported.
Per ICF, lower flaring and venting volumes are the main reason for the GoM’s lower GHG emission intensity, so data accuracy is important. The difference between the government data and the PNAS findings (see table below) should be carefully assessed.
The NOIA/ICF report did not distinguish between GoM deepwater and shelf emissions.
The PNAS report indicates much higher methane emissions intensity on the shelf, as do most subjective assessments.
Future studies should provide separate GHG intensity data for shelf and deepwater facilities.
All production cannot be from the lowest emission intensity sources. The objective should be to minimize emissions from each source, not to eliminate production.GoM shelf operations have other advantages, most notably the production of nonassociated natural gas.
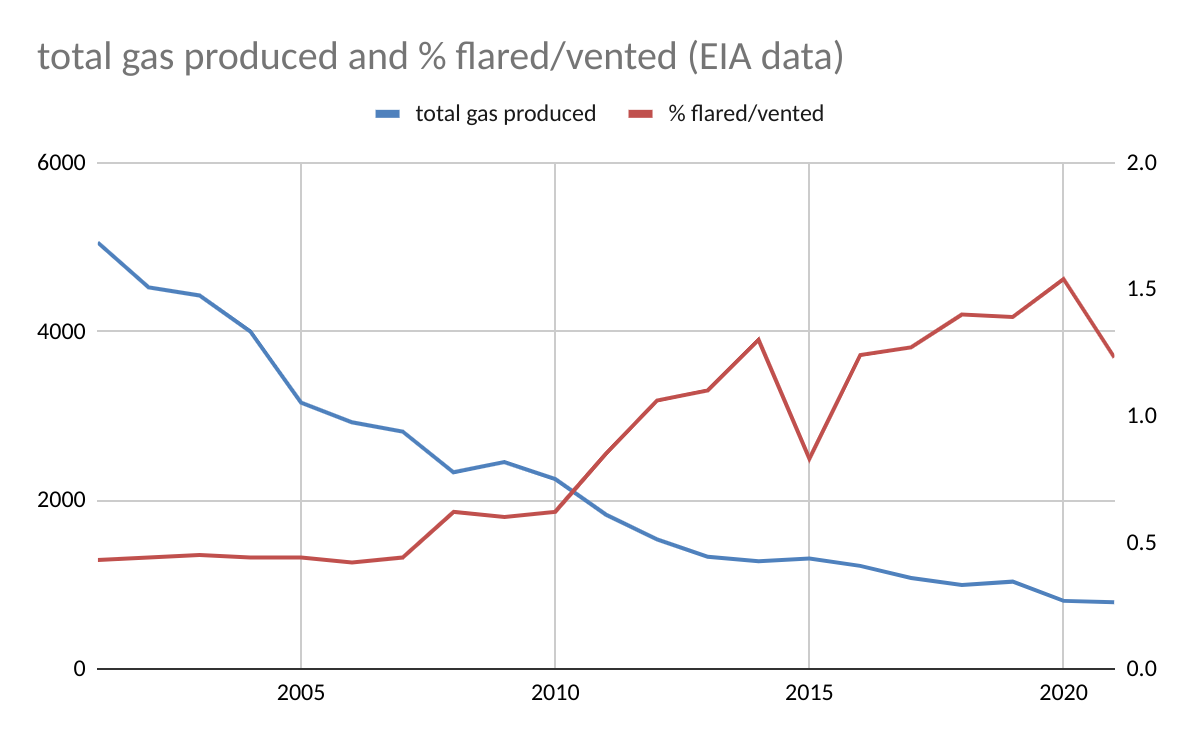
According to EIA data for 2001-2021, Gulf of Mexico flaring and venting volumes peaked in 2001 at 21.6 bcf, 2.25 times the volume flared or vented in 2022 (ONRR data for 2022). However, gas production in 2001 was 5.05 tcf, 6.4 times higher than in 2022. The % of the produced gas that was flared or vented in 2001 was thus 0.4%, less than 1/3 the 2022 rate of 1.22%.
Points to consider:
In 2001, gas production was mostly from gas wells, which have lower flaring/venting rates. As gas production declined because of lower gas-well gas (GWG) production, flaring/venting rates increased (see the chart below). This would account for some of the difference in flaring/venting rates (2001 vs. 2022). However, in recent years, the % of gas-well gas flared or vented has been between 0.3 and 0.5% which is comparable to the rate for all gas production (0.4%) in 2001. So the reduction in GWG production is not the entire reason for the higher flaring/venting rates in recent years. Hence the need for more transparency on flaring/venting performance.
Oil-well gas (OWG) production alone in 2001 (923 bcf) was higher than total gas production (784 bcf) in 2022. If the oil-well gas (OWG) flaring/venting rate was the same as the recent rate for OWG (1.2-1.5%), the volume of gas flared or vented from OWG alone (only 18% of total gas production in 2001) would have accounted for 11.1 – 13.8 bcf or 51-64% of the total volume flared/vented in 2001.