Impressive acquisition:
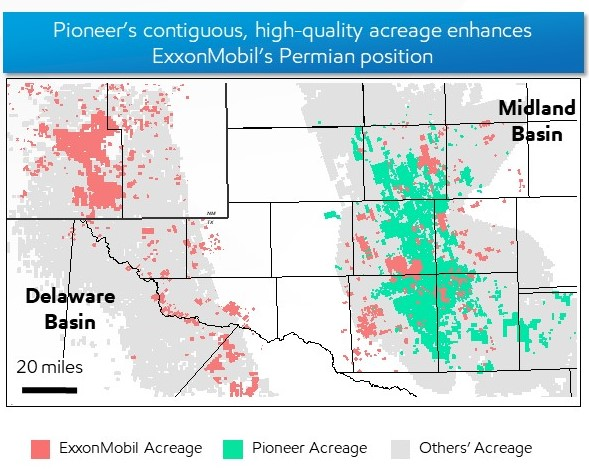
- Exxon has acquired Pioneer’s 850,000+ Permian acres, which increases their Permian holdings by approximately 150%.
- The acquisition will increase their Permian resource to an estimated 16 billion barrels of oil equivalent.
- Exxon’s Permian production volume will more than double to 1.3 million barrels of oil equivalent per day, and is expected to increase to approximately 2 MOEBD in 2027.
- Pioneer appears to be a responsible operator from an HSE standpoint.
Hypocrisy?
- Exxon is clearly intent on maximizing production in the Permian. This makes good business sense and is good for the US economy.
- Contradictorily, Exxon intends to establish a CO2 disposal business (“carbon sequestration”) in the Gulf of Mexico. Is their goal to profit from emissions resulting from the consumption of the production that they are maximizing?
- If Exxon believes the consumption of oil and gas is harmful to society, as suggested by their CO2 disposal plans, perhaps they should be curtailing their oil and gas production business rather than expanding it.
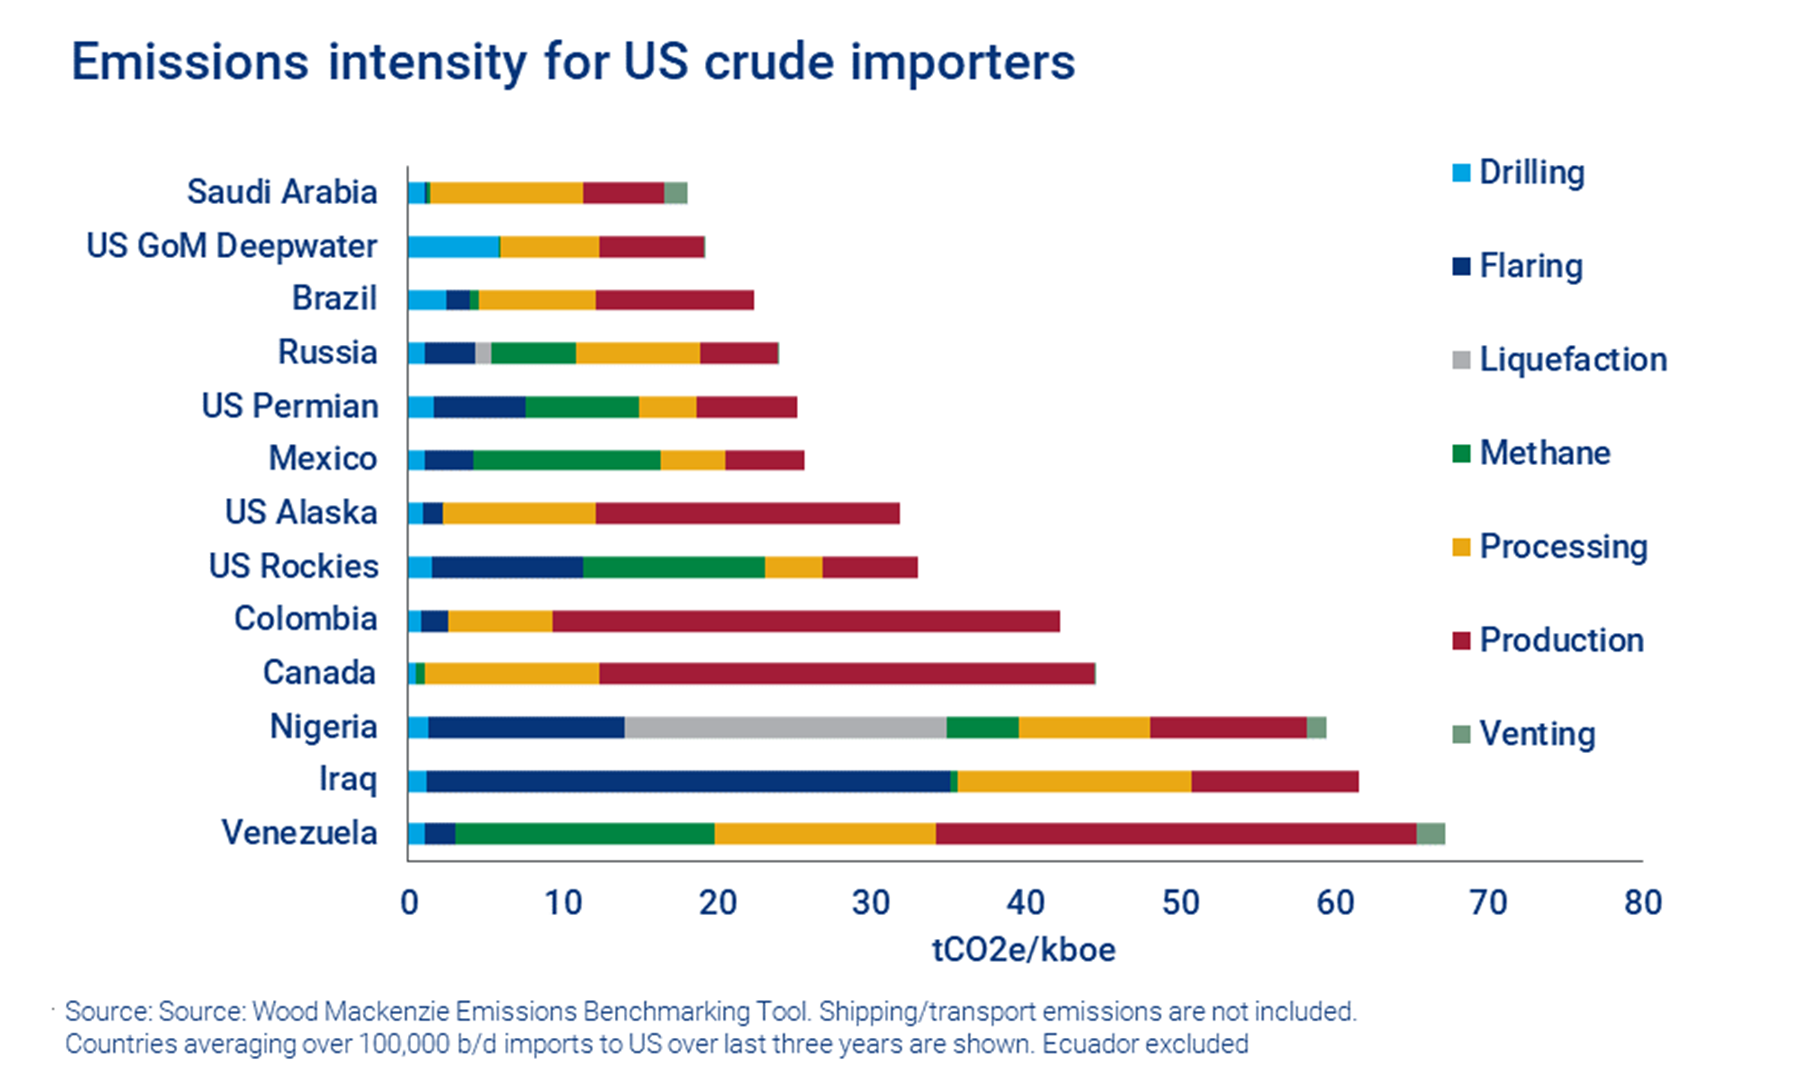
- Deepwater Gulf of Mexico production, which Exxon has shunned, has much lower carbon intensity than Permian production, but Exxon’s sole GoM interest is CO2 disposal. Shouldn’t a company that is intent on reducing upstream GHG emissions be active in the leading offshore region in that regard, the region that is adjacent to their world headquarters?