Feeds:
Posts
Comments

Posts Tagged ‘air emissions’

The Case for Reefing California Platforms by John Smith

Environmental groups like the Environmental Defense Center and Get Oil Out continue to oppose converting the jackets of California oil and gas platforms to artificial reefs despite scientific studies (Claisse et al. 2014) showing “oil and gas platforms off the coast of California have the highest secondary fish production per unit area of seafloor of any marine habitat that
has been studied.

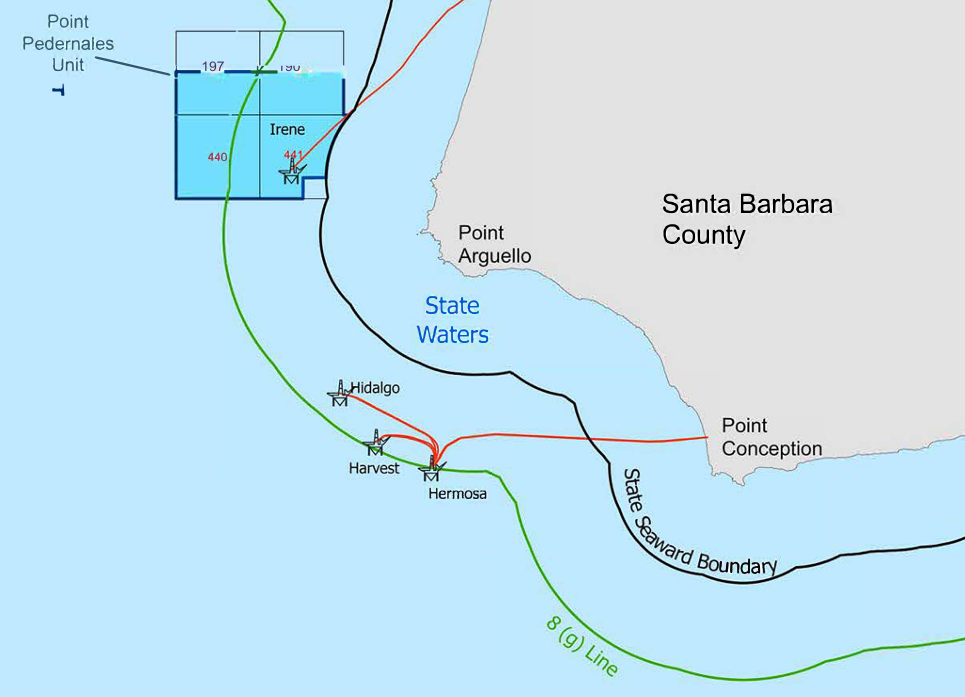
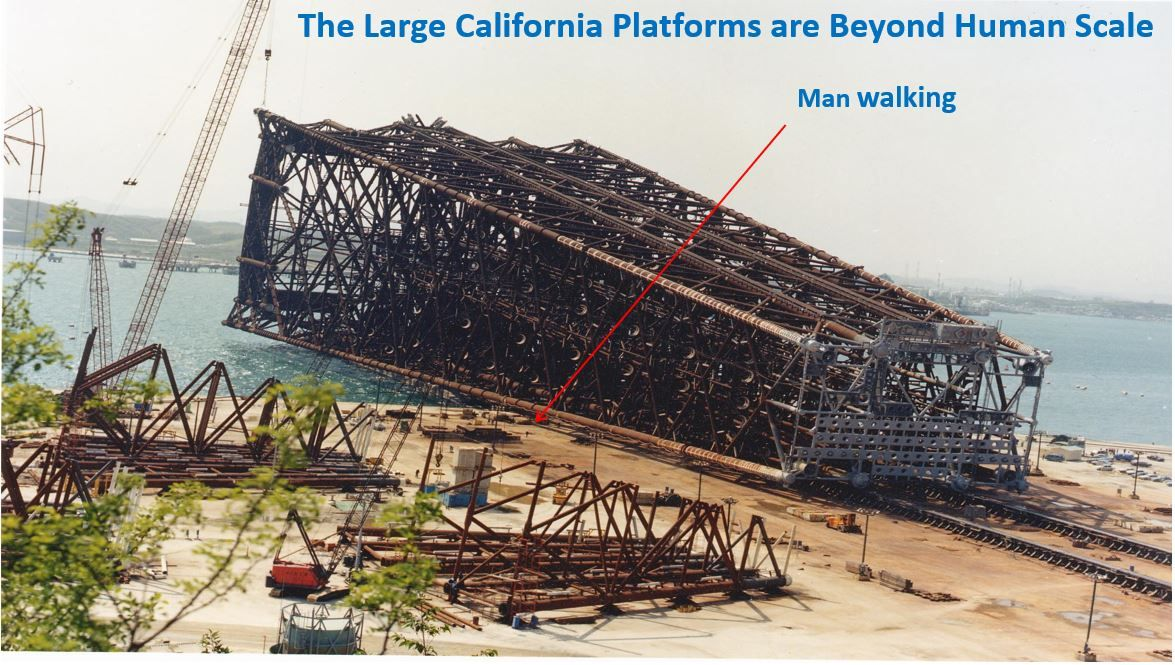
Another important factor environmental groups and the 2023 BOEM Programmatic EIS for Decommissioning failed to consider and acknowledge is the huge amount of air emissions that would be released by world-class heavy lift vessels like the Thialf or Balder Semi-submersible Crane Vessels (SSCVs) that would be required to safely and efficiently remove the large federal OCS platforms like Harvest, Hermosa, and Hidalgo (HHH). The HHH platforms are in waters depths ranging from 430-675 feet and have combined deck and jacket weights ranging from 20,000 – 25,000 tons. In comparison, the wrought iron structure of the Eiffel Tower weighs about 8,000 tons.

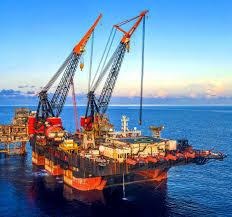
The SSCVs and accompanying Anchor Handling Tugs (AHTs) used to remove the HHH platforms will likely to be mobilized from distant locations like the North Sea or Gulf of America where they typically operate. Because SSCVs like the Thialf and Balder are too large to enter the Panama Canal, this would involve a 20,000 nautical mile roundtrip voyage around the tip of South America.

Three to four campaigns, and separate SSCV and AHT mobilizations and demobilizations, are projected to be required to fully remove the HHH platforms because the challenging oceanographic conditions offshore Point Arguello restrict heavy lift operations to a 150-day period between May and October.

Four campaigns by the SSCV and AHT would consume about 300,000 metric tons (mt) of marine diesel oil and release approximately 470,000 mt of CO2 and 11,000 mt of NOX emissions. To put these numbers into context, 470,000 mt of CO2 and 11,000 mt of NOX are:

  • the amount of CO2 emissions released by providing electrical power to 97,600 homes annually (the city of Santa Barbara has about 38,000 housing units).
  • the amount of CO2 emissions released by burning 1.1 million barrels of oil.
  • the amount of CO2 emissions released by 102,000 gasoline burning cars annually.
  • the amount of NOX emissions released by four large oil or coal-fired power plants annually.
  • the total annual NOX emissions in Santa Barbara County.

And this is only the emissions released during mobilization and demobilization of the SSCV and AHT. If full removal is required, an additional 50 days of operational time by the SSCV and AHT is estimated to be required to remove the topside and jacket of each HHH platform. This could be reduced to about 15 days per platform if the jackets are converted to artificial reefs. Only one SSCV and AHT campaign may be required if the HHH jackets are reefed, compared to the four campaigns required for the full removal scenario. This would result in a 75 percent reduction in CO2 and NOX emissions.

Read Full Post »

In February, EPA Region 2 asked the agency’s Environmental Appeals Board to remand Atlantic Shores’ air emissions permit back to the Region for reconsideration. That remand (attached) was granted on 14 March over the objections of Atlantic Shores Offshore Wind.

Atlantic Shores Offshore Wind still exists despite the exit of 50% partner Shell and a $940 million write down by the remaining owner EDF. The diagram depicts Atlantic Shores South (0499) and North (0549) lease areas.

EDF intends “to preserve the company and its future development.” Whether or not they can hold the leases indefinitely without pursuing development remains to be seen. BOEM’s diligence regulations for offshore wind projects are vague, and neither the Construction and Operations Plans nor BOEM’s Record of Decision (Atlantic Shores South) include work schedules.

Does EDF have the right to sit on the lease until the financial and regulatory environment is attractive? That is not allowed for oil and gas leases, and rightfully so. (See a related post on Total’s wind lease.)

Meanwhile, ACK for Whales has petitioned EPA Region 1 to reopen and reanalyze the air permits for permits for the New England Wind 1 and 2 projects asserting that:

  • The analysis does account for emissions related to and resulting from blade failures, which would warrant emergency repairs or replacement activities.
  • The decision to group Vineyard Wind 1, New England Wind 1 and New England Wind 2, as a single stationary source is both legally questionable and could have the effect of masking localized emission spikes.
  • Insufficient consideration of cumulative vessel emissions could lead to 1-hour NO₂ exceedances.
  • The emissions from pile driving are not adequately modeled in isolation or synergistically.

Read Full Post »

An interesting study published in the Proceedings of the National Academy of Sciences (PNAS) was brought to my attention by leading offshore energy historian Tyler Priest. The study used airborne observations and emissions reports to measure the carbon intensity (CI) of Gulf of Mexico oil and gas production. Their CI measure is grams of CO2 equivalent of greenhouse gas emissions per megajoule of energy produced.

The authors conclude that inventory emissions of CO2 (as reported to BOEM) “are generally consistent with observations from our aircraft survey, suggesting that combustion is well represented in the federal inventory.

However, that is not the case for methane (CH4) emissions which are underestimated by the Federal inventories. As summarized in the chart below, deepwater facility methane emissions are consistent with the reported inventories, but shelf emissions in State and Federal waters differ significantly.

Comments:

  • As previously discussed, the lower CI for deepwater production is entirely consistent with expectations. When the most modern 5% (57) of GoM platforms are producing 93% of the oil and 76% of the gas, their CI should be impressive (which indeed it is).
  • As summarized using ONRR data, more gas-well gas was vented from 2015-2021 than was flared, which is not what you want from a GHG standpoint. Gas wells are predominantly at shallow water facilities, many of which are not equipped with flare booms.
  • Oil-well gas, most of which is produced at deepwater platforms, is flared rather than vented by a ratio of approximately 4 to 1.
  • About 15 years ago, the Federal government (MMS) considered requiring that older production platforms be retrofitted with flare booms, but safety, space limitations, and cost considerations precluded such a regulation. Instead, additional flaring/venting limits, and measurement and reporting requirements were imposed.
  • One bad actor may have been a major contributor to the shelf methane emissions observed during the study’s observational flights. That company entered into bankruptcy proceedings. Presumably those issues have been resolved and more rigorous monitoring and enforcement practices have been implemented. I’ll be looking at the 2022 ONRR flaring and venting data for evidence of such improvement. The remainder of the 2022 data should be available in May.
  • The subject study’s only observational measurements were in August 2020. Followup airborne measurements would be helpful.
  • The study only considered production emissions. Shelf facilities are primarily natural gas producers and would thus have a lower relative CI when consumed.
  • When will updated BOEM GOADS flaring and venting data be available? The latest data are for 2017 (cover below)? Are GOADS data being compared with ONRR and World Bank data?

Read Full Post »