Gulf of Mexico flaring and venting data have been sorted for the years 2015-2021. The reporting of these data is mandatory and strictly enforced, so these ONRR numbers should be accurate.
Biggest surprise: The biggest surprise is that there were no big surprises in the data. The % of gas flared and vented were generally consistent with expectations based on familiarity with historical data.
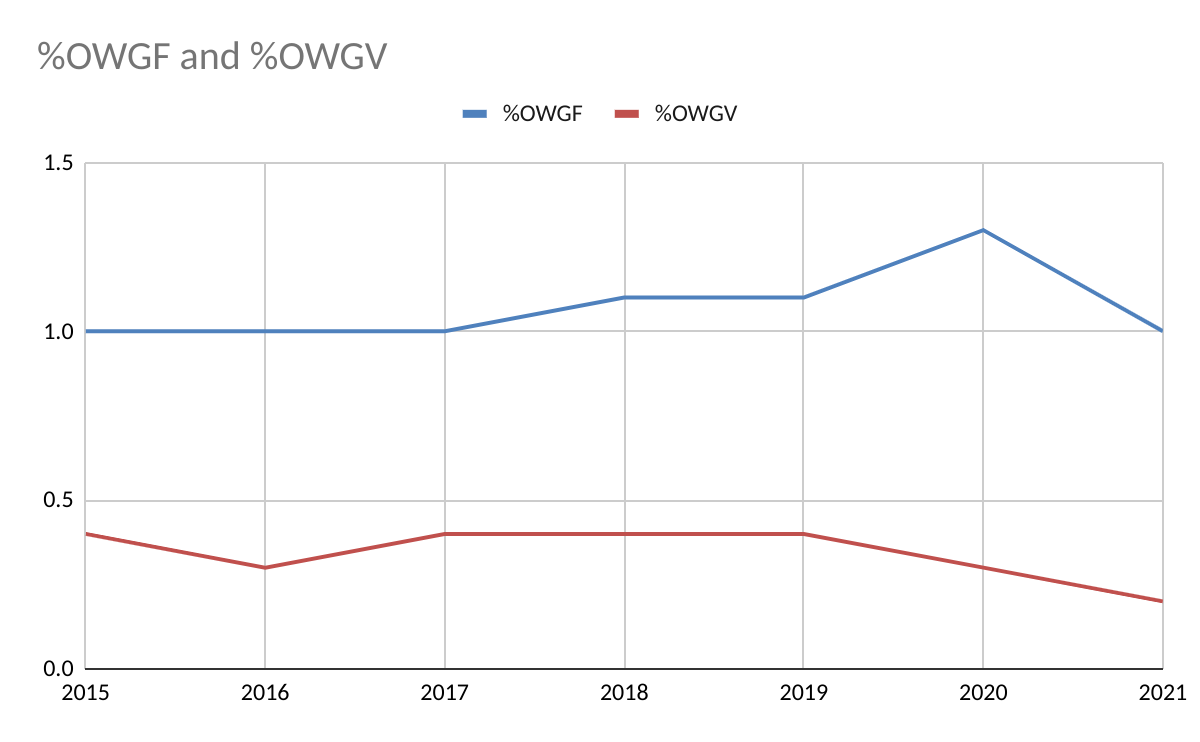
Encouraging sign: The % of oil-well gas vented has ticked down over the past 2 years which is encouraging from a GHG standpoint. This is presumably because most associated gas is produced on modern deepwater facilities equipped with flare booms. An astute politician would be rushing to take credit for this achievement.😀
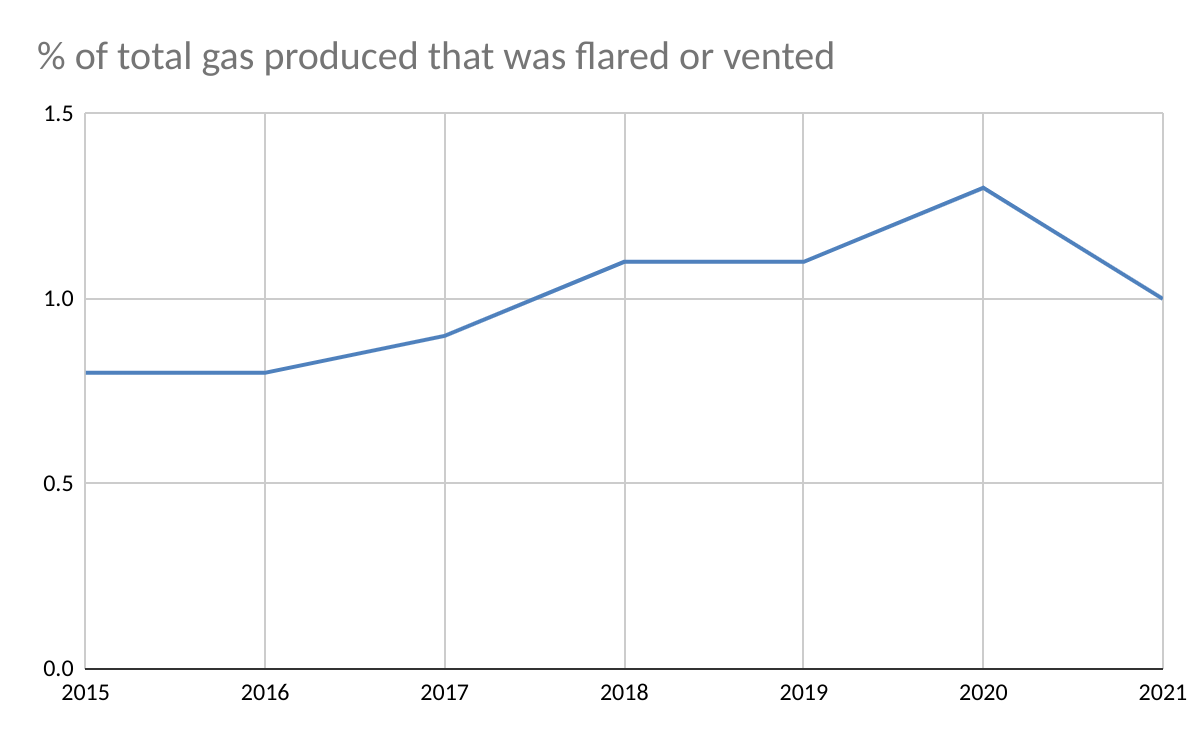
ONRR mandatory production reporting data are being sorted to assess GoM flaring and venting trends. This will help resolve inconsistencies previously identified. In the meantime, the table below summarizes the 2021 data. 1.03% of the gas produced that year was flared or vented. 0.25% of the gas production was vented.
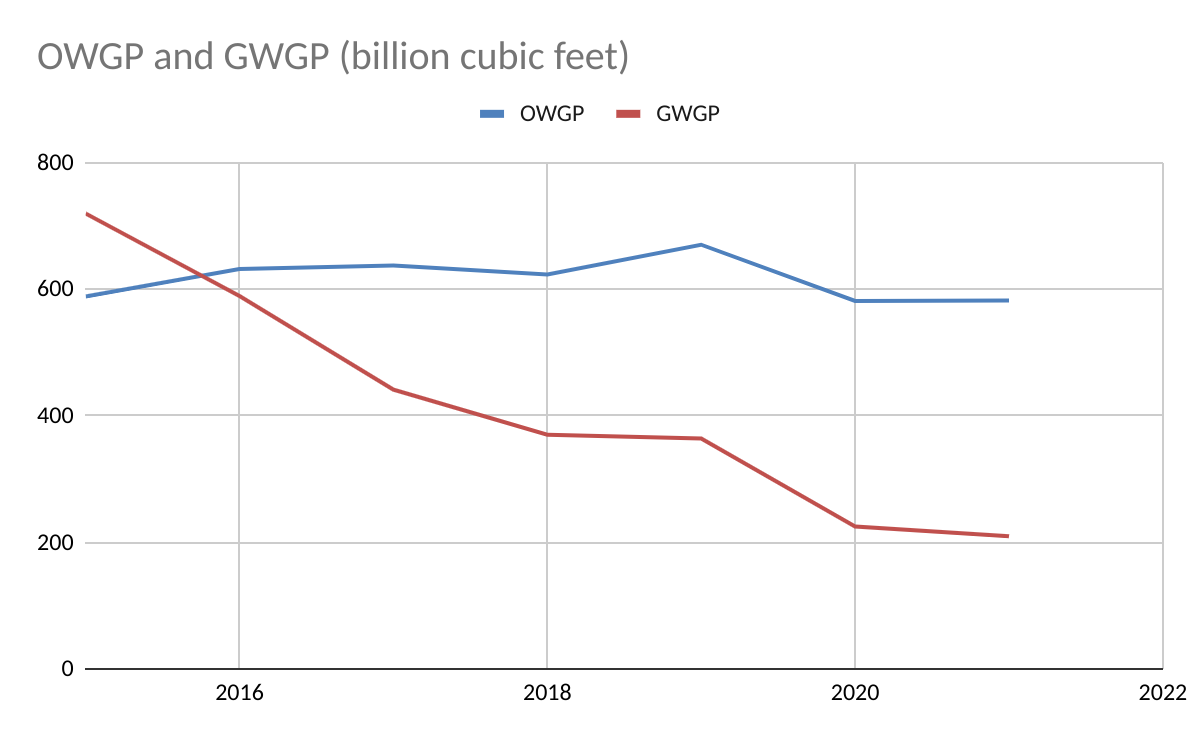
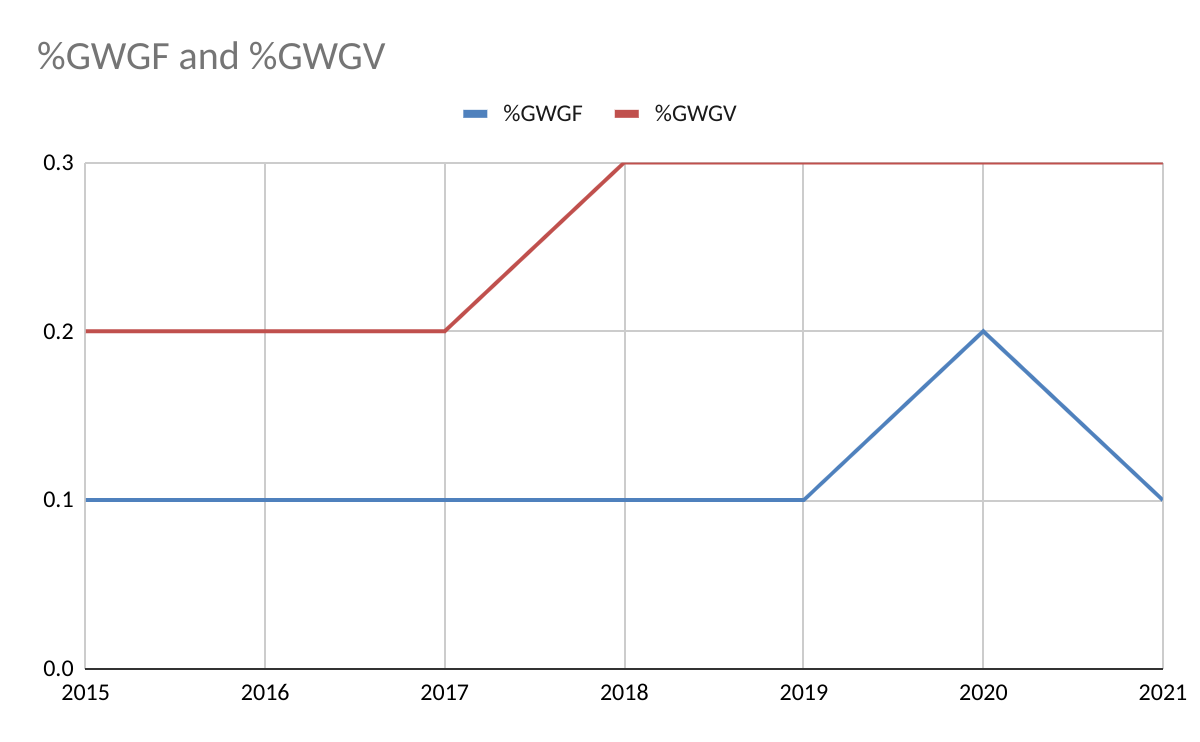
Interestingly, more gas-well gas was vented than flared. This is presumably because older shelf facilities without flare booms still produce 25% of the gas (versus only 7% of the oil), mostly from gas wells. More to follow.
gas production
flared (%)
vented (%)
flared & vented (%)
OWG
582,204
5919 (1.01)
1405 (0.24)
7324 (1.26)
GWG
209,779
311 (0.15)
548 (0.26)
859 (0.41)
total
791,983
6230 (0.79)
1953 (0.25)
8183 (1.03)
OWG=oil well gas; GWG=gas well gas; all volumes are in MMCF
Kudos to ONRR for posting complete flaring and venting data for all oil and gas operations on US Federal and Indian lands. These data, which distinguish between oil-well gas and gas-well gas, are included in the large “Production Disposition by Month” file that can be downloaded here.
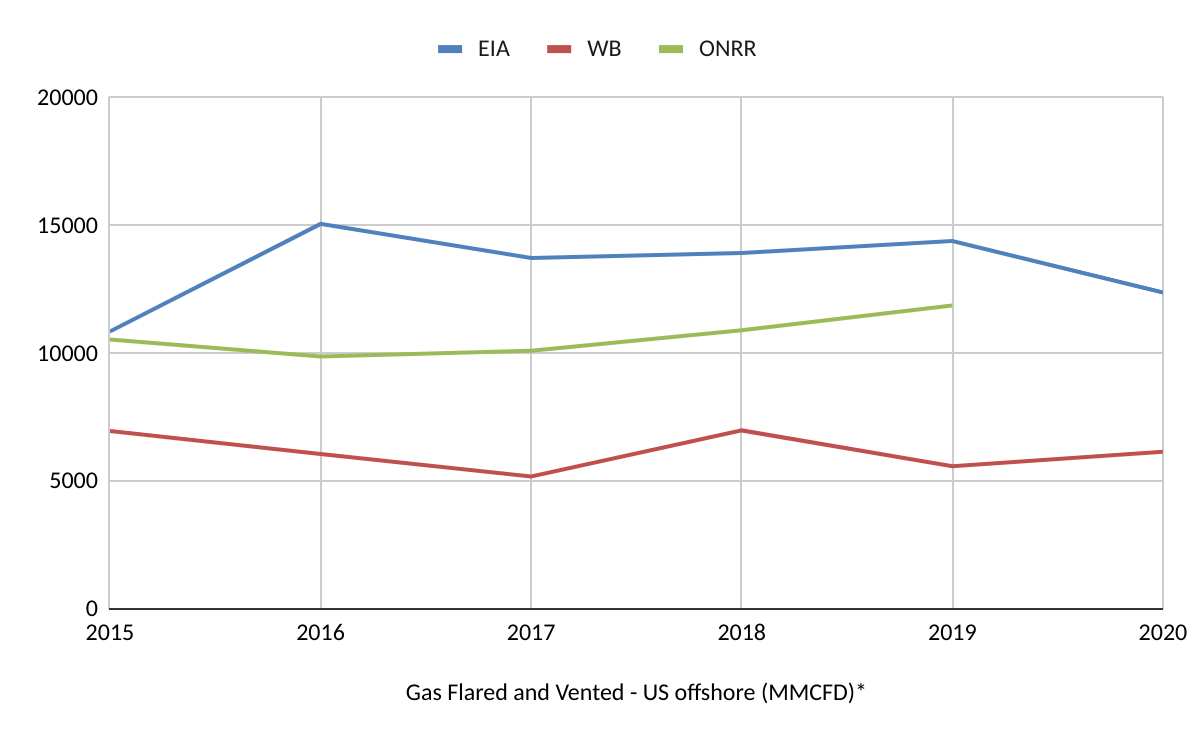
Given the importance of flaring and venting from both environmental and resource conservation standpoints, accurate and reliable data are necessary and should be readily available to the public. ONRR has advised me that they will begin posting flaring and venting data on their website within 2 months. This is a positive step. Currently, data from the 3 primary sources differ considerably.
Data Sources:
US Energy Information Administration (EIA): Per EIA, their flaring and venting data are received directly from the Bureau of Safety and Environmental Enforcement (BSEE).
Office of Natural Resources Revenue: ONRR is a sister bureau of BSEE within the Department of the Interior. Per BSEE regulations, all flared or vented gas must be reported to ONRR. As noted above, ONRR will begin regularly posting flaring and venting data within the next 2 months. This is a most welcome and positive step and may help address these inconsistency issues.
World Bank Global Gas Flaring Reduction Partnership: “a multi-donor trust fund composed of governments, oil companies, and multilateral organizations committed to ending routine gas flaring at oil production sites across the world.”
Comments:
The EIA (from BSEE) and ONRR flaring/venting numbers should be the same given that the ONRR data are reported in accordance with BSEE regulations, and BSEE is presumably providing ONRR data to EIA. This needs to be clarified.
The World Bank’s gas flaring estimates are based on observations from satellites. This explains their lower numbers given that vented gas would not be detected and some flares might be missed.
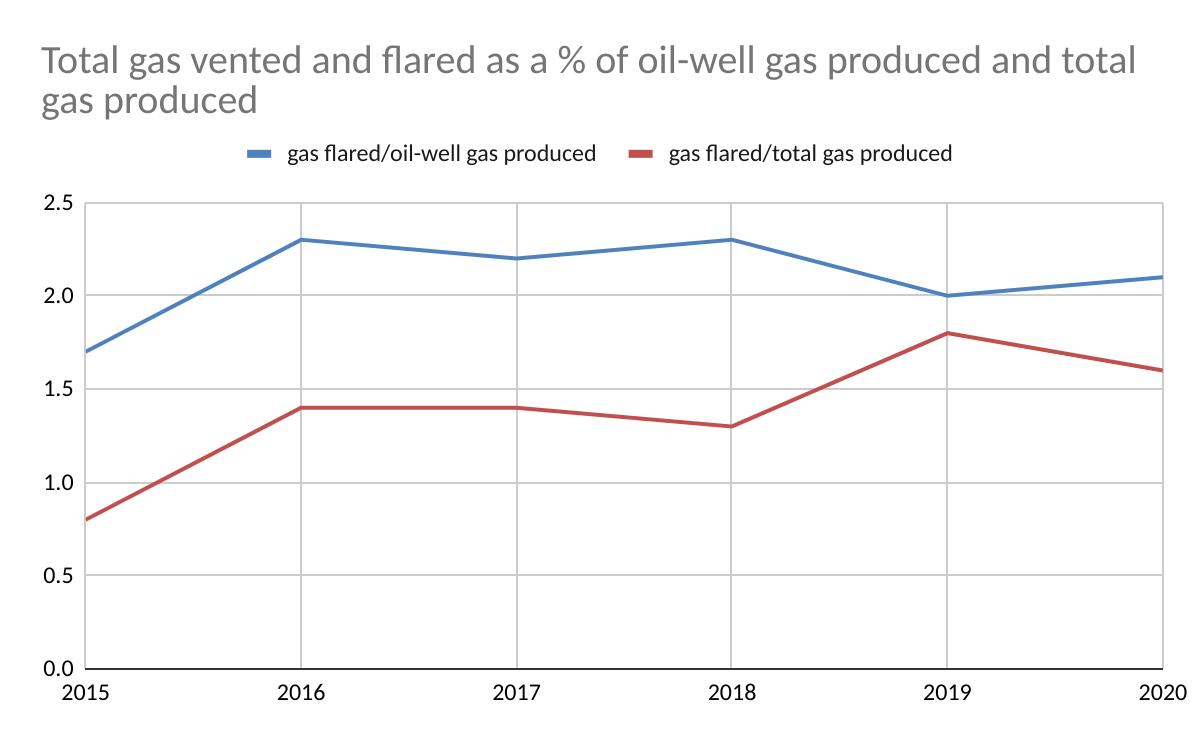
In a 1/2021 interview with World Oil, the exiting BSEE Director commented that the “industry has consistently achieved a ratio of less than 1.25% of flared, vented gas to produced gas.” However, based on EIA flaring and venting data (from BSEE per EIA) and EIA gas production data, the volume of gas flared/vented exceeded 1.25% of the gas produced from 2016-2020 and was as high as 1.8% in 2019. (See the chart below.) Even if the lower ONRR flaring/venting totals are used, those volumes exceeded 1.25% in 2019 (1.5%).
BSEE/ONRR should make more detailed flaring/venting data available so that the differences between facilities and sectors (e.g. deepwater vs. shelf) could be assessed. Efforts should also be made to post these data in a more timely manner. At this time, 2021 data are still not available.
p. 17 – “The 2015 BSEE/BOEM study on reducing methane emissions observed that “while natural gas production has declined, …vented and flared gas volumes as a percentage of produced natural gas are increasing” and noted that additional investigation is needed to determine why.” This is consistent with my observations and is probably due in large part to the fact that most gas production is now from oil-wells (e.g. associated gas).
p. 24 – “Argonne estimates, in 2015, platform startups for deep-water floating structures accounted for roughly 15% of the total annual flaring volume on the OCS and an additional 20% of the annual total resulted from monthly spikes associated with compressor outage, pipeline maintenance, and well-unloading.”
Univ. of Michigan study (2020): “Large, older facilities situated in shallow waters tended to produce episodic, disproportionally high spikes of methane emissions. These facilities, which have more than seven platforms apiece, contribute to nearly 40% of emissions, yet consist of less than 1% of total platforms.”