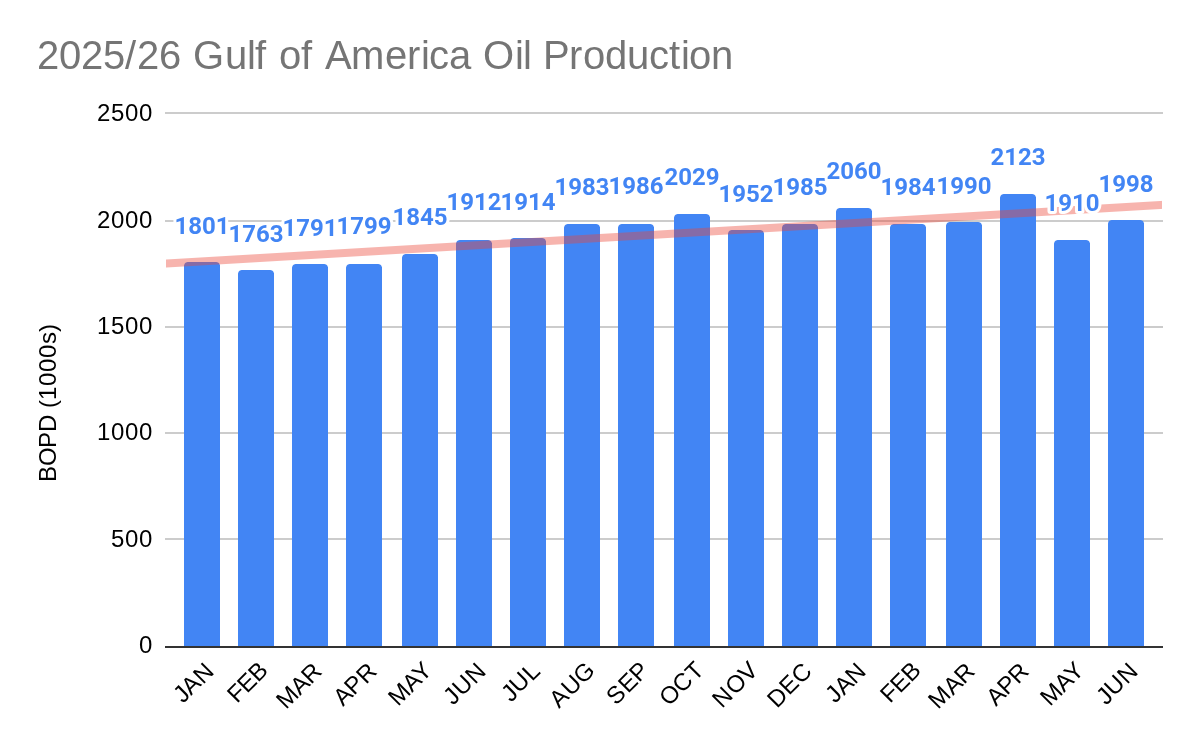
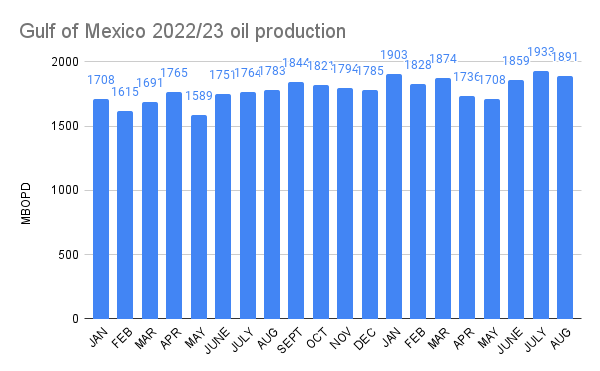
The EIA’s Gulf production revisions have been more significant in recent months. For example, May production was increased by 48,000 bopd over the past 2 months. Yesterday’s report increased June production by 44,000 bopd.
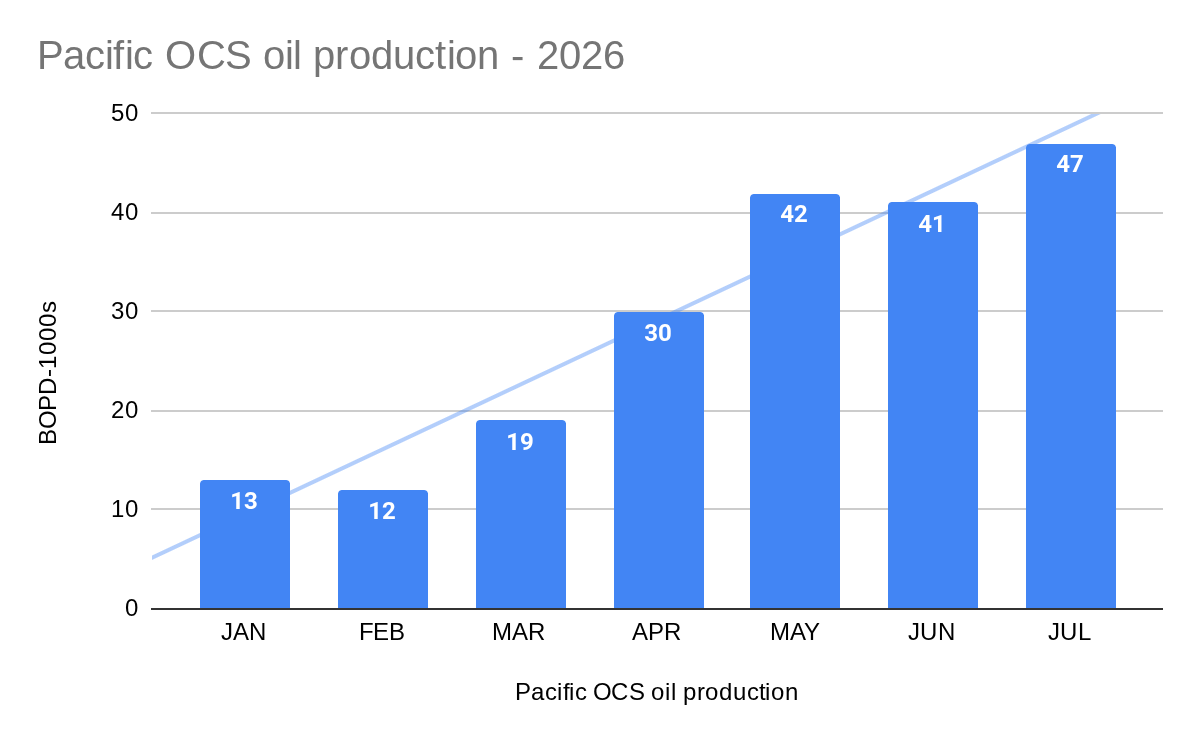
The July production bump in the Pacific was slightly less than expected. Given that Sable reported July production of 38,000 bopd and the production estimate for the other platforms is ~12,000 bopd, a total of 50,000+ bopd was expected.
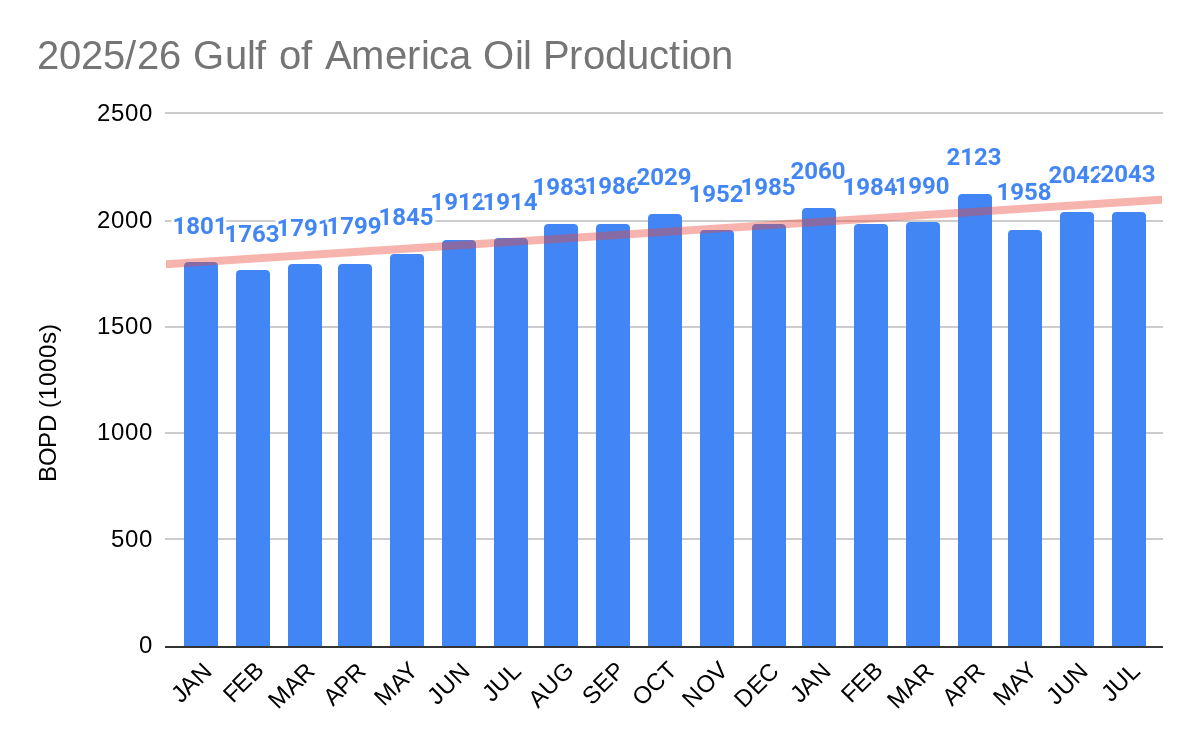
Raising the bar! The EIA’s August data release (delayed until 9/2) upped the Gulf’s all-time monthly production record (April 2026) by 14,000 bopd to 2,123,000 bopd. June production settled in just below the 2 million bopd mark.
Six months after the year ended, the Office of Natural Resources Revenue (ONRR) has completed their precise, to the barrel, production accounting. BOEM was correct – 2025 was a record OCS oil production year by a considerable amount. Total OCS production, nearly 714 million bbls, exceeded the 2019 record by 14 million bbls. EIA data still favor 2019 by a slight margin.
The 16+ million barrel difference between the 2025 ONRR and EIA OCS production totals is much larger than any such differential in recent years and warrants an explanation. Below are the 2025 OCS totals (first table) and the 2019 to 2025 Gulf totals (2nd table). As indicated in the second table, all other differentials between ONRR and EIA were <2 million bbls, and only the 2024 differential was >1 million bbls.
BOEM Press Release: “The Bureau of Ocean Energy Management announced today the critical role of offshore leasing, resource assessment and long-term planning in supporting record oil production on the U.S. Outer Continental Shelf, which reached more than 714 million barrels in 2025.”
Was 2025 a record OCS oil production year?No, 2025 came very close, but barring belated revisions, 2019 retains the record.
Did 2025 oil production exceed 714 million barrels? Not even close according to the US Energy Information Administration (EIA), which reported a final OCS production total of 692.6 million barrels for 2025. The Office of Natural Resources Revenue (ONRR), to whom all production data must be reported, has yet to post their final 2025 numbers, but they are normally very close to the EIA totals. Also, ONRR’s fiscal year totals do not suggest calendar year production in excess of 700 million barrels. BOEM’s announced 714 million barrel CY 2025 total is more than 60,000 bopd higher than the actual EIA CY or ONRR FY daily averages, and even exceeds the total posted in BOEM’s data center.
See the 2019 and 2025 oil production totals in the table below. The BOEM 2025 numbers appear to be erroneous.
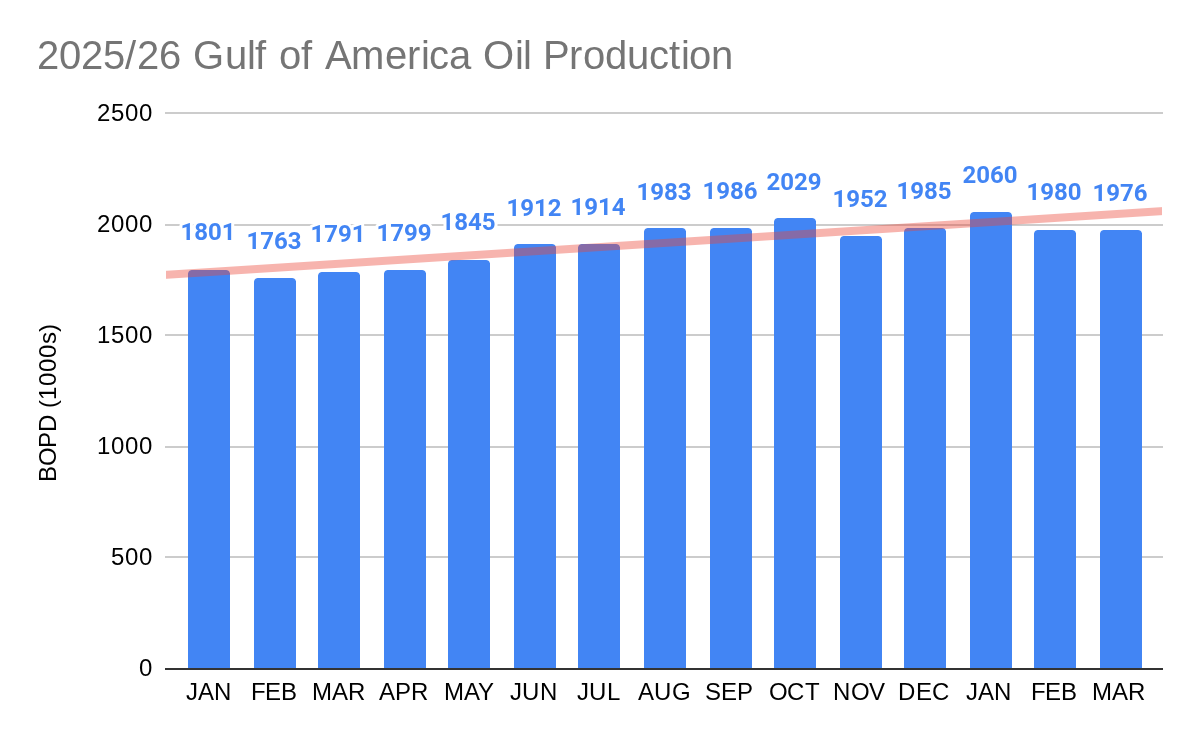
On the plus side, per EIA’s latest update, Jan. 2026 was a record production month for the Gulf. January’s ave. production of 2.060 million bopd surpassed the Aug. 2019 ave. of 2.044 million bopd.
Barring significant tropical storm shut-ins over the next 6 months (hurricane season starts today!), a production record in 2026 seems like a good possibility.
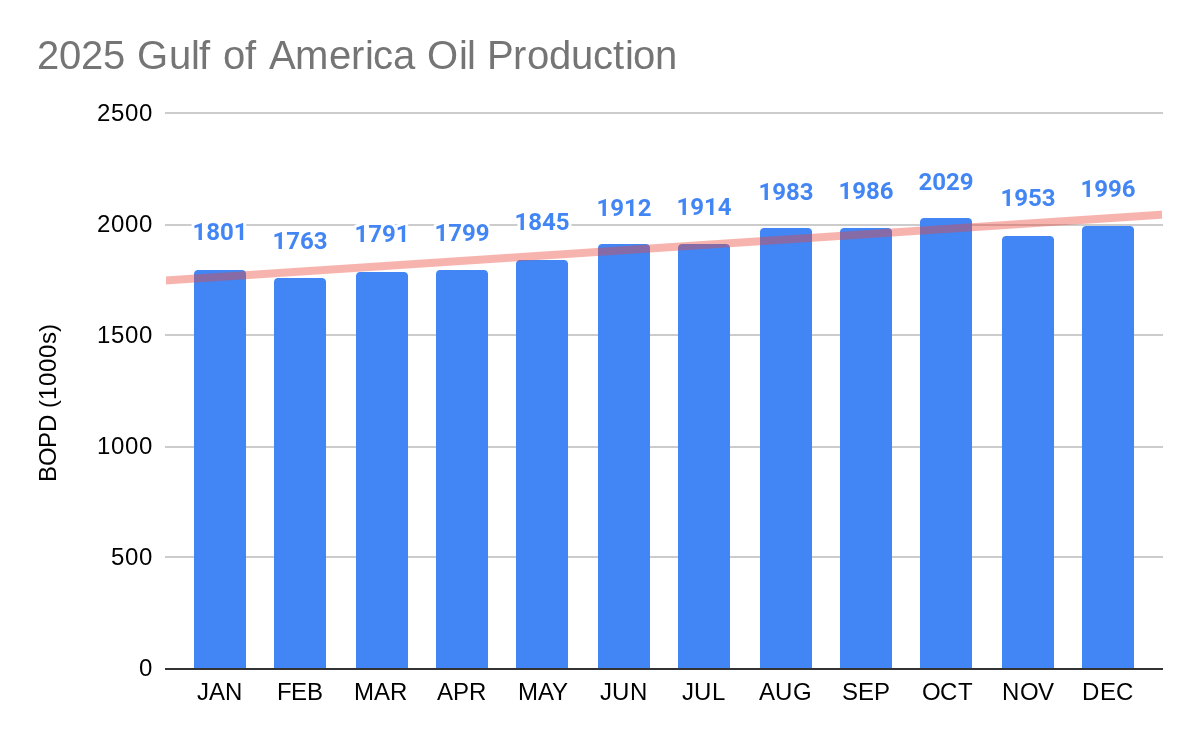
The EIA has revised Gulf of America oil production slightly downward for Nov. and Dec. such that we now have an absolute dead heat between 2025 and 2019. Production for both years averaged exactly 1.898 million bbls/day.
Because of the ~6 month lag in obtaining verified OCS production data from the Office of Natural Resources Revenue (ONRR), the monthly EIA reports are based on ONRR’s more timely sales of production data. The final sales and production numbers are typically very close. For the 2019 record OCS production year, both the EIA and ONRR report identical Gulf production of 1.898 million bopd.
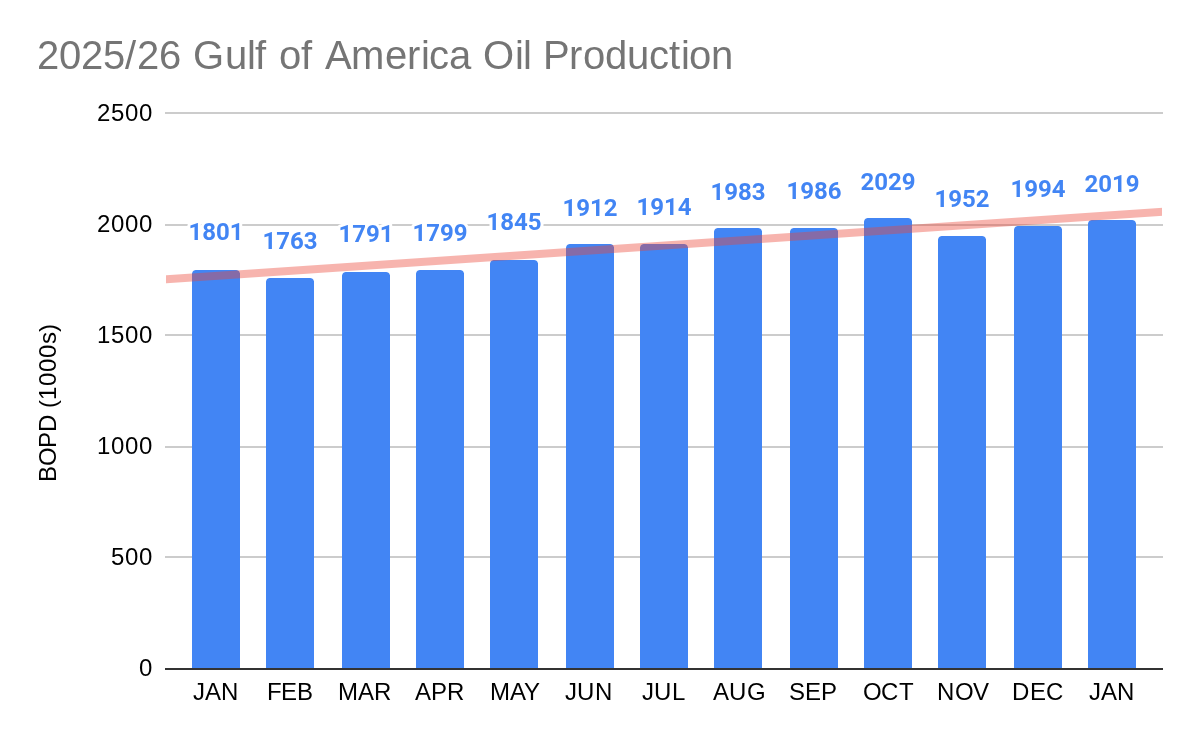
Meanwhile, 2026 Gulf production (chart below) is off to a strong start – 2.019 million bopd in January. This is the third highest monthly oil production in the history of Gulf operations.
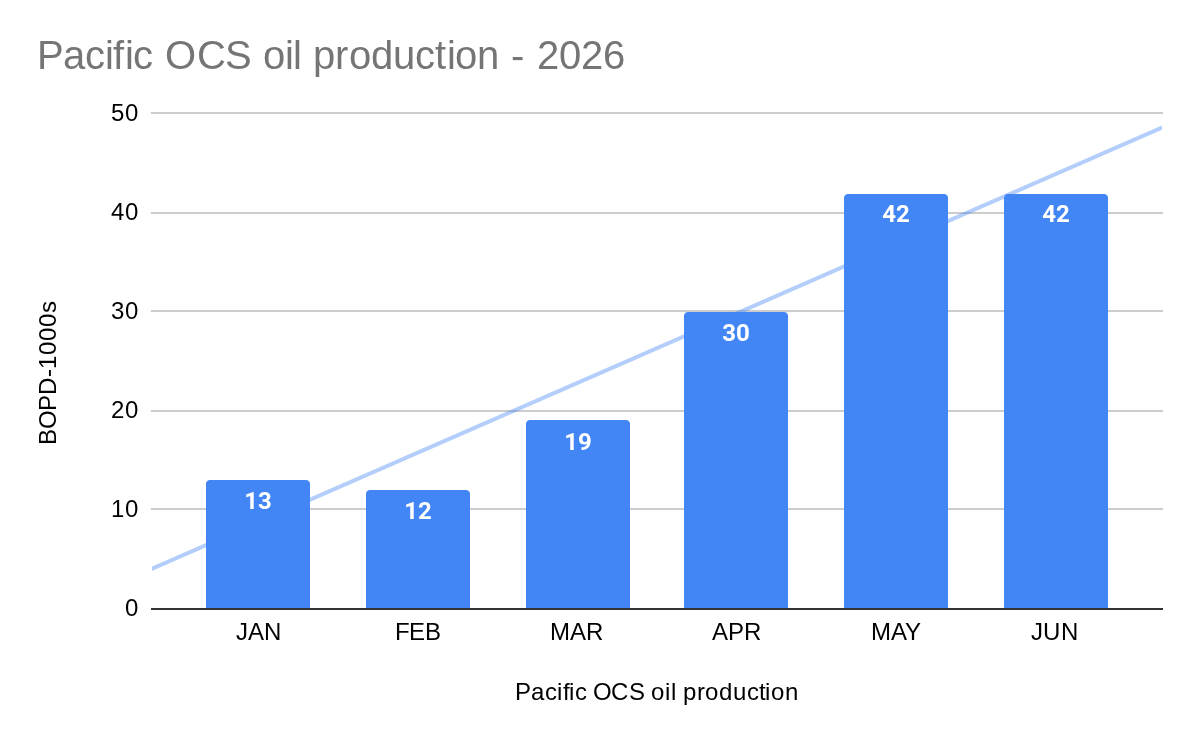
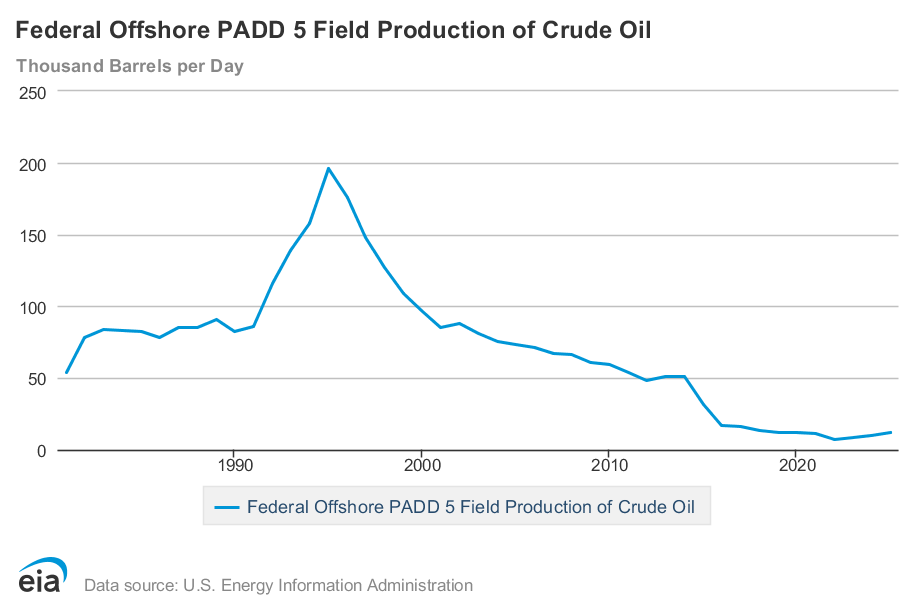
Finally, California OCS oil production, which has been hobbling along at ~10,000 bopd (2nd chart) will see a massive increase of up to 500% should Santa Ynez Unit production continue.
December 2025 Gulf oil production had to average 1.993 million bopd for 2025 to match the 2019 record. It exceeded that mark by 0.003 million bopd. However, October and November production were revised slightly downward resulting in a near dead heat annual average.
A closer look at the numbers (table below) shows that 2025 edged 2019 by a mere 250 bopd. Amazing!
Major caveat: The Nov and Dec 2025 figures will likely be revised slightly when EIA releases the next update at the end of January. Fingers crossed!😀
Per Baker Hughes, the latest (2/20/2026) Gulf of America rig count (2/20/2026) slipped to 9. The count was 10 the previous week and 12 a year ago. In 2023 and 2024, the BH rig count was a more healthy 15-20.
8 of the 9 rigs currently drilling are at high potential deepwater locations: 3 in the Mississippi Canyon Area, 3 in Green Canyon, 1 in Walker Ridge, and 1 in Alaminos Canyon. One rig was drilling on the shelf in the Eugene Island Area.
Per MMS data,the active Gulf rig count in 2001 was 148. The 2001 count was not a one year blip; the number of rigs active in the Gulf exceeded 100 for the ten year period from 1994-2003.
Although drilling and production have become more efficient with improved exploration technology, modern well completion practices, high pressure/temperature equipment, and enhanced recovery programs, drilling activity must still be sufficient to replace reserves and sustain production over the longer term.
2025 may have been a record production year for the Gulf; we’ll find out at the end of this week. However, that level of production is not sustainable without increased drilling activity.
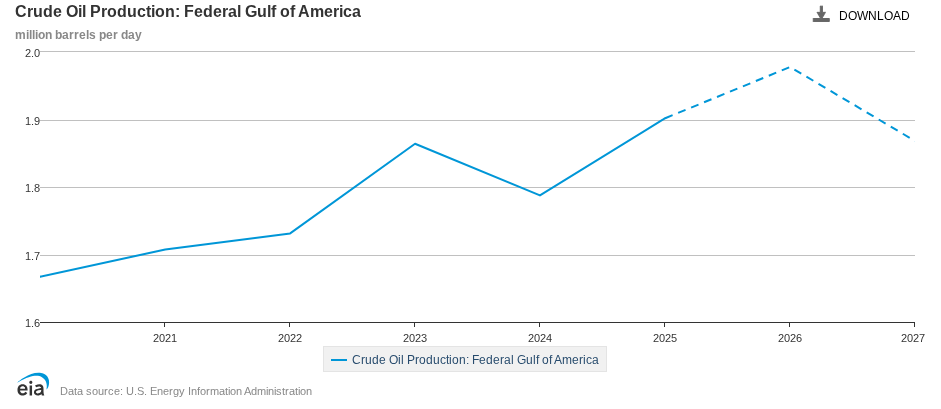
The EIA (chart below) is forecasting another banner year for Gulf oil production in 2026. However, they are pointing to a decline in 2027, when new production is not anticipated to be sufficient to offset natural declines. The decline in production is likely to continue beyond 2027 absent increased drilling.
BH rig count criteria: To be counted as active a rig must be on location and be drilling or ‘turning to the right’ for 4 out of 7 days during a week. A rig is considered active from the moment the well is ‘spudded’ until it reaches target depth or “TD”. Rigs that are in transit, rigging up, or being used in non-drilling activities such as workovers, completions, or production testing, are NOT counted as active.
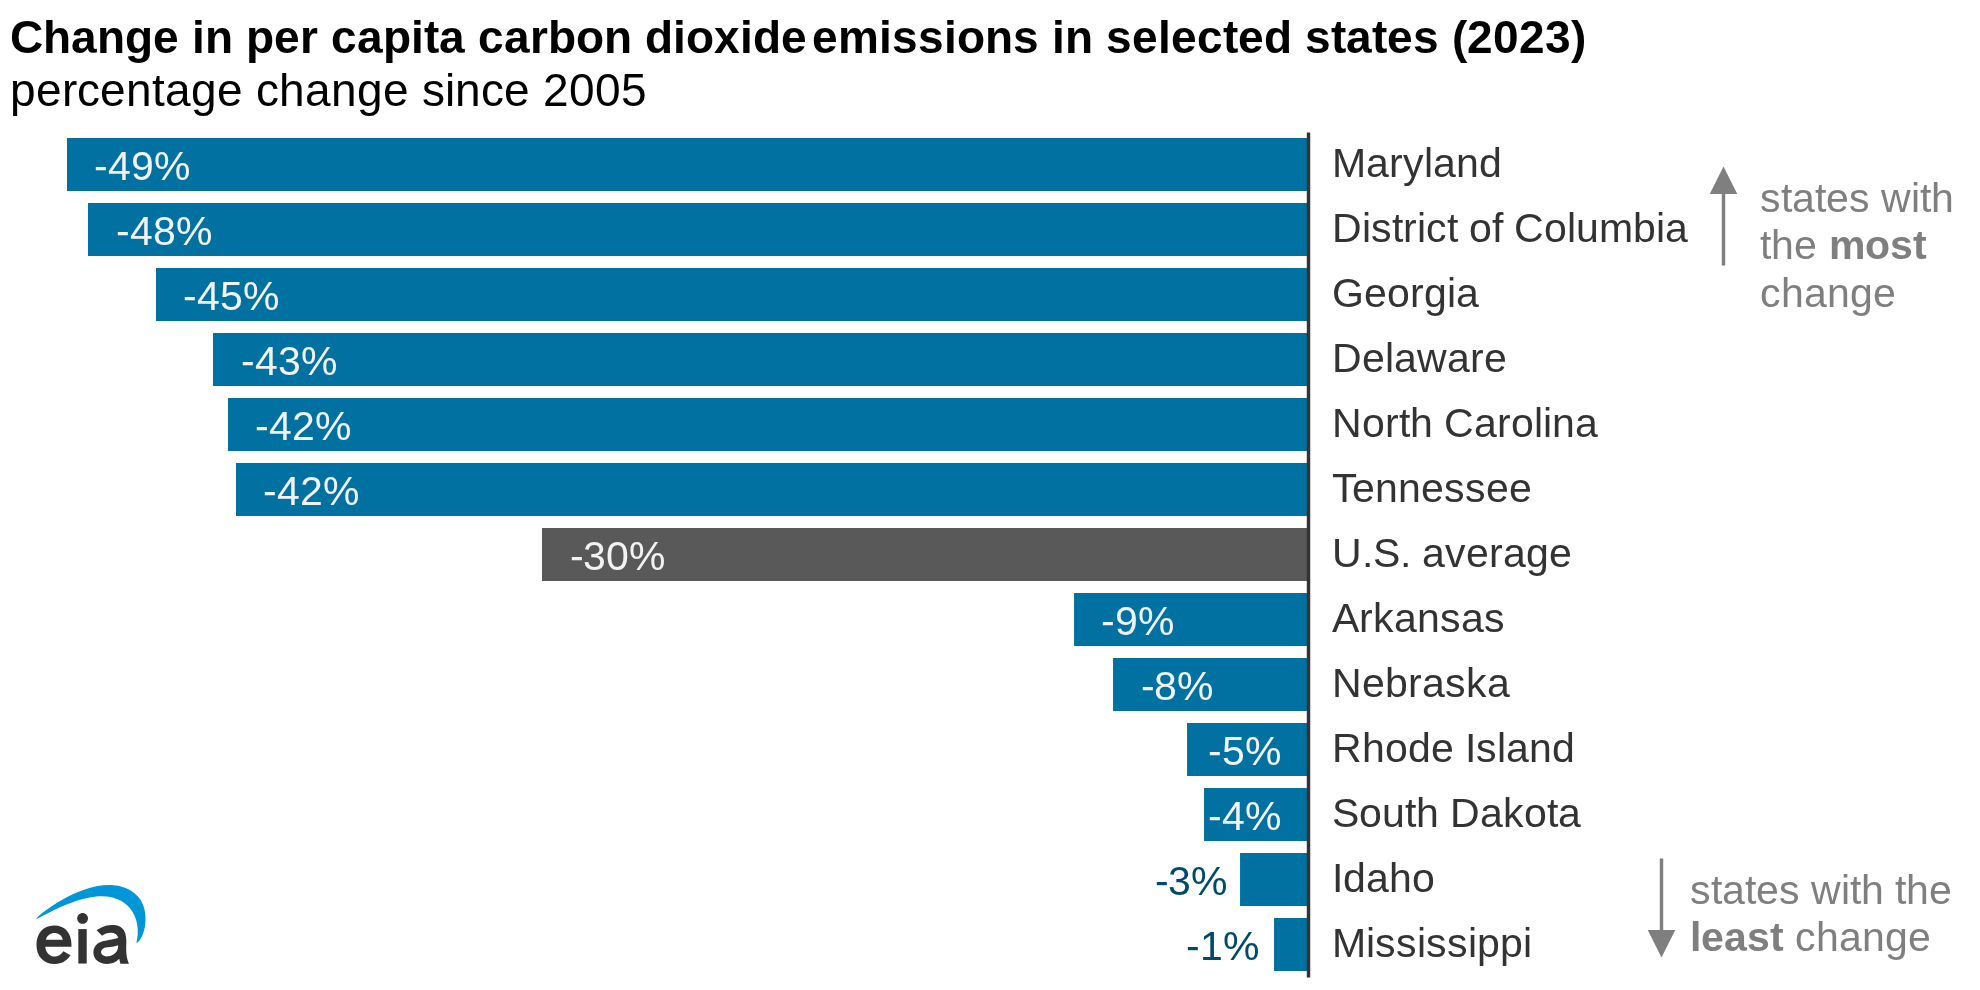
EIA:Per capita CO2 emissions from primary energy consumption decreased in every state from 2005 to 2023, according to recently released data in our State Energy Data System. Total energy-related CO2 emissions in the United States fell 20% over that time, and the population grew by 14%, leading to a 30% decrease in per capita CO2 emissions.
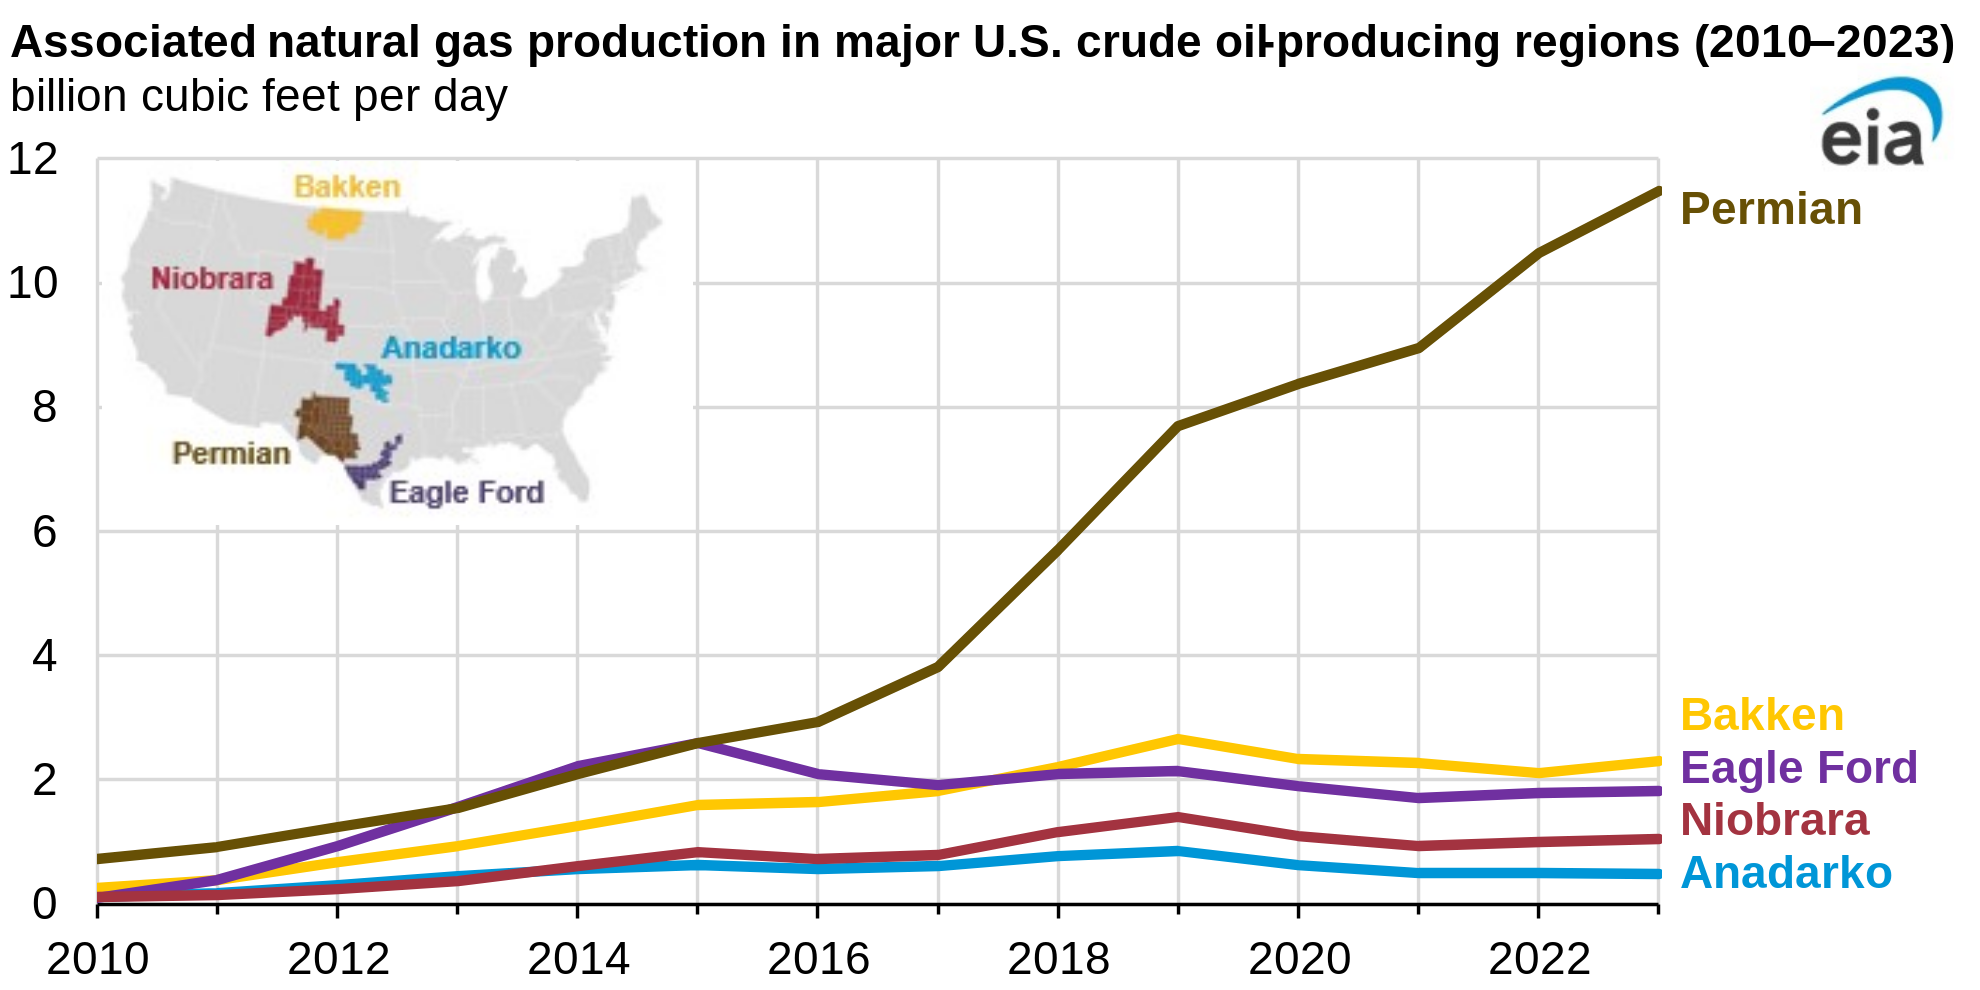
The EIA reports an 8% increase in 2023 US associated gas production as crude oil production rose to record levels. The Permian Basin, the dominant US crude oil producer, is unsurprisingly the leading associated gas producer.
EIA’s analysis inexplicably ignores the Gulf of Mexico OCS. The Gulf produced an average of 1.64 bcf/d of casinghead (associated) gas in 2023, ranking the GoM just behind the Eagle Ford and significantly above the Niobrara and Anadarko regions (see chart above). It’s also noteworthy that most production from the regions on the EIA chart is from private land, and is not constrained by 5 year leasing plans and other restrictive Federal policies.
80% of GoM gas production is from deepwater leases. The % of associated gas produced on deepwater leases is even higher. The 2 leading GoM gas producers, Shell and bp, only operate deepwater leases. The % of their 2023 gas production that was associated gas was 93% for Shell and 100% for bp.