Feeds:
Posts
Comments

Posts Tagged ‘2025 vs. 2019’

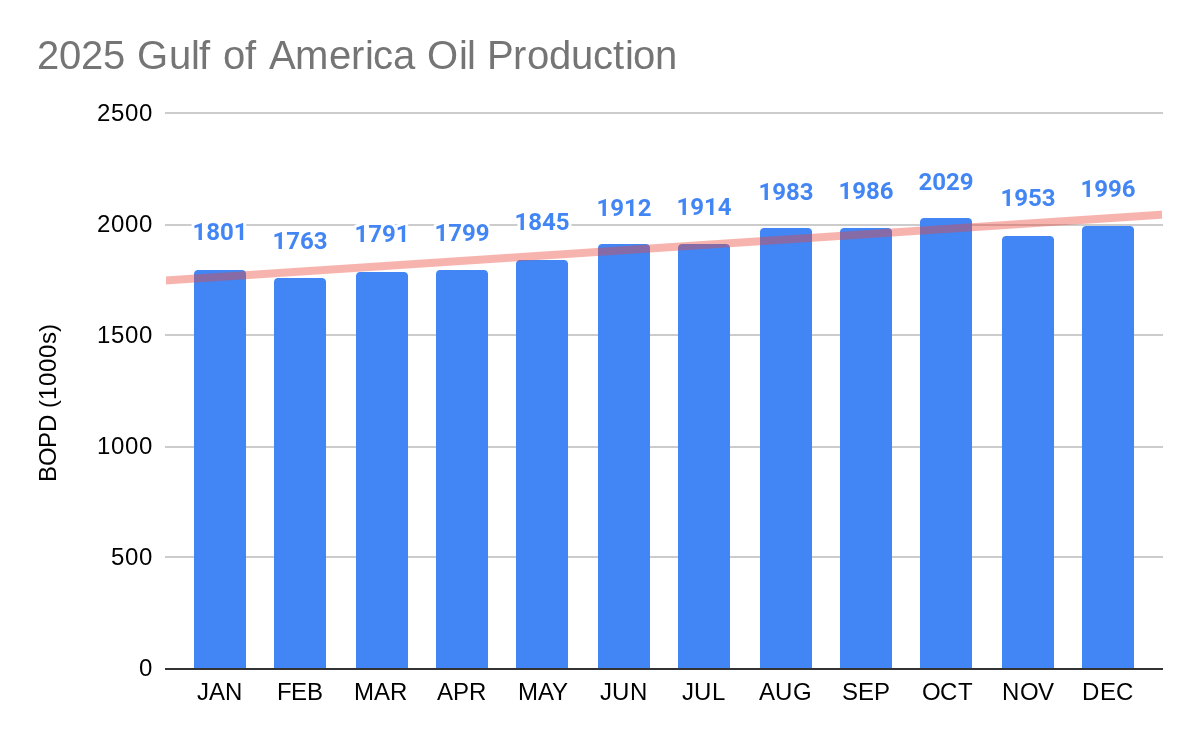
Update: Another EIA revision to Gulf of America oil production for Dec. 2025 (1.994 to 1.985 million bopd) means that 2019 retains the production record by the narrowest of margins – 1.898 to 1.897 million bopd. Stay tuned because this may not be the final word πŸ˜‰.

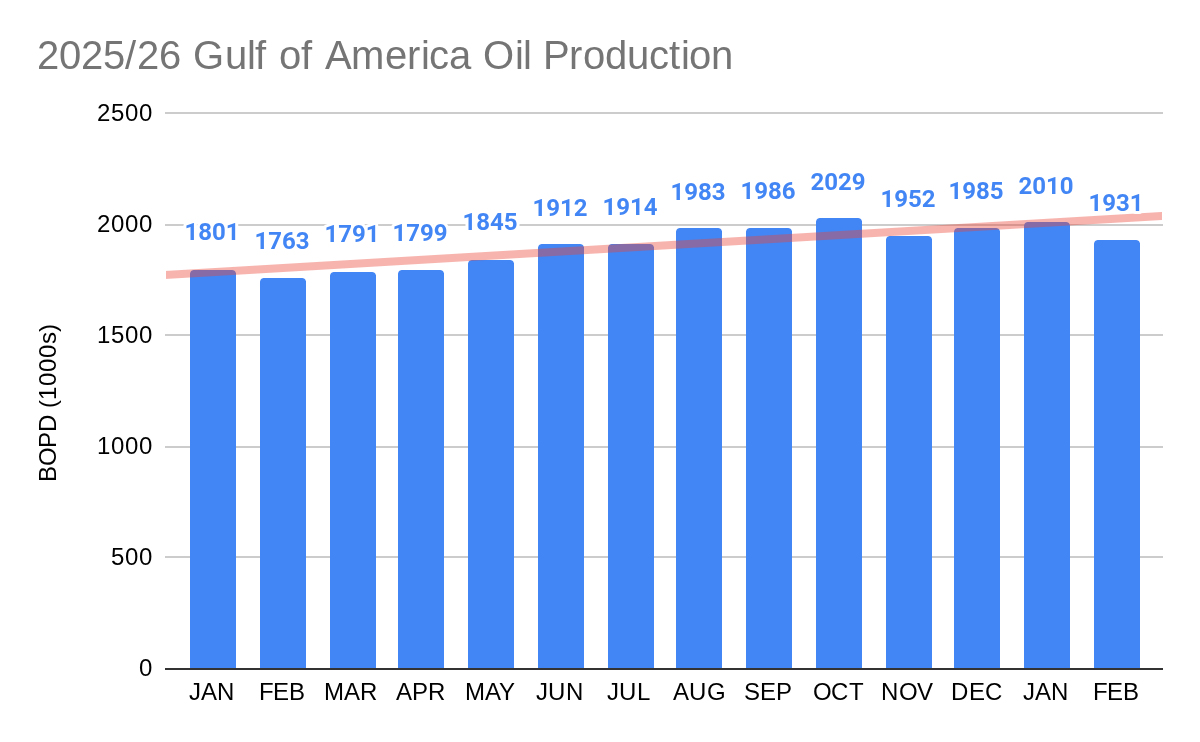
Per EIA, Feb. 2026 production dipped a bit to 1.931 million bopd (chart below).
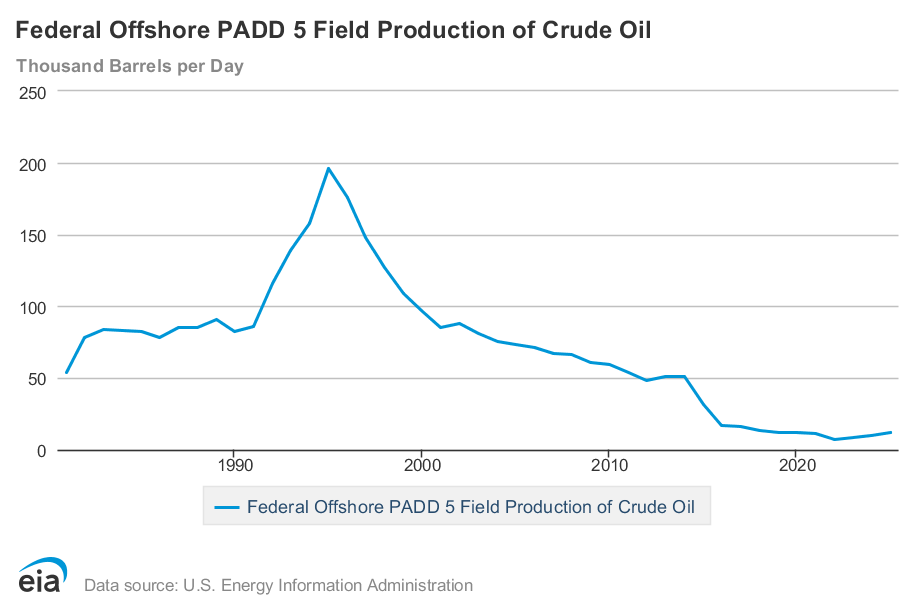
Meanwhile,Β California OCS oil production for FEB continued at about 10,000 bopd. This number may increase a bit for March, and more for April data when the first Sable sales are included. A big increase, by as much as 500%, should be apparent in the June report barring a court ordered shutdown.

Read Full Post »

The EIA has revised Gulf of America oil production slightly downward for Nov. and Dec. such that we now have an absolute dead heat between 2025 and 2019. Production for both years averaged exactly 1.898 million bbls/day.

Because of the ~6 month lag in obtaining verified OCS production data from the Office of Natural Resources Revenue (ONRR), the monthly EIA reports are based on ONRR’s more timely sales of production data. The final sales and production numbers are typically very close. For the 2019 record OCS production year, both the EIA and ONRR report identical Gulf production of 1.898 million bopd.

Meanwhile, 2026 Gulf production (chart below) is off to a strong start – 2.019 million bopd in January. This is the third highest monthly oil production in the history of Gulf operations.

Finally, California OCS oil production, which has been hobbling along at ~10,000 bopd (2nd chart) will see a massive increase of up to 500% should Santa Ynez Unit production continue.

Read Full Post »

December 2025 Gulf oil production had to average 1.993 million bopd for 2025 to match the 2019 record. It exceeded that mark by 0.003 million bopd. However, October and November production were revised slightly downward resulting in a near dead heat annual average.

A closer look at the numbers (table below) shows that 2025 edged 2019 by a mere 250 bopd. Amazing!

Major caveat: The Nov and Dec 2025 figures will likely be revised slightly when EIA releases the next update at the end of January. Fingers crossed!πŸ˜€

Top 3 Yearsave. daily production (1000’s of barrels)
20251897.67
20191897.42
20231864

Read Full Post »