Minimizing flaring and venting is important from both environmental and resource conservation standpoints. Flaring and venting volumes are also good indicators of how well production systems are designed, managed, and maintained.
Updated flaring and venting volumes for the Gulf of America have been compiled using monthly data submitted to the Office of Natural Resources Revenue (ONRR). This is the best data source because reporting is mandatory and strictly enforced, and flaring and venting are accounted for separately.
Below are a few summary charts. Completed tables, similar to those posted for 2024, will be attached for sharing at a later date.
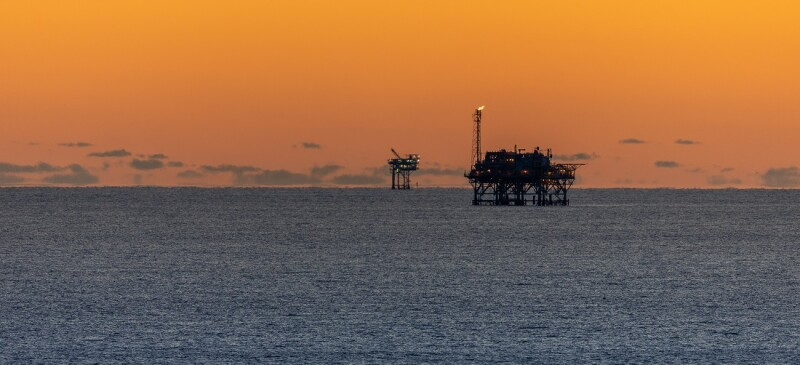
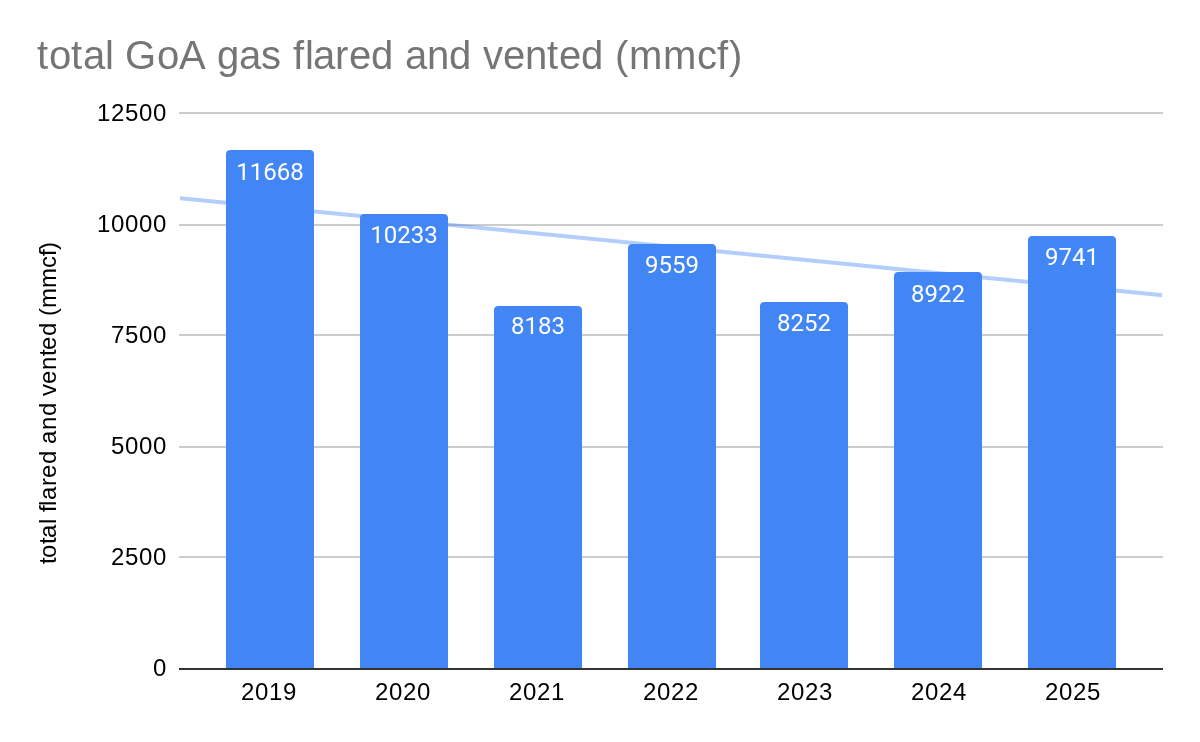
Total venting and flaring (fig. 1) in 2025 increased by 819 million cubic feet (mmcf) vs. 2024. However, the 7-year trend line is still favorable. Thinking that 2019, a record flaring year, may have biased the trend line, I extended the chart back to 2015, the first year for which I have ONRR data. As you can see in the second chart, the trend is still favorable.
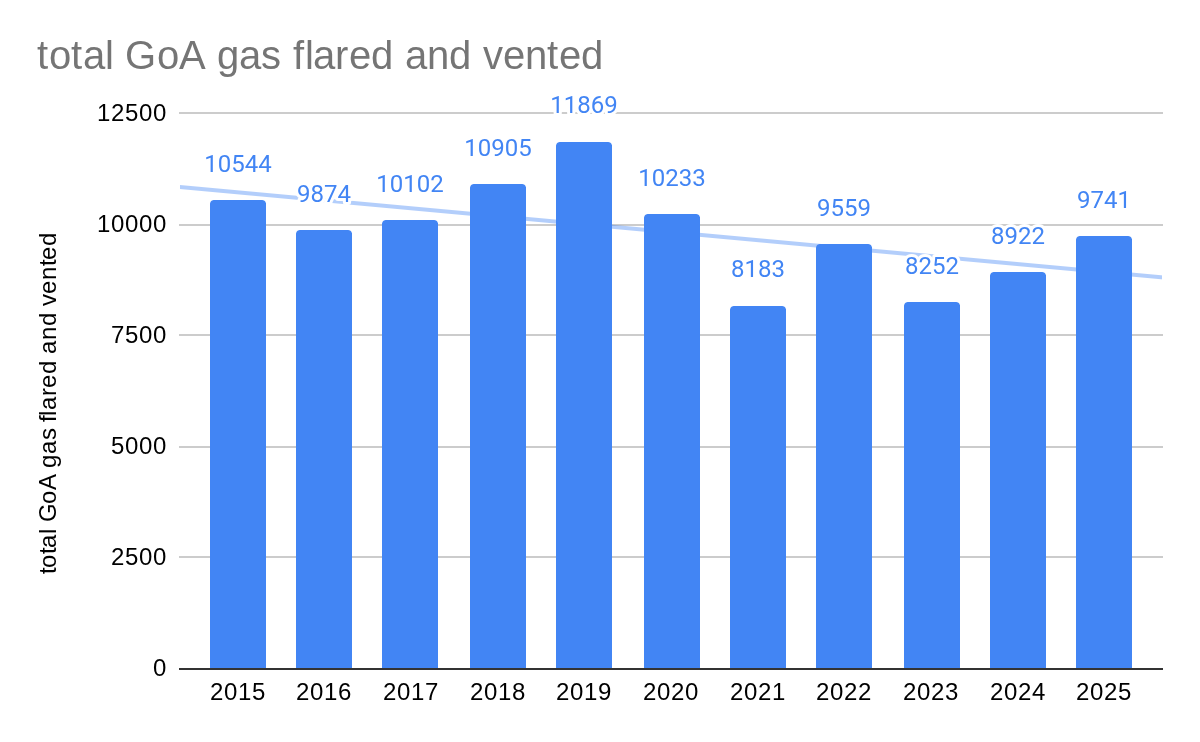
80% (7785 mmcf) of the total gas flared and vented in 2025 (9741 mmcf) was flared from oil wells (chart below). That’s unsurprising given that most of the Gulf’s gas production is from deepwater oil wells, and flaring rates are higher for oil wells than for gas wells.
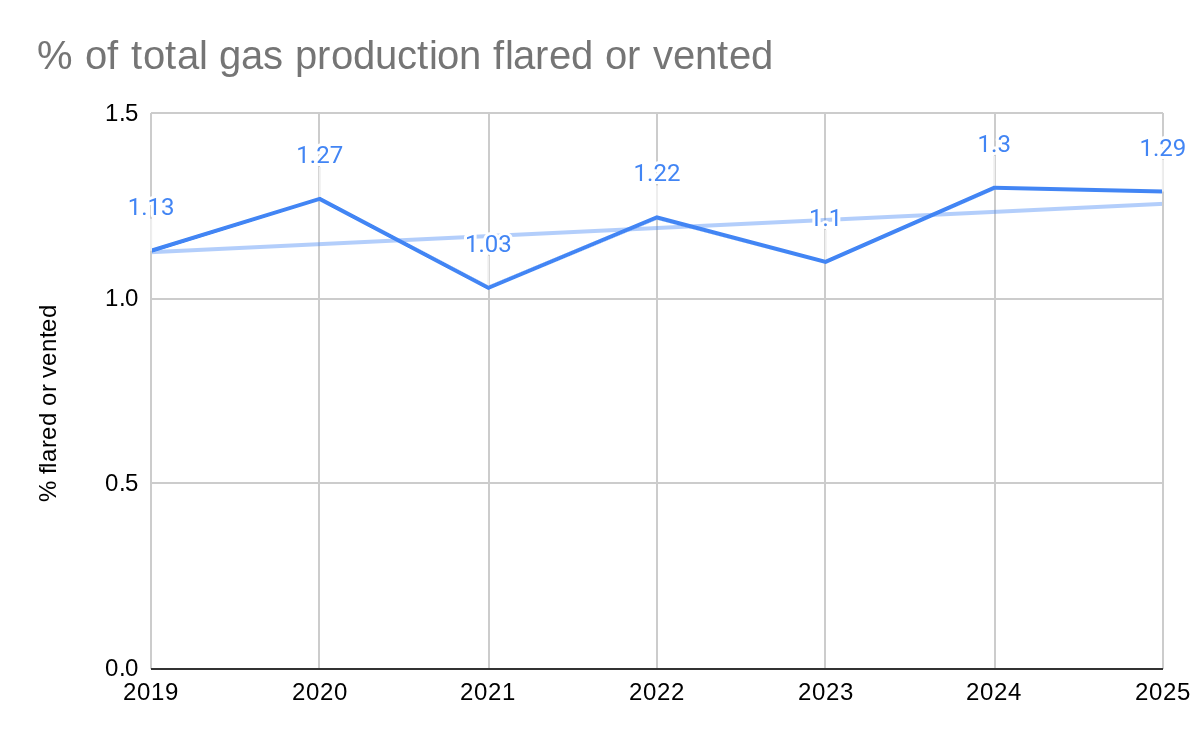
The best performance indicators are the normalized data (i.e. percentages of produced gas that are flared and vented both for oil wells and gas wells). Overall (chart below), flaring and venting volumes remain stubbornly above 1.0% of total gas production, the historical target last achieved in 2015. I’ll separate venting and flaring for both oil and gas wells in a future post.

Leave a comment