Kudos to offshore-energy.biz for drawing attention to the recent Coast Guard medevacs from the pipelay vessel Solitaire. Three health-related medevacs from the same facility in <2 months would seem to warrant further scrutiny. Will the Coast Guard investigate?
The only timely information on medevacs is from Coast Guard news releases. Information on private medevacs is seldom provided, except as included in the BSEE incident tables, which are typically more than 1 year behind, and update presentations by BSEE’s Gulf of Mexico region.
Below is information on 2023 YTD Coast Guard medevacs associated with Gulf of Mexico oil and gas activities. As previously posted, at least 12 workers died at OCS facilities in 2021-22 of natural causes. Unfortunately, “natural cause” fatalities and illnesses receive little industry or regulator attention.
date
vessel or platform
description
condition report
5/18
OSV Brandon Bordelon
50-year-old male crewmember with an injury to his leg
stable
5/17
Allseas’ pipelay vessel Solitaire
65-year-old male crewmember was experiencing heart attack-like symptoms
stable
4/26
crew boat Mr. Fred
halted search for missing crewmember
presumed dead
4/23
Allseas’ pipelay vessel Solitaire
32-year-old male crewmember experiencing severe abdominal pain.
stable
3/22
Allseas’ pipelay vessel Solitaire
crewmember was experiencing seizure-like symptoms
stable
3/18
BP’s Atlantis platform
28 year old male, eye injury
stable
3/13
unidentified platform 40 miles south of Port Fourchon
Per the BSEE borehole file, there were 2 deepwater exploratory well starts since 4/1/2023. The Shell well is another GoM milestone in that it is the 150th well spudded in >8000′ of water. The first was in the year 2000.
Operator
spud date
location
water depth
Chevron
5/5/2023
Mississippi Canyon 608
6678′
Shell
4/13/2023
Alaminos Canyon 728
8660′
Arena and Cantium continue to drive shelf drilling. Below are the shelf development wells since 4/1/2023:
Regulatory fragmentation occurs when multiple federal agencies oversee a single issue. Using the full text of the Federal Register, the government’s official daily publication, we provide the first systematic evidence on the extent and costs of regulatory fragmentation. We find that fragmentation increases the firm’s costs while lowering its productivity, profitability, and growth. Moreover, it deters entry into an industry. These effects arise from regulatory redundancy and, more prominently, regulatory inconsistency between agencies. Our results uncover a new source of regulatory burden: companies pay a substantial economic price when regulatory oversight is fragmented across multiple government agencies.
The US has a highly fragmented offshore regulatory regime that has become even more fragmented with the complex division of responsibilities between BOEM and BSEE. The slide below is from a presentation on this topic.
While the linked paper focuses on costs and productivity, fragmentation may also be a significant safety risk factor. A UK colleague once asseted that “overlap is underlap,” and I believe there is something to that. If multiple agencies have jurisdiction over a facility, system, or procedure, the resulting redundancy, inconsistency, and ambiguity may create significant gaps in industry and governmental oversight.
For example, regulatory fragmentation was arguably a significant factor in the most fatal US offshore fire/explosion incidents in the past 35 years – the South Pass B fire in 1989 and the Macondo blowout in 2010. More specifically:
South Pass 60 B: The investigation of the 1989 South Pass 60 B platform explosion that killed 7 workers noted the inconsistency in regulatory practices for the platform, regulated by DOI, and the pipeline regulated by DOT. Cutting into the 18-inch pipeline riser did not require an approved procedure, and the risks associated with hydrocarbon pockets in the undulating pipeline were not carefully assessed. Oversight by the pipeline operator was minimal, and the contractor began cutting into the riser without first determining its contents. A massive explosion occurred and 7 lives were lost.
One would hope that this major spill will lead to an independent review of the regulatory regime for offshore pipelines. Consideration should be given to designating a single regulator that is responsible and accountable for offshore pipeline safety (a joint authority approach might also merit consideration) and developing a single set of clear and consistent regulations.
Macondo: While the root causes of the Macondo blowout involved well planning and construction decisions regarding the casing point, cementing of the production casing, and well suspension procedure, the blowout would likely have been at least partially mitigated (and lives saved) if the gas detection system was fully operable, the emergency disconnect sequence was activated in a timely manner, flow was automatically diverted overboard, or engine overspeed devices functioned properly. Indeed, regulatory overlap led to underlap as summarized below:
Macondo contributing factor
jurisdiction
flow not automatically diverted overboard
DOI/USCG (also concerns about EPA discharge violations)
some gas detectors were inoperable
DOI/USCG
generators did not automatically shutdown when gas was detected
USCG/DOI
failure to activate emergency disconnect sequence in a timely manner (training deficiencies and chain-of-command complications)
USCG/DOI
engine overspeed devices did not function
USCG/DOI
hazardous area classification shortcomings
USCG/DOI
MOUs and MOAs are seldom effective regulatory solutions as they are often unclear or inconclusive, and tend to be more about the interests of the regulator and protecting turf. They also do nothing to ensure a consistent commitment among the regulators. In the case of the US OCS program, BOEM-BSEE have a greater stake in the safety and environmental outcomes given that offshore energy is the reason for their existence. That is not the case for any of the other regulators identified in the graphic above.
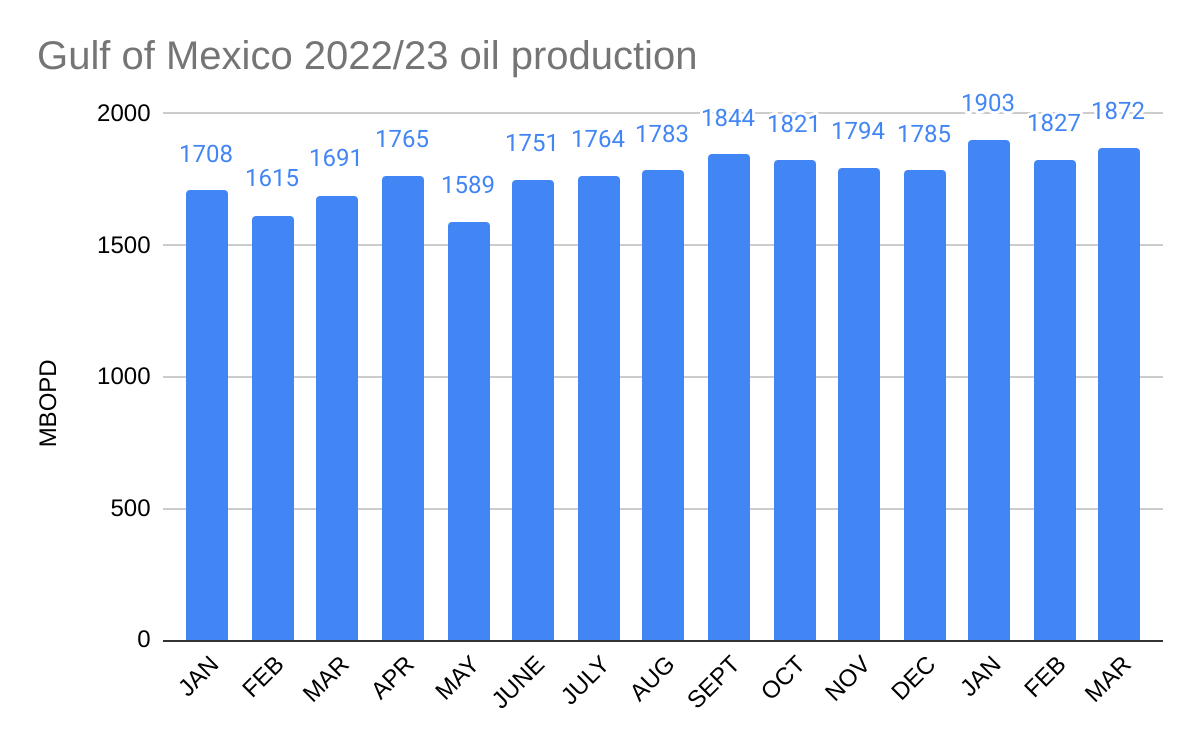
Exploration and development have improved dramatically over the past 100 years, and have become much more efficient. Only 57 platforms are producing about 1.7 million barrels/day in the deepwater Gulf of Mexico. Still work to do and continuous improvement must always be the objective.
Perdido Platform, Gulf of Mexico, 7835′ water depth, 320km south of Freeport, Texas
The data in the paper appear to be reasonably accurate. However, there is one glaring error regarding Pacific operations, and the reference to the Macondo blowout in the environmental discussion is rather provocative and misleading.
Per the authors:
California wells are drilled in relatively shallow water—mostly less than 100 feet—while GoM wells can be in up to 10,000 feet of water.
With regard to the environmental risks, the Nature Energy paper’s reference to the Macondo blowout, while muted, is what some media outlets embraced. Per the authors:
Releases from improperly abandoned wells will probably be chronic and small compared with Macondo, but the underlying biochemical and ecological processes that influence the ecological impacts have many similarities.
The Macondo well blew out while it was being suspended in preparation for subsequent completion operations. Ill advised changes to the well suspension plan were among the primary contributing factors to the blowout (see diagram below). The Macondo well was entirely different from the depleted end-of-life wells that are the subject of the paper.
Some media outlets ran with the Macondo angle, weak as it was. This ABC news piece featured numerous Macondo pictures. Other outlets noted that Macondo was a temporarily abandoned well, which it was not. The Macondo well never got to that point.
National Commission, Chief Counsel’s Report, p. 132
Dr. Malcolm Sharples, a leading marine engineer and offshore safety advocate, brought this Supreme Court’s decision and the resulting regulatory confusion to my attention.
has created regulatory uncertainty for floating production facilities like this:
In a 7-2 decision, the court ruled that a gray, two-story home that its owner said was permanently moored to a Riviera Beach, Florida, marina was not a vessel, depriving the city of power under U.S. maritime law to seize and destroy it.
The floating production facilities are still subject to Coast Guard regulation and inspection pursuant to separate authority under the OCS Lands Act. The extent to which Coast Guard approval and inspection practices will change is not entirely clear. The Coast Guard will issue new certificates of inspection for these floating facilities, and new policy guidance is being developed.
Attached are answers that the Coast Guard provided to questions from the Offshore Operators Committee.
Meanwhile, challenges to Cook Inlet Sale 258 (humble as it was with only one bid) and GoM Sale 259 continue. It’s a great country (if you like endless litigation)!
In addition to Lease Sale 257, the IRA also required Interior to offer three other lease sales in Alaska and the Gulf that it previously declined to hold. Lease Sale 258, in Alaska’s Cook Inlet, was held in December but received only one bid. Earthjustice is challenging that sale. Earthjustice is also challenging Lease Sale 259, in the Gulf of Mexico, which was held in March. Lease Sale 261, also in the Gulf, will be held by September of this year.
According to EIA data for 2001-2021, Gulf of Mexico flaring and venting volumes peaked in 2001 at 21.6 bcf, 2.25 times the volume flared or vented in 2022 (ONRR data for 2022). However, gas production in 2001 was 5.05 tcf, 6.4 times higher than in 2022. The % of the produced gas that was flared or vented in 2001 was thus 0.4%, less than 1/3 the 2022 rate of 1.22%.
Points to consider:
In 2001, gas production was mostly from gas wells, which have lower flaring/venting rates. As gas production declined because of lower gas-well gas (GWG) production, flaring/venting rates increased (see the chart below). This would account for some of the difference in flaring/venting rates (2001 vs. 2022). However, in recent years, the % of gas-well gas flared or vented has been between 0.3 and 0.5% which is comparable to the rate for all gas production (0.4%) in 2001. So the reduction in GWG production is not the entire reason for the higher flaring/venting rates in recent years. Hence the need for more transparency on flaring/venting performance.
Oil-well gas (OWG) production alone in 2001 (923 bcf) was higher than total gas production (784 bcf) in 2022. If the oil-well gas (OWG) flaring/venting rate was the same as the recent rate for OWG (1.2-1.5%), the volume of gas flared or vented from OWG alone (only 18% of total gas production in 2001) would have accounted for 11.1 – 13.8 bcf or 51-64% of the total volume flared/vented in 2001.
A very large increase in OWG flaring in December skewed the 2022 data (921 million cu ft vs 522 million in November, see 2nd chart below). OWG vented and gas-well gas (GWG) vented also spiked in December (third chart). Were these spikes associated with production startups, major compressor issues, administrative/accounting corrections, or other issues?
Although total venting increased by 407 million cu ft (21%) in 2023 vs. 2022, the overall venting trend is still favorable (last chart).
Kudos to ONRR for posting the flaring/venting data.
More regulator/industry transparency on flaring episodes is needed, particularly in light of the PNAS paper and the June 2022 Inspector General Report.