Unsurprisingly, Orsted management assumes no responsibility for the company’s poor performance, blaming supply chain problems, high interest rates and “a lack of new tax credits.” Outsiders might suggest that there were other factors such as irrational exuberance in the acquisition of wind leases at inflated prices, and unrealistic expectations regarding a complementary power source that is dependent on government mandates and subsidies.
“The situation in U.S. offshore wind is severe,” Chief Executive Mads Nipper told reporters on a conference call.
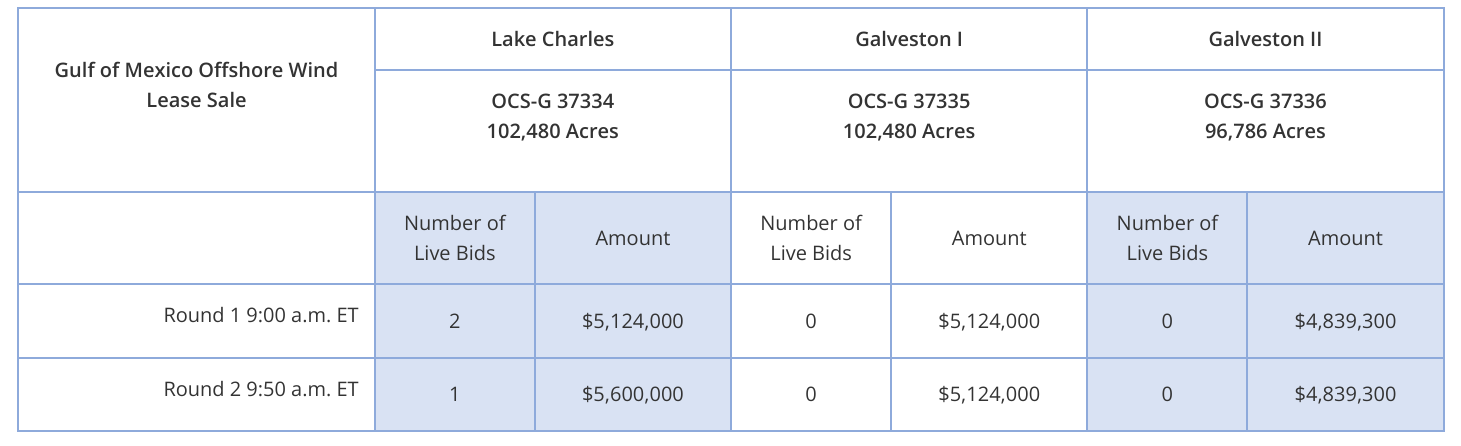
Only 1 of the 3 tracts was sold, and the amount bid was a modest $5.6 million. Given the extensive lease sale planning and promotion, this would seem to be a rather embarrassing outcome.
RWE Offshore US Gulf LLC won the Lake Charles tract. Neither of the 2 Galveston tracts received bids. RWE’s headquarters are located in Essen, Germany.
From a regulatory policy standpoint, this appears to be a strong filing. Operationally, the most important points pertain to the costly and premature Rice’s whale restrictions first discussed on this blog.
Most notably, the plaintiffs seek (p.39):
A preliminary and permanent injunction striking, setting aside, and enjoining BOEM from implementing the specific challenged provisions of the Final Notice of Sale and Record of Decision for Lease Sale 261;
An order vacating the specific challenged provisions of the Final Notice of Sale and Record of Decision for Lease Sale 261;
An order compelling Defendants to proceed with Lease Sale 261 on September 27, 2023, without the challenged provisions;
The expanded Rice’s whale area is based on a single 2022 study that concluded that Rice’s whales were “the most plausible explanation” for moan calls observed in the northwest GoM shelf break area. No Brice’s whales were sighted in the expanded area during this study. Is this sufficient basis for restrictions that threaten operations that are critical to our economy?
Stipulations are part of the lease contract and can be difficult to modify, even when the lessor and lessee are in agreement.
Why not rely on voluntary measures until further studies have been completed? The offshore industry has a good record of cooperation with the government to protect sensitive biological resources. The Flower Garden Banks is a good example of such cooperation.
In addition to the lease stipulation, the entire expanded Brice’s whale area has been excluded from the lease sale. Senator Manchin strongly criticized that decision:
Let me be clear, the exclusion of more than 6 million productive acres from the upcoming offshore oil and gas lease sale in the Gulf of Mexico based on a settlement reached in the name of protecting Rice’s whale while conveniently only targeting oil and gas is yet another example of this Administration’s intentional undermining of the strong energy security provisions in the Inflation Reduction Act.
Slide 13: “In 2022, the rate of occupational fatalities, reported for activities on facilities where BSEE has primary investigation authority, decreased to being near the historical national average of approximately 0.9 fatalities per 25,000 full time equivalent workers per year. However, considering all offshore risk factors, including helicopter transportation, diving, marine transfer, and COVID-19 exposures, the occupational fatality rate for all OCS activities has remained high since 2019.“
Slide 15: “In 2022, the TRIR for both production and construction operations increased to the highest levels recorded since 2010 and remained high even after discounting the impact of COVID-19 illnesses. The TRIR for drilling and well operations, however, remained near their historical lows.“
Comments:
These charts and tables are helpful for assessing trends.
The data raise concerns that merit further analysis. Absent the specific incident summaries, which have yet to be updated for 2022, it’s difficult to assess the nature and extent of the issues.
The parsing of fatality data according to regulatory jurisdiction adds to previously expressed concerns about regulatory fragmentation and its implications for offshore safety.
The latest International Regulators’ Forum country performance data are for 2020. The absence of regular, timely updates makes international comparisons difficult and limits the value of what is arguably the most important IRF workstream.
The attached comments were submitted to BOEM via Regulations.gov. The comments address specific provisions of the proposed rule and include a recommendation to hold companies fully accountable for their lease transfers, but not for subsequent transfers in which they are not a party.
Do I get a t-shirt for being one of the first 2000 entries? 😀
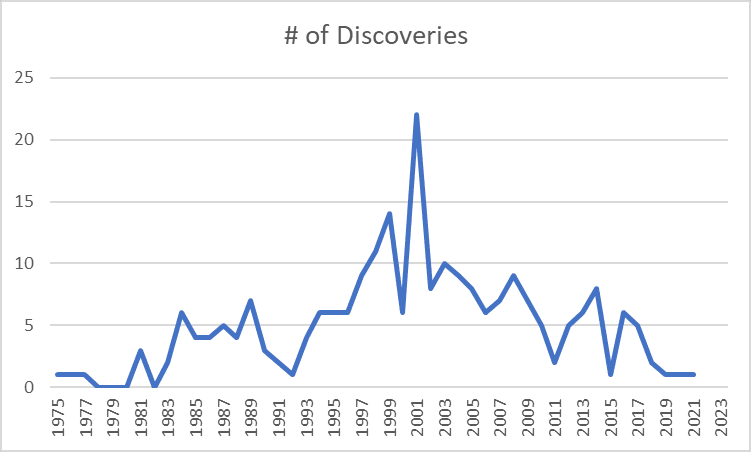
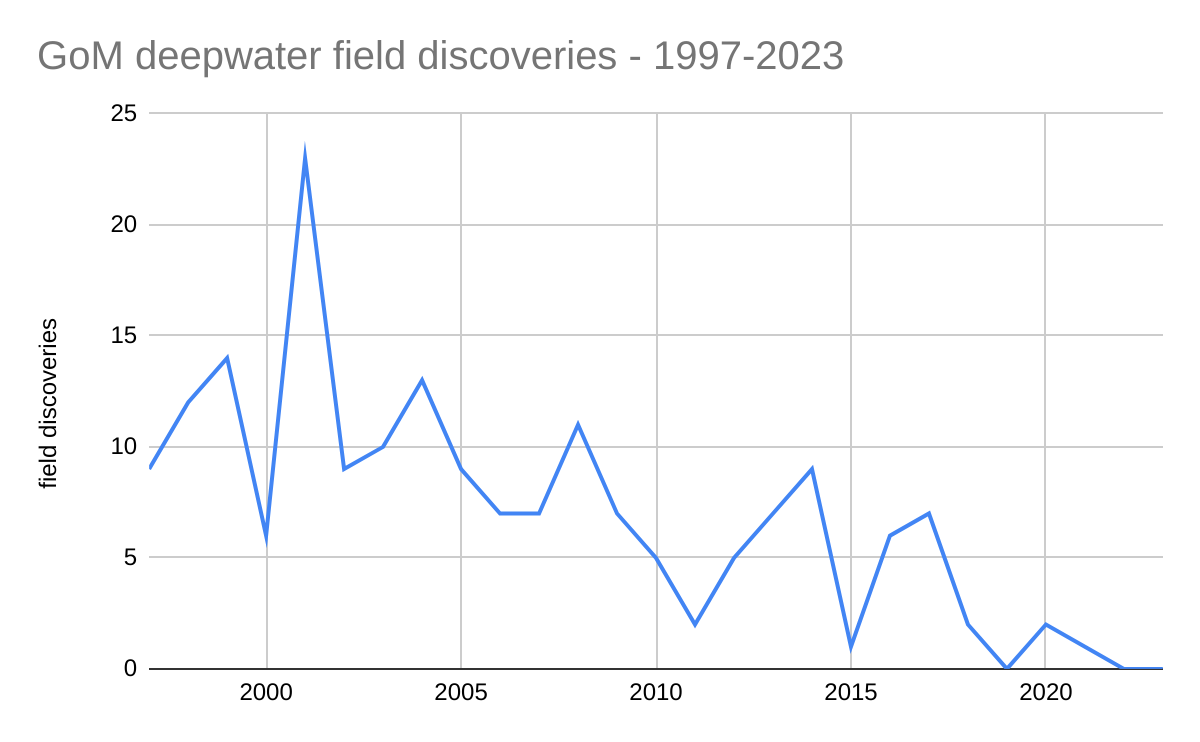
Per our previous post, “Ominous signs for the future of Gulf of Mexico production,” Lars Herbst has plotted (below) deepwater GoM field discoveries dating back to the early days of deepwater drilling operations.
These are official USGS, MMS, and BOEM data (depending on the era) for field discoveries in >1000′ of water. Note that the last discovery was in March 2021.
This is a discouraging graphic given that the deepwater GoM is currently the only option for significant new US offshore production.
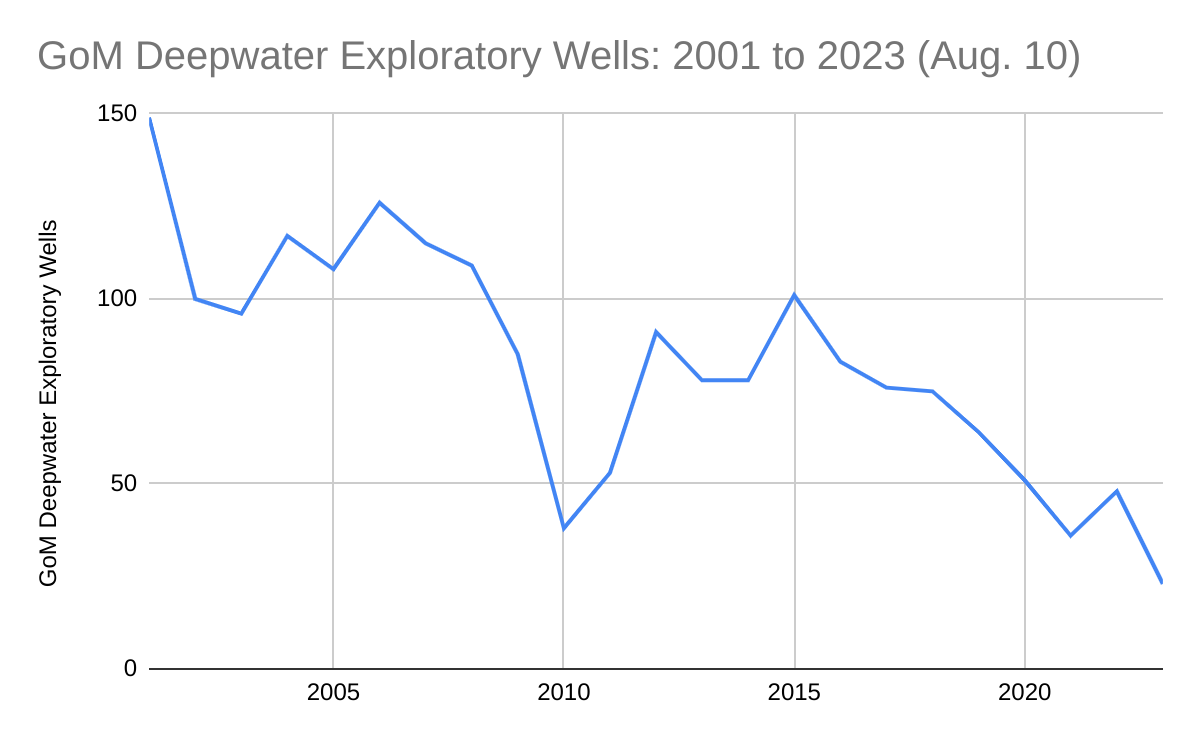
Record low exploratory drilling: 2023 will be the third consecutive year with fewer than 50 deepwater exploratory well starts. The only other year this century with <50 deepwater exploratory well starts was 2010 when there was a post-Macondo drilling moratorium.
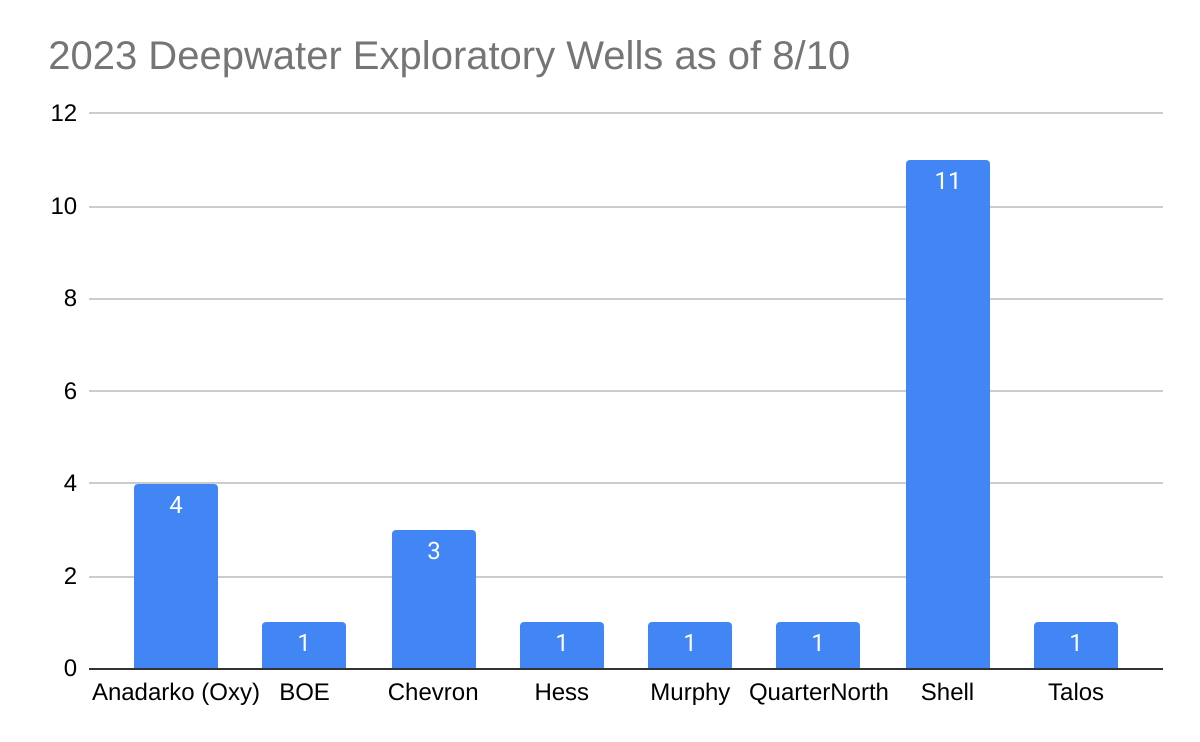
Low participation: Only 8 companies have started deepwater exploratory wells in 2023 YTD. Anadarko, Chevron, and Shell drilled 78% of the wells, with Shell alone accounting for 48%. Compare these numbers with 2001, when 24 companies drilled 149 deepwater exploratory wells.
Absence of new field discoveries: Per BOEM’s database, no deepwater fields have been discovered since March 2021 and there were only 3 discoveries in the past 5 years (see chart below)
Leasing and regulatory uncertainty: When will the 5 year leasing plan be finalized and how much will leasing be restricted? What will be the effect of the expanded Rice’s whale area on deepwater operations? To what extent is this expansion justified? What other legal and regulatory threats are on the horizon?
Unrealistic expectations regarding the “energy transition:” In a stunning introductory statement, the Proposed 5 Year Leasing Plan expressed concerns that new leases would produce too much oil and gas for too long. OPEC+ must love the way the US sanctions its own energy production, most notably the oil and gas resources of the OCS. More than 96% of the OCS is off-limits to oil and gas leasing, and the 5 year plan proposed to constrain leasing in the only areas that remain. The favored offshore wind program was intended to be a complement to, not a replacement for, the oil and gas program. Wind energy is limited by intermittency, space preemption, navigation, and wildlife protection concerns.
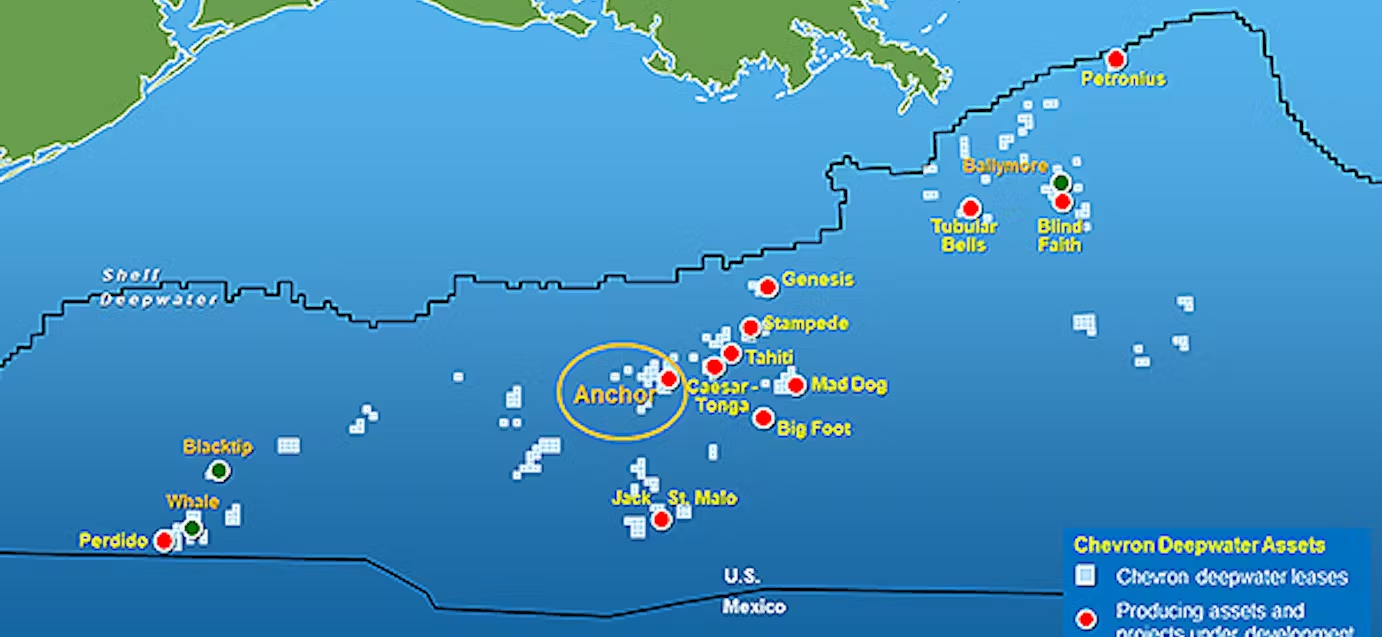
Some companies have visions of the GoM as a carbon dumping hub: The largest US oil company, which hasn’t drilled a well in the GoM in nearly 4 years and operates just one production platform, seeks praise and profit by sequestering CO2 beneath the Gulf while maximizing oil production elsewhere. How will this sustain economically and strategically important GoM oil and gas production?