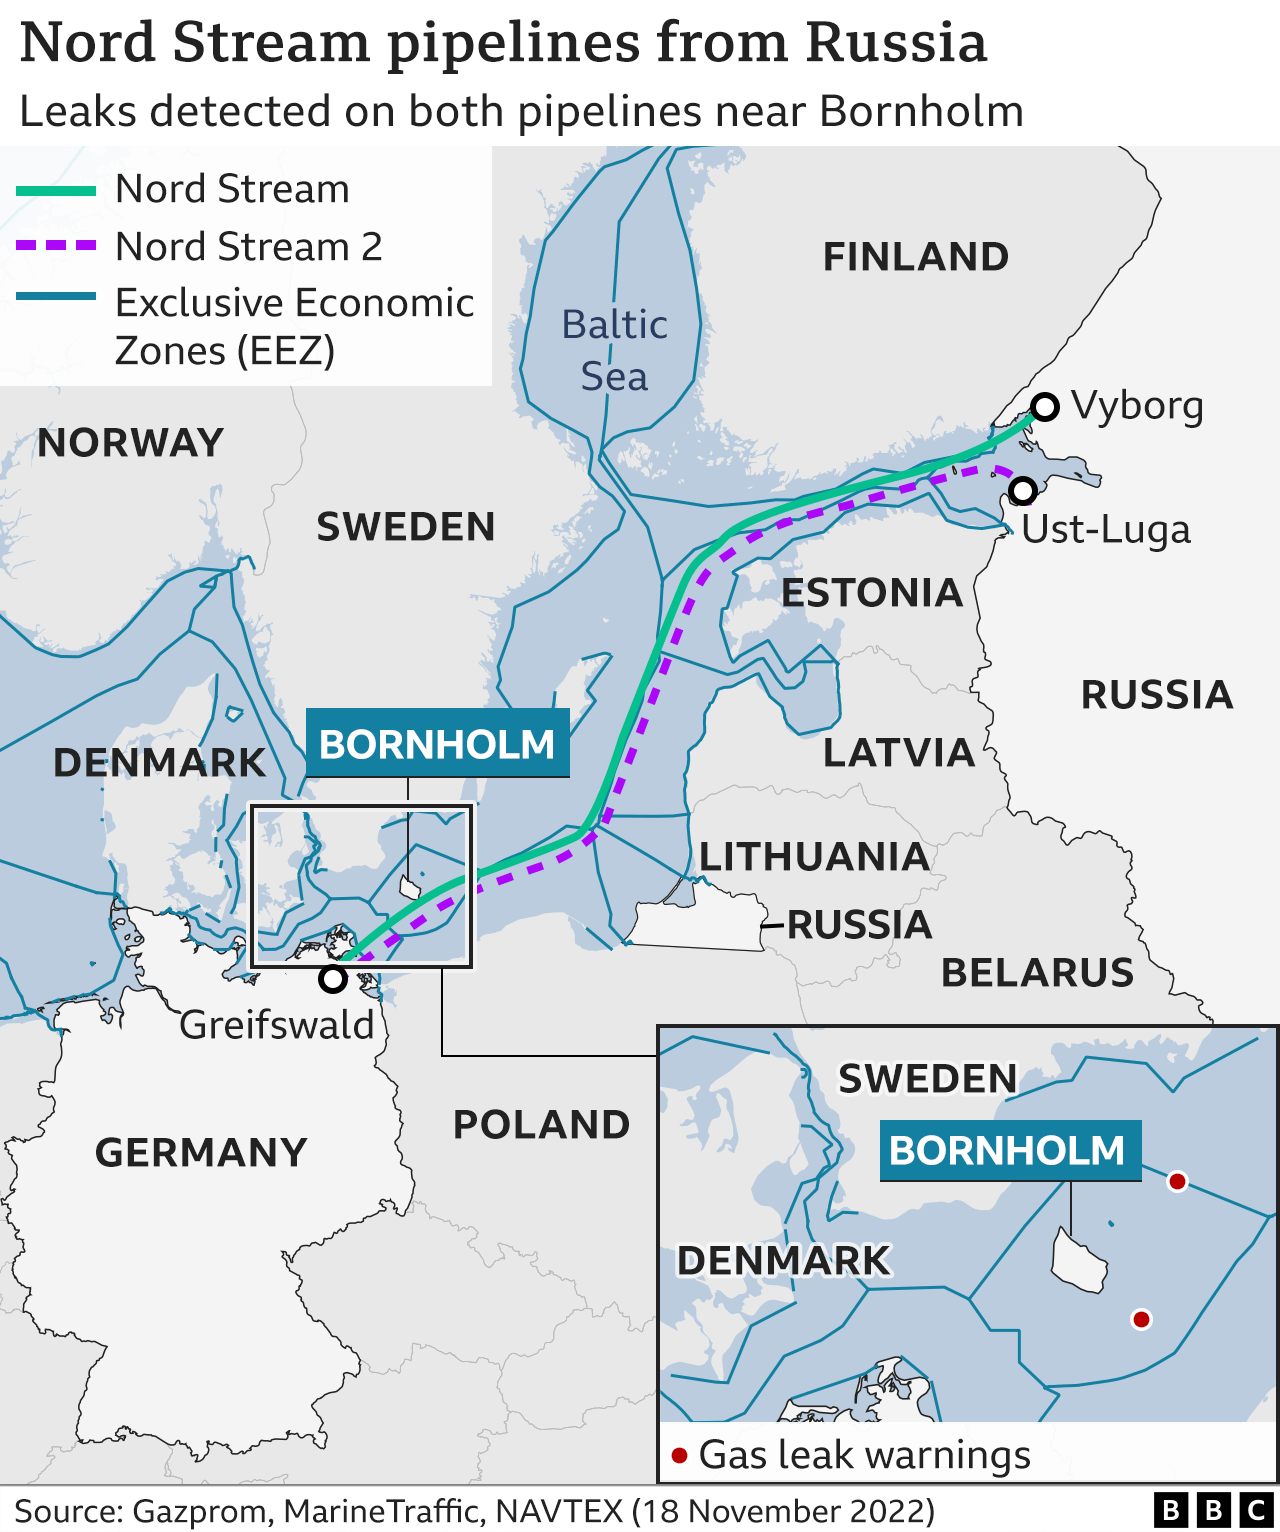
So at this time, some theories on the culprits appear to have dropped out. Those that are still in play include various versions of the Ukrainian rental yacht narrative and the Hersh account. Hopefully, the responsible parties will be identified, but given the political stakes, this is becoming increasingly unlikely.
This CBC story, which includes excellent video interviews, was brought to my attention by Newfoundlander Howard Pike, an engineer and offshore safety leader.
We know a lot about Rigs-to-Reefs, and the importance of active and reefed platforms in providing the habitat, shelter, and food that is necessary to increase biodiversity and productivity. However, the carbon reduction potential of artificial reefs has received little attention.
The linked CBC story is particularly interesting in that it includes interviews with artificial reef researchers who are assessing the carbon capture aspects. To date the results are encouraging:
As for the impact on climate change, the researchers say they have found some evidence that an artificial reef could hold more carbon compared to a natural reef.
The NOIA/ICF report is favorable from a Gulf of Mexico perspective, but 2 general caveats should be highlighted:
“The estimation of the production related GHG for various crude oils and condensates is a complex process that is hindered by lack of public, up-to-date, and high-quality data.“
“There is considerable controversy regarding certain critical data including quantity of gas flared, operational flare efficiencies, and the volumes of methane releases along oil and gas supply chains.”
Comments:
More work is needed to better determine cold venting volumes:
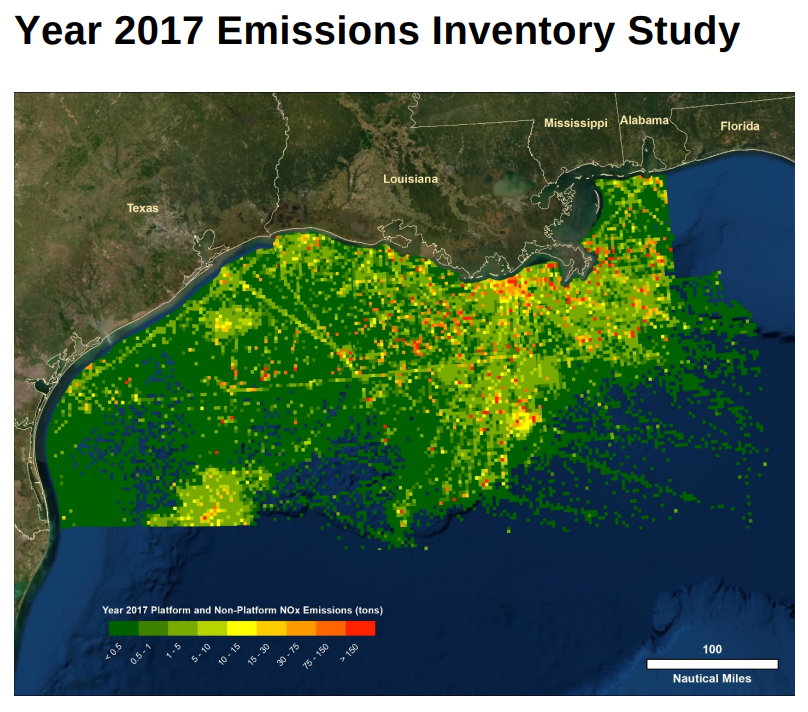
Table 7, p. 13, of the NOIA/ICF report indicates venting (methane) emissions of 71,200 metric tons/year for GoM operations. That number is aligned with the 2017 GOADS data (70,488 tons per Table 6-11, p. 112).
The recent PNAS report found that much more gas is being vented: 410,000 – 810,000 tons annually. If the PNAS findings are accurate, venting is being significantly underestimated and/or under-reported.
Per ICF, lower flaring and venting volumes are the main reason for the GoM’s lower GHG emission intensity, so data accuracy is important. The difference between the government data and the PNAS findings (see table below) should be carefully assessed.
The NOIA/ICF report did not distinguish between GoM deepwater and shelf emissions.
The PNAS report indicates much higher methane emissions intensity on the shelf, as do most subjective assessments.
Future studies should provide separate GHG intensity data for shelf and deepwater facilities.
All production cannot be from the lowest emission intensity sources. The objective should be to minimize emissions from each source, not to eliminate production.GoM shelf operations have other advantages, most notably the production of nonassociated natural gas.
The data in the paper appear to be reasonably accurate. However, there is one glaring error regarding Pacific operations, and the reference to the Macondo blowout in the environmental discussion is rather provocative and misleading.
Per the authors:
California wells are drilled in relatively shallow water—mostly less than 100 feet—while GoM wells can be in up to 10,000 feet of water.
With regard to the environmental risks, the Nature Energy paper’s reference to the Macondo blowout, while muted, is what some media outlets embraced. Per the authors:
Releases from improperly abandoned wells will probably be chronic and small compared with Macondo, but the underlying biochemical and ecological processes that influence the ecological impacts have many similarities.
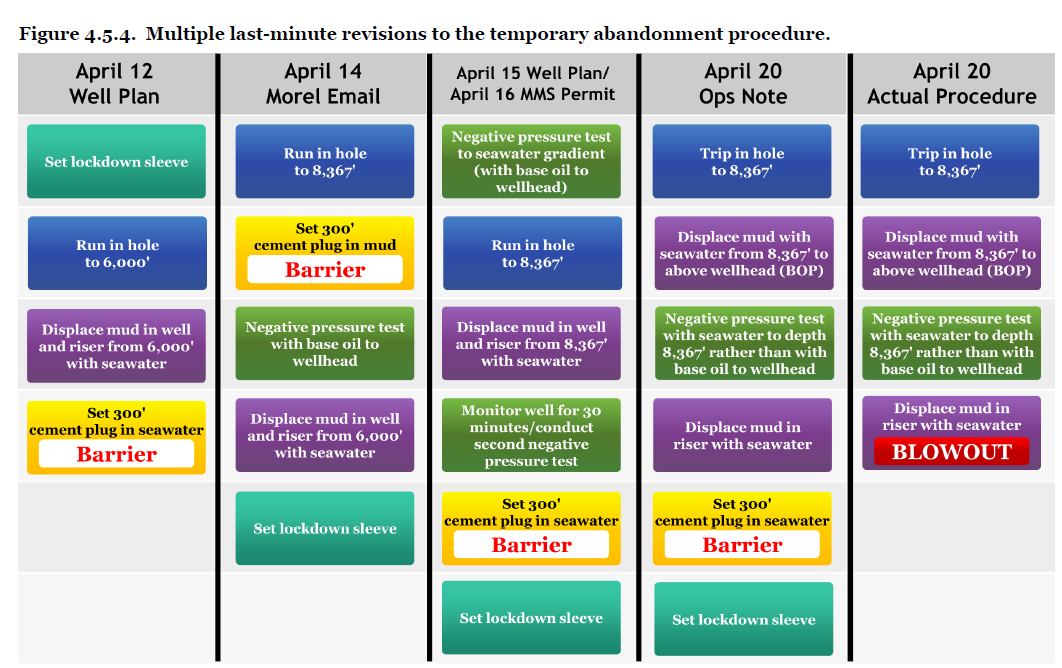
The Macondo well blew out while it was being suspended in preparation for subsequent completion operations. Ill advised changes to the well suspension plan were among the primary contributing factors to the blowout (see diagram below). The Macondo well was entirely different from the depleted end-of-life wells that are the subject of the paper.
Some media outlets ran with the Macondo angle, weak as it was. This ABC news piece featured numerous Macondo pictures. Other outlets noted that Macondo was a temporarily abandoned well, which it was not. The Macondo well never got to that point.
National Commission, Chief Counsel’s Report, p. 132
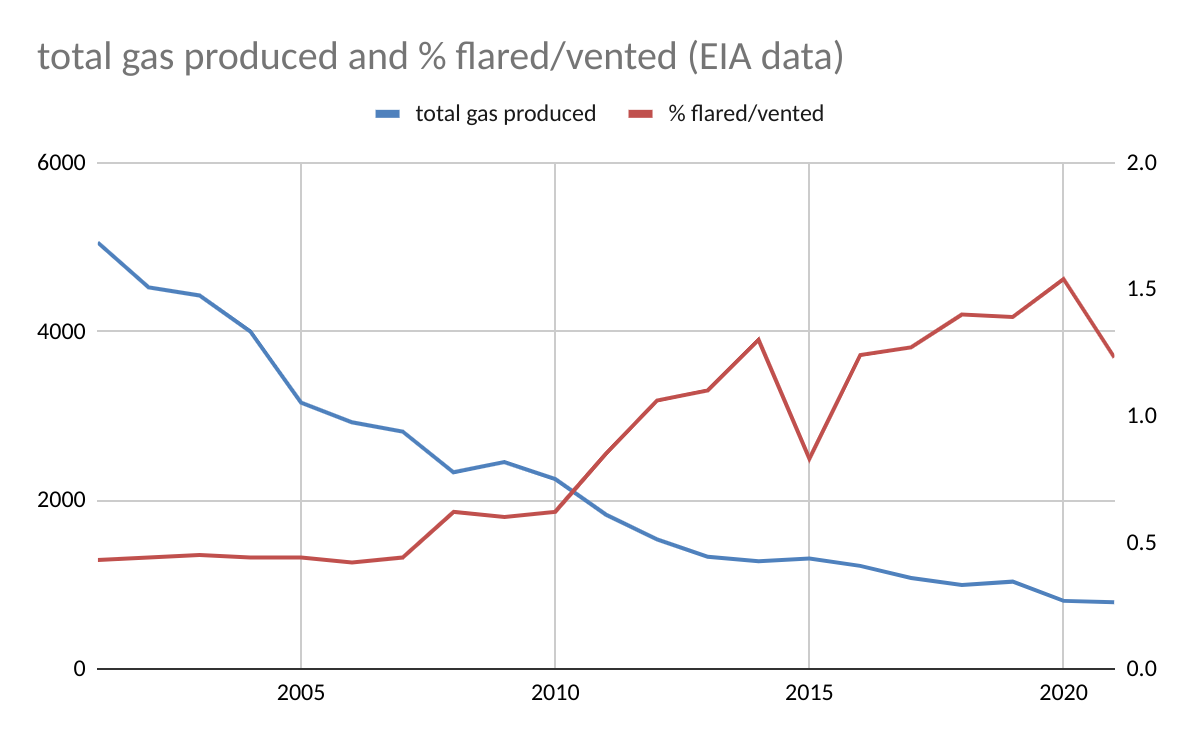
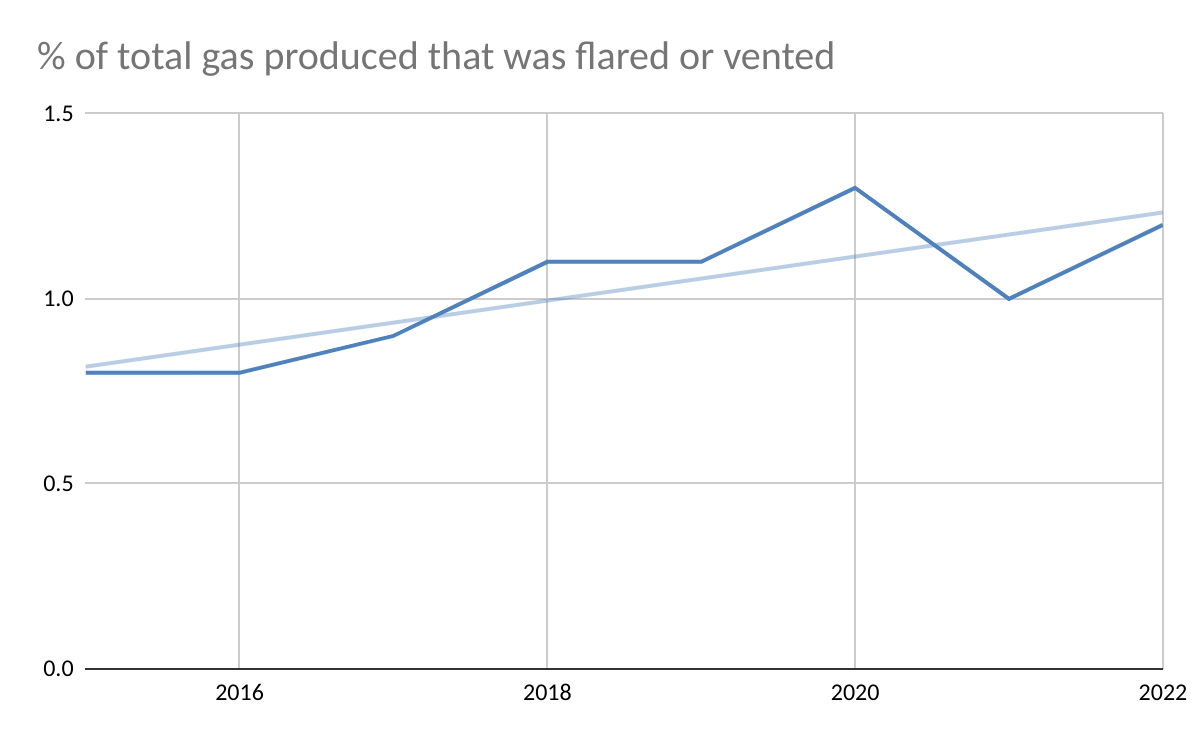
According to EIA data for 2001-2021, Gulf of Mexico flaring and venting volumes peaked in 2001 at 21.6 bcf, 2.25 times the volume flared or vented in 2022 (ONRR data for 2022). However, gas production in 2001 was 5.05 tcf, 6.4 times higher than in 2022. The % of the produced gas that was flared or vented in 2001 was thus 0.4%, less than 1/3 the 2022 rate of 1.22%.
Points to consider:
In 2001, gas production was mostly from gas wells, which have lower flaring/venting rates. As gas production declined because of lower gas-well gas (GWG) production, flaring/venting rates increased (see the chart below). This would account for some of the difference in flaring/venting rates (2001 vs. 2022). However, in recent years, the % of gas-well gas flared or vented has been between 0.3 and 0.5% which is comparable to the rate for all gas production (0.4%) in 2001. So the reduction in GWG production is not the entire reason for the higher flaring/venting rates in recent years. Hence the need for more transparency on flaring/venting performance.
Oil-well gas (OWG) production alone in 2001 (923 bcf) was higher than total gas production (784 bcf) in 2022. If the oil-well gas (OWG) flaring/venting rate was the same as the recent rate for OWG (1.2-1.5%), the volume of gas flared or vented from OWG alone (only 18% of total gas production in 2001) would have accounted for 11.1 – 13.8 bcf or 51-64% of the total volume flared/vented in 2001.
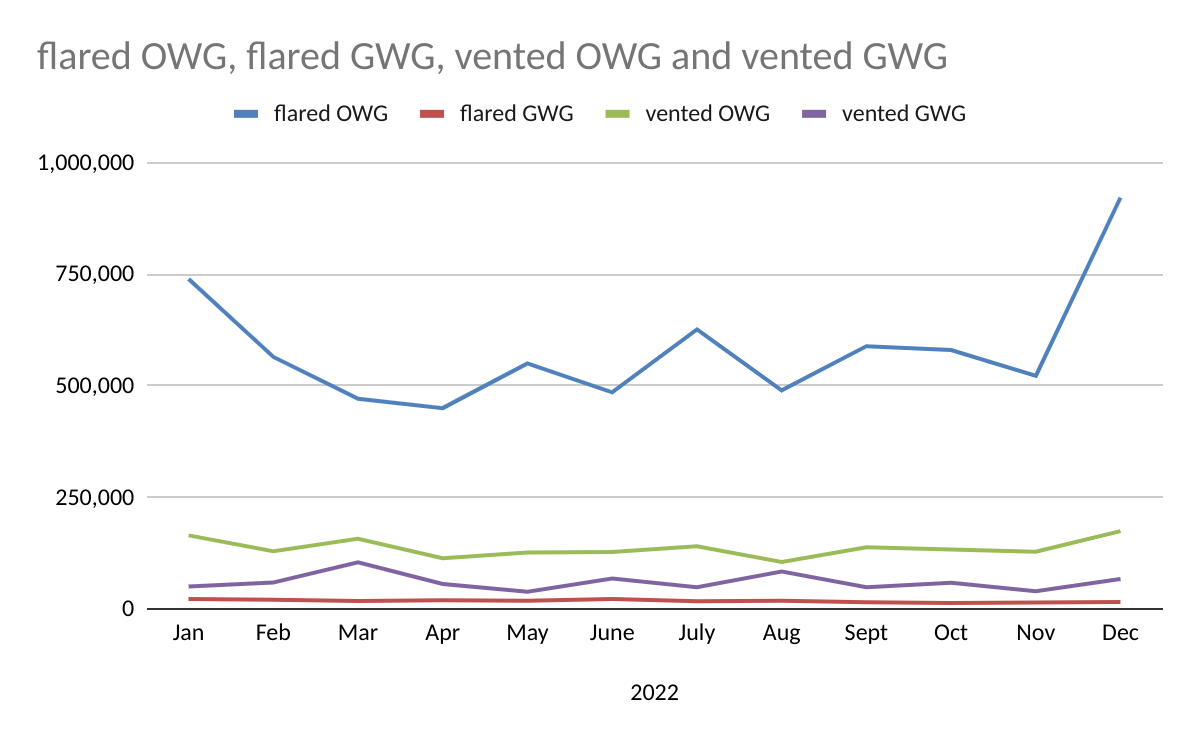
A very large increase in OWG flaring in December skewed the 2022 data (921 million cu ft vs 522 million in November, see 2nd chart below). OWG vented and gas-well gas (GWG) vented also spiked in December (third chart). Were these spikes associated with production startups, major compressor issues, administrative/accounting corrections, or other issues?
Although total venting increased by 407 million cu ft (21%) in 2023 vs. 2022, the overall venting trend is still favorable (last chart).
Kudos to ONRR for posting the flaring/venting data.
More regulator/industry transparency on flaring episodes is needed, particularly in light of the PNAS paper and the June 2022 Inspector General Report.
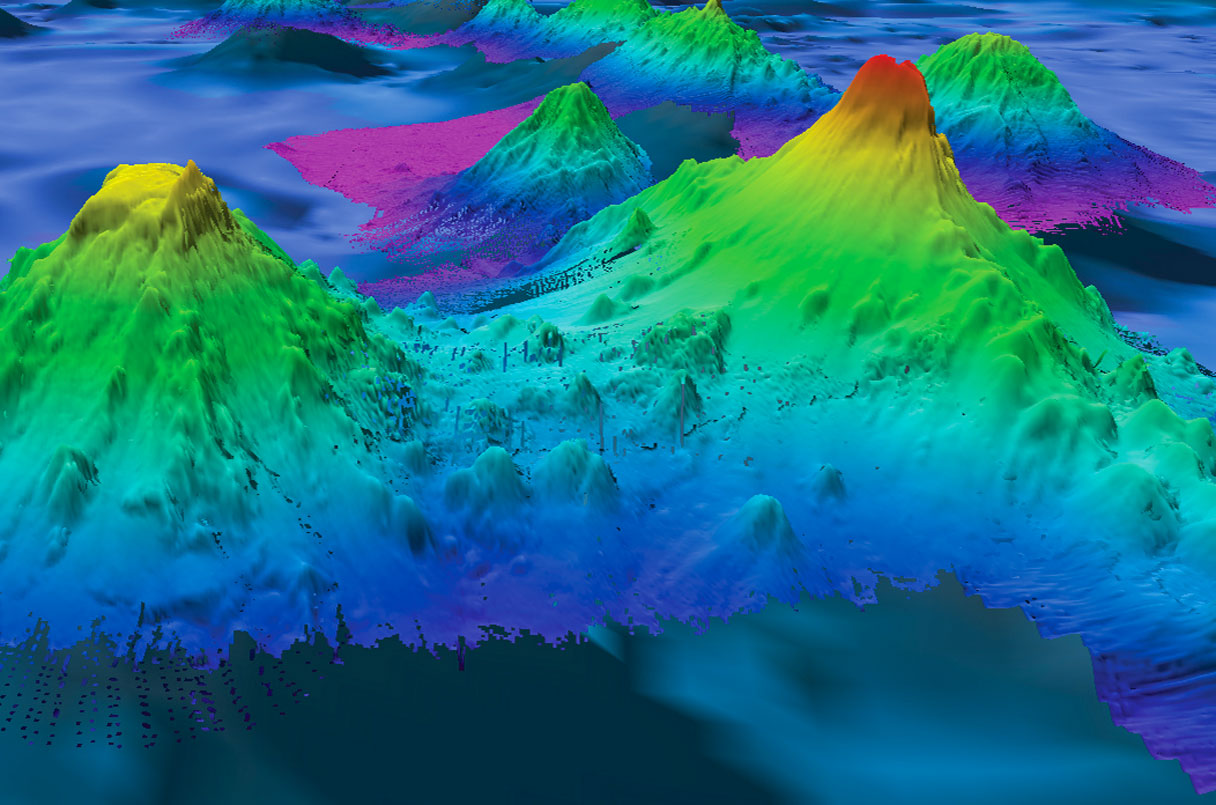
“The 4776-meter-tall Pao Pao Seamount (right) in the South Pacific Ocean has been mapped by sonar. Many others haven’t.” NOAA OFFICE OF OCEAN EXPLORATION AND RESEARCH
This Science article underscores how little we know about the oceans.
With only one-quarter of the sea floor mapped with sonar, it is impossible to know how many seamounts exist. But radar satellites that measure ocean height can also find them, by looking for subtle signs of seawater mounding above a hidden seamount, tugged by its gravity. A 2011 census using the method found more than 24,000. High-resolution radar data have now added more than 19,000 new ones. The vast majority—more than 27,000—remain uncharted by sonar. “It’s just mind boggling,” says David Sandwell, a marine geophysicist at the Scripps Institution of Oceanography, who helped lead the work.
Besides posing navigational hazards, the mountains harbor rare-earth minerals that make them commercial targets for deep-sea miners. Their size and distribution hold clues to plate tectonics and magmatism. They are crucial oases for marine life. And they are pot-stirrers that help control the large-scale ocean flows responsible for sequestering vast amounts of heat and carbon dioxide, says John Lowell, chief hydrographer of the National Geospatial-Intelligence Agency (NGA), which runs the U.S. military’s satellite mapping efforts.
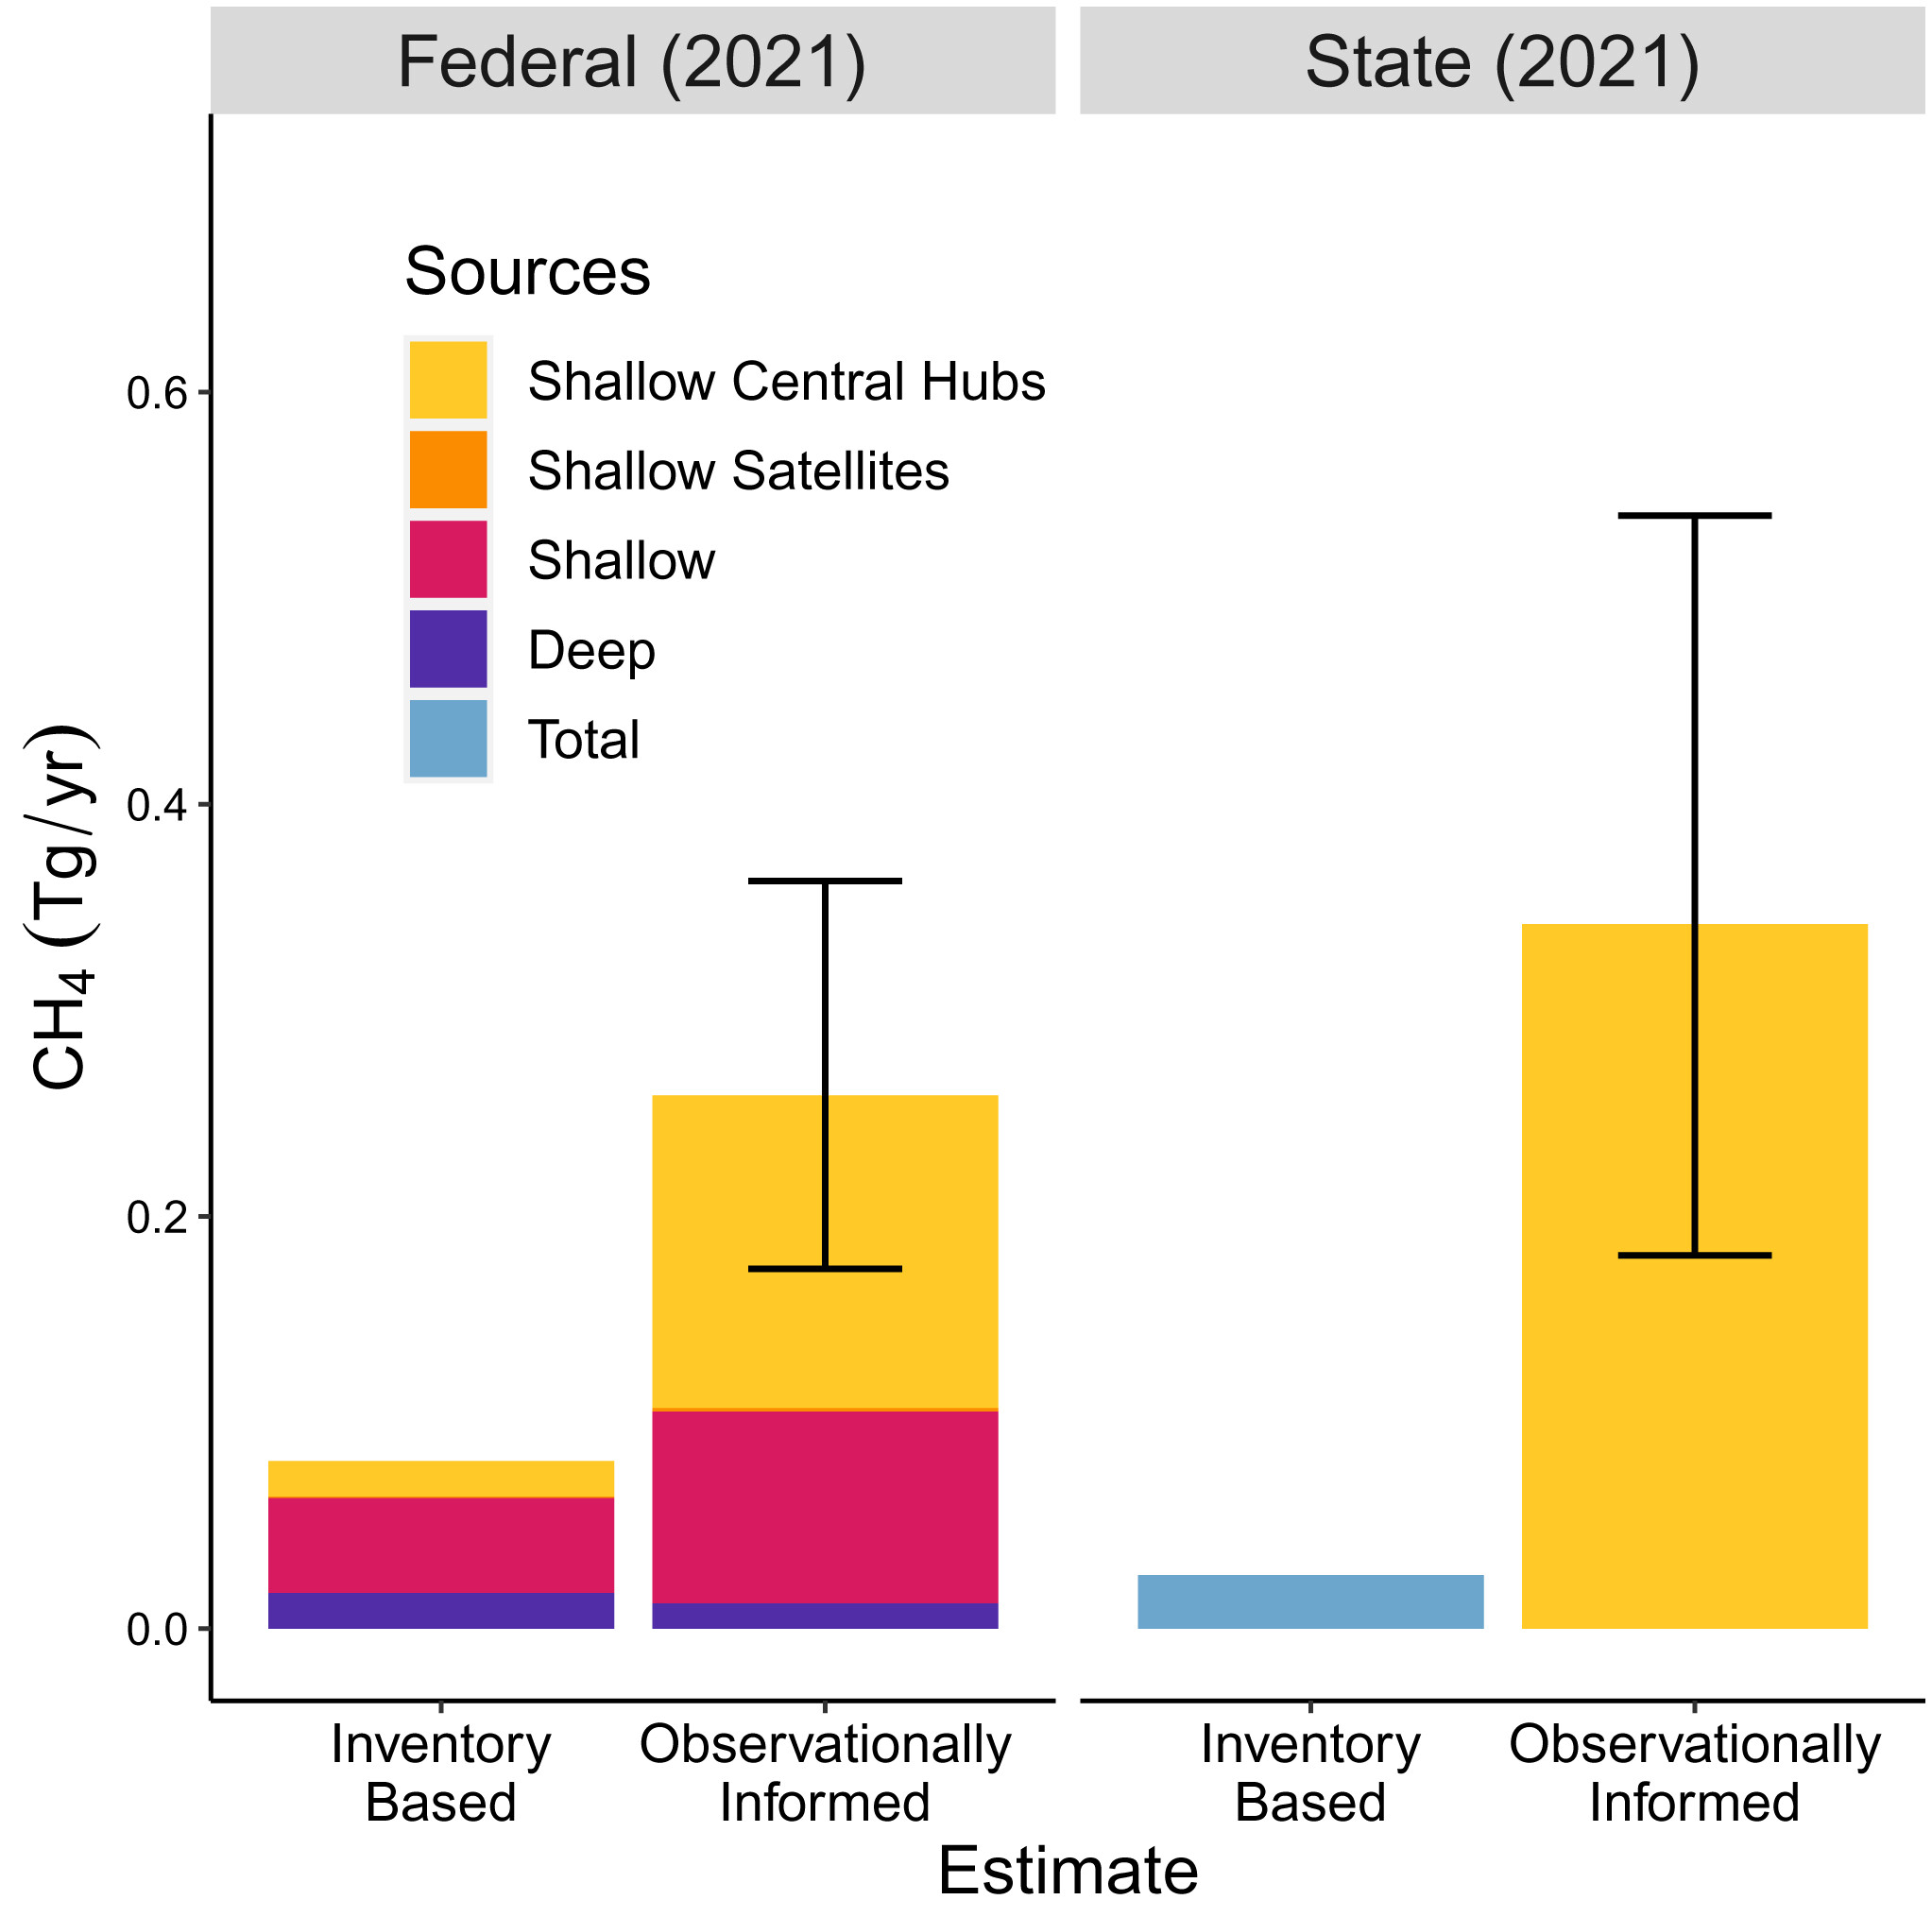
The authors conclude that inventory emissions of CO2 (as reported to BOEM) “are generally consistent with observations from our aircraft survey, suggesting that combustion is well represented in the federal inventory.“
However, that is not the case for methane (CH4) emissions which are underestimated by the Federal inventories. As summarized in the chart below, deepwater facility methane emissions are consistent with the reported inventories, but shelf emissions in State and Federal waters differ significantly.
Comments:
As previously discussed, the lower CI for deepwater production is entirely consistent with expectations. When the most modern 5% (57) of GoM platforms are producing 93% of the oil and 76% of the gas, their CI should be impressive (which indeed it is).
As summarized using ONRR data, more gas-well gas was vented from 2015-2021 than was flared, which is not what you want from a GHG standpoint. Gas wells are predominantly at shallow water facilities, many of which are not equipped with flare booms.
Oil-well gas, most of which is produced at deepwater platforms, is flared rather than vented by a ratio of approximately 4 to 1.
One bad actor may have been a major contributor to the shelf methane emissions observed during the study’s observational flights. That company entered into bankruptcy proceedings. Presumably those issues have been resolved and more rigorous monitoring and enforcement practices have been implemented. I’ll be looking at the 2022 ONRR flaring and venting data for evidence of such improvement. The remainder of the 2022 data should be available in May.
The subject study’s only observational measurements were in August 2020. Followup airborne measurements would be helpful.
The study only considered production emissions. Shelf facilities are primarily natural gas producers and would thus have a lower relative CI when consumed.
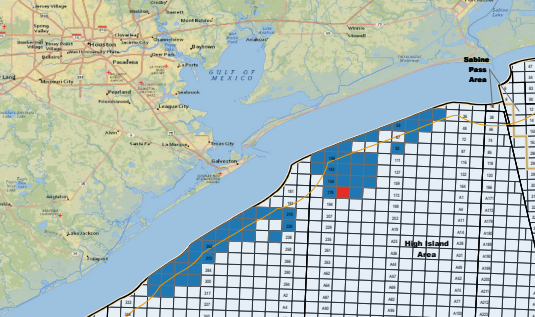
In addition to the 94 nearshore Texas leases Exxon acquired in Sale 257, the company was the sole Sale 259 bidder for all but one of 69 nearshore Texas blocks. The exception was High Island 177 (in red above). So who gets that lease?
the company (Exxon) that was the sole participant in a de facto CCS sale (bid of $182,750)
the company (Focus Exploration) that was participating in the announced oil and gas lease sale (bid of $145,177)
If Exxon is just acquiring these leases for evaluation purposes in preparation for a possible CCS sale in the future, their lease acquisitions may be okay. If they are planning on retaining these leases for actual sequestration operations, that is not okay, at least not until a competitive process has been established for awarding or reclassifying such leases. To date, no lease terms or bid evaluation procedures have been proposed for carbon sequestration leases; nor has an environmental review been conducted pursuant to NEPA.
What a completely pointless exercise! £20 Billion on a Carbon Capture Storage Plan. I wonder which private companies and individuals are being awarded these insane contracts I really do feel like Alice at times like these, except this is no Wonderland! 1984 more like…. pic.twitter.com/PCVTgETM1W