Waiting for a boost from the deepwater startups. The first of that group, King’s Quay did not begin producing until April.
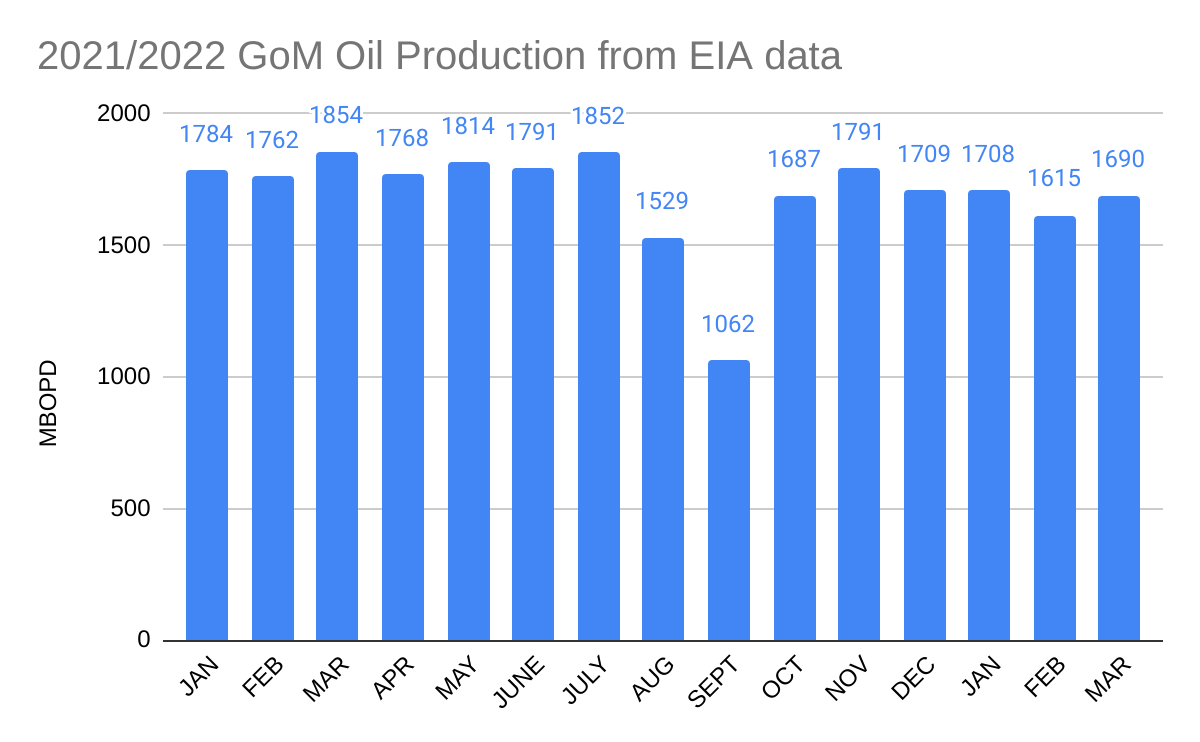
Posted in Gulf of Mexico, Offshore Energy - General, tagged deepwater production, floating production units, Gulf of Mexico, oil production on May 31, 2022| Leave a Comment »
Waiting for a boost from the deepwater startups. The first of that group, King’s Quay did not begin producing until April.
Posted in energy policy, Gulf of Mexico, Offshore Energy - General, tagged 5 year leasing plan, DOI, Gulf of Mexico, US offshore oil and gas leasing on May 19, 2022| 1 Comment »
WASHINGTON — During testimony before the U.S Senate Committee on Energy and Natural Resources today, Secretary of the Interior Deb Haaland confirmed that, despite delays in implementation from the previous Administration, the Interior Department will release the Proposed Program – the next step in the five-year offshore energy planning process – by June 30, 2022, which is the expiration of the current program. A Proposed Program is not a decision to issue specific leases or to authorize any drilling or development.
DOI
Here is the timeline for the 5 Year Leasing Program (light blue).
A sale this year under the new program is thus highly unlikely. The process will no doubt be delayed even further by litigation. As we have said previously, the only hopes for a sale this year are a successful appeal of Judge Contreras’s Sale 257 ruling or successful congressional action (unlikely but possible under the circumstances).
Posted in accidents, drilling, Gulf of Mexico, hurricanes, tagged BSEE, Globetrotter II, Gulf of Mexico, Hurricane Ida, Noble, Shell on May 17, 2022| Leave a Comment »
BOE was troubled by this incident and the contractor’s statements that followed.
BSEE has posted a strong safety alert.
The BSEE investigation concluded that the operator and contractor representatives failed to promptly start the Temporary Abandonment (TA) procedures.
BSEE’s investigation report provides complete details on the incident.

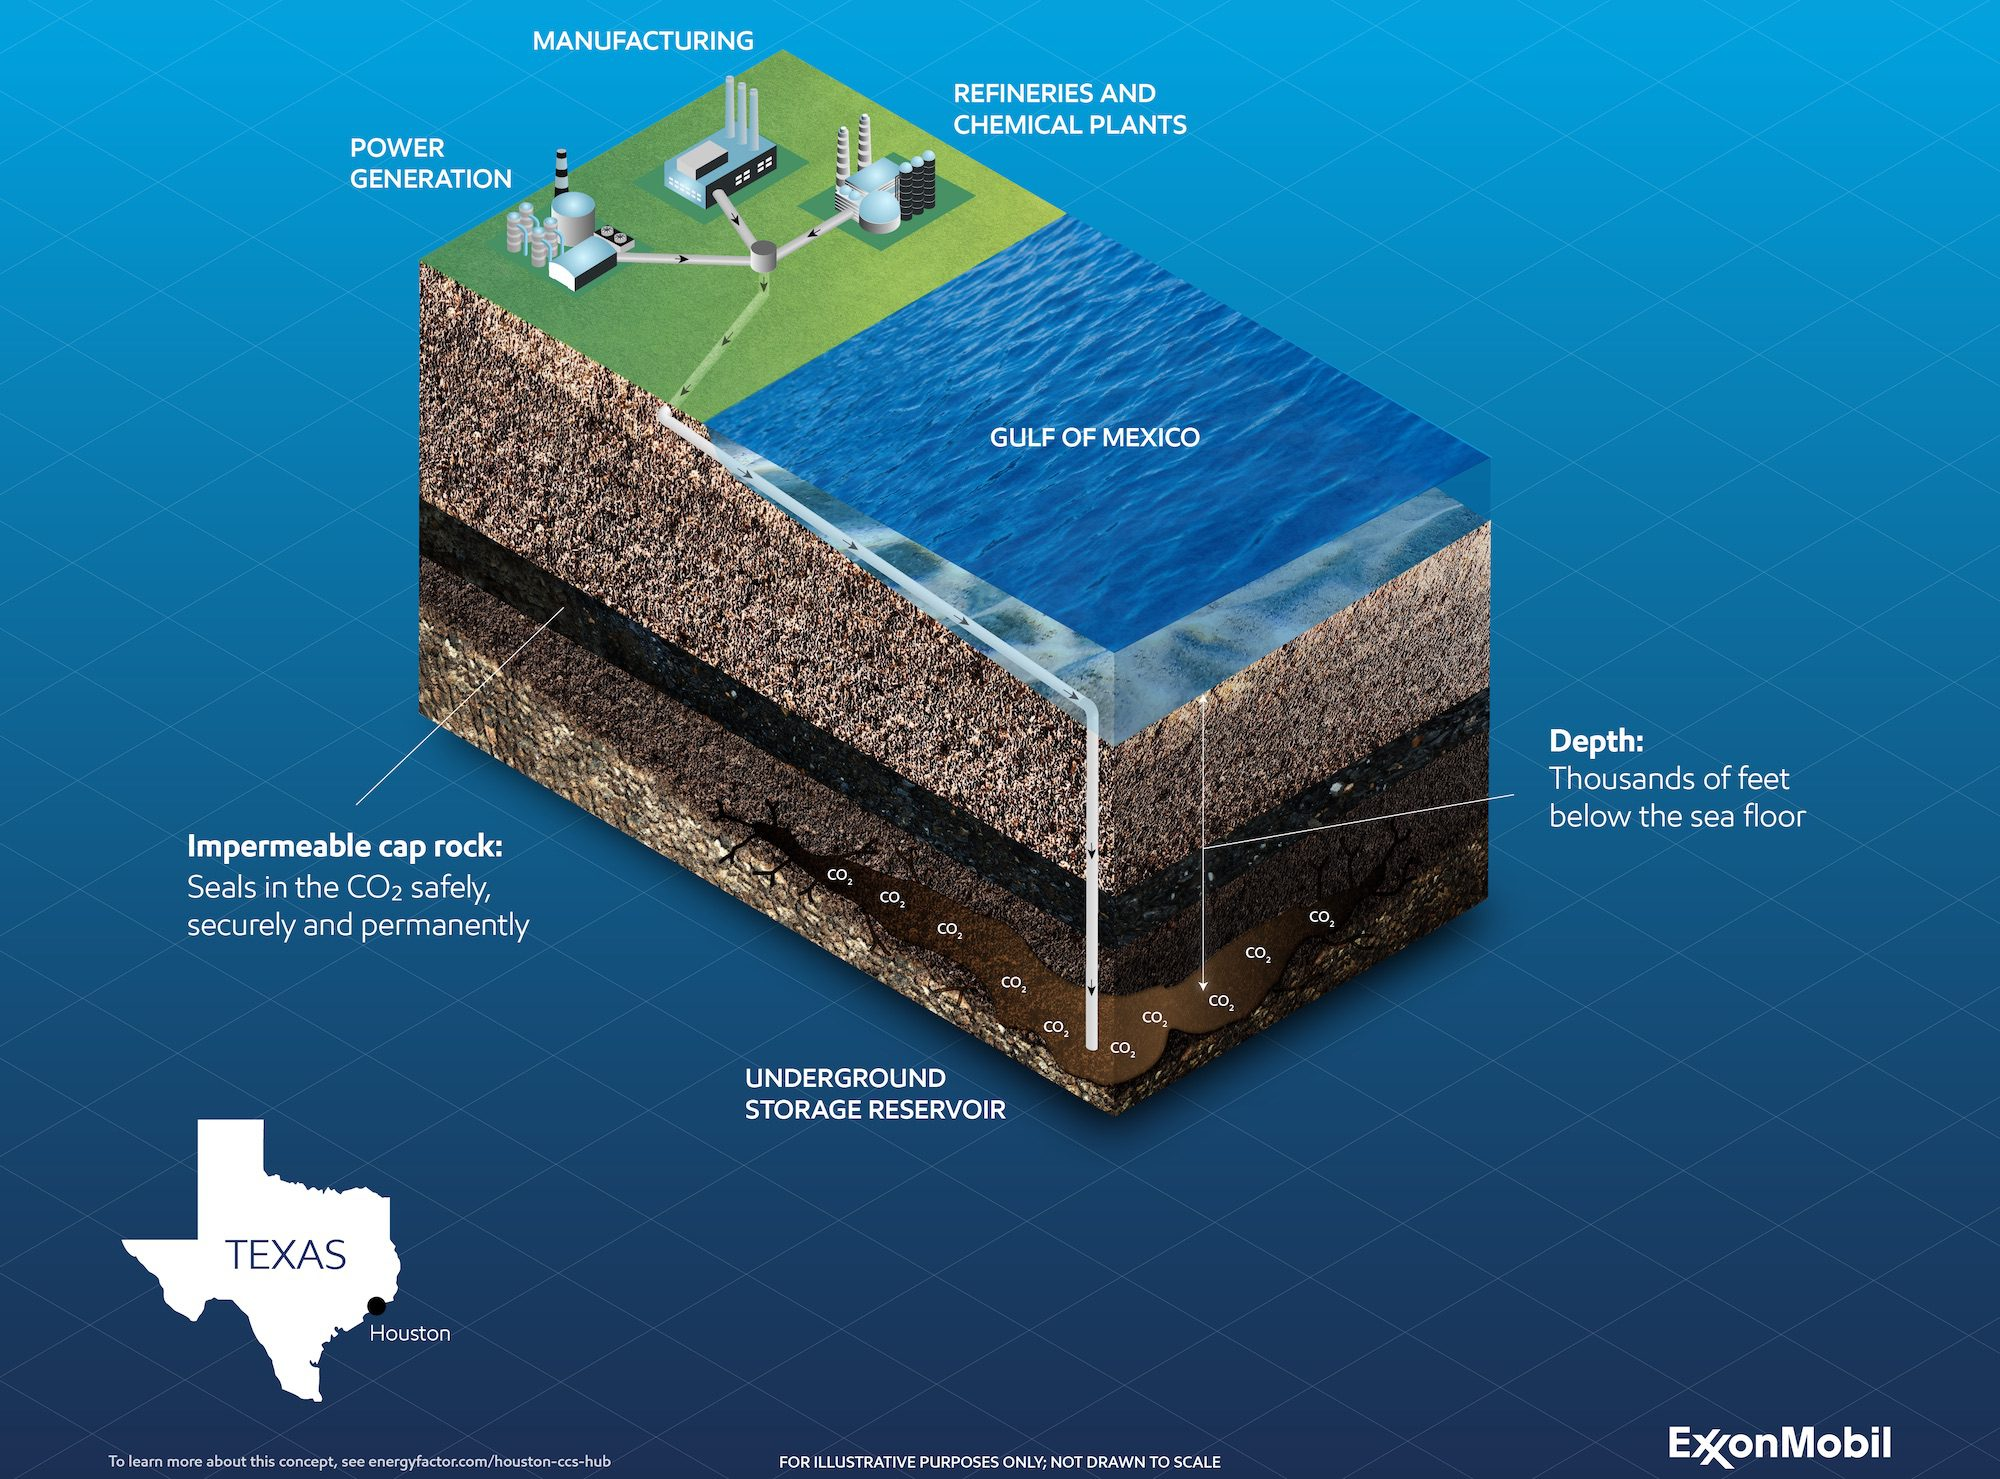
Posted in CCS, climate, energy policy, Gulf of Mexico, pipelines, Regulation, tagged BOEM, carbon sequestration, CCS, DOI, Exxon, Gulf of Mexico, infrastructure bill, Lease Sale 257, OCS Lands Act on May 12, 2022| Leave a Comment »
Background:
Questions:
Posted in drilling, Gulf of Mexico, Offshore Energy - General, tagged AnadarkoOxy, Arena, bp, Cantium, Chevron, exploration, Exxon, Gulf of Mexico, Hess, INCs, LLOG, Murphy, natural gas production, oil production, Shell, violations, well starts on May 10, 2022| Leave a Comment »
| 2021 oil (MMbbls) | 2021 gas (BCF) | 2021/22 well starts total-expl | 2021/22 INCs W-CSI-FSI | |
| Shell | 149.8 | 190.8 | 28-12 | 11-14-4 |
| bp | 114.0 | 82.7 | 5-2 | 6-3-4 |
| Chevron | 83.7 | 42.2 | 8-8 | 1-1-3 |
| Anadarko (Oxy) | 67.7 | 57.8 | 8-6 | 8-5-1 |
| Hess | 27.5 | 61.7 | 2-2 | 7-4-0 |
| Murphy | 25.1 | 50.0 | 7-7 | 4-8-1 |
| LLOG | 20.4 | 29.0 | 3-0 | 1-1-1 |
| Talos | 17.7 | 23.0 | 5-0 | 25-26-14 |
| BHP | 14.5 | 5.9 | 3-2 | 2-3-0 |
| Exxon | 13.2 | 2.3 | – | 1-1-1 |
| Beacon | 10.5 | 15.7 | 1-0 | 0-0-0 |
| Fieldwood | 10.4 | 24.7 | – | 685-235-91 |
| EnVen | 9.6 | 12.6 | 6-0 | 2-6-3 |
| Kosmos | 9.4 | 8.4 | 1-1 | 1-0-0 |
| Arena | 8.6 | 27.9 | 32-0 | 68-45-19 |
| Walter | 8.1 | 36.2 | 2-2 | 3-1-2 |
| Cox | 6.2 | 30.3 | – | 237-169-3 |
| Eni | 4.7 | 13.6 | 2-0 | 8-0-2 |
| W&T | 5.0 | 27.2 | 1-0 | 65-40-7 |
| Cantium | 4.5 | 5.5 | 18-0 | 23-15-2 |
| QuarterNorth | 4.2 | 8.3 | – | no data |
| GoM Shelf | 2.3 | 4.8 | – | 52-5-2 |
| ANKOR | 1.4 | 2.5 | – | 0-0-1 |
| Byron | 1.0 | 4.4 | – | 5-8-2 |
| Renaissance | 0.7 | 1.6 | – | 20-9-3 |
| Sanare | 0.3 | 4.5 | – | 38-20-3 |
| Helis | 0.2 | 1.2 | – | 1-0-2 |
| Contango | 0.03 | 5.0 | – | 4-0-0 |
| Samchully | 0.02 | 1.2 | – | no data |
Comments:
Posted in climate, Gulf of Mexico, natural gas, Offshore Energy - General, tagged Argonne, BSEE, EIA, flaring data, Gulf of Mexico, ONRR, UMich, venting, World Bank on May 5, 2022| Leave a Comment »
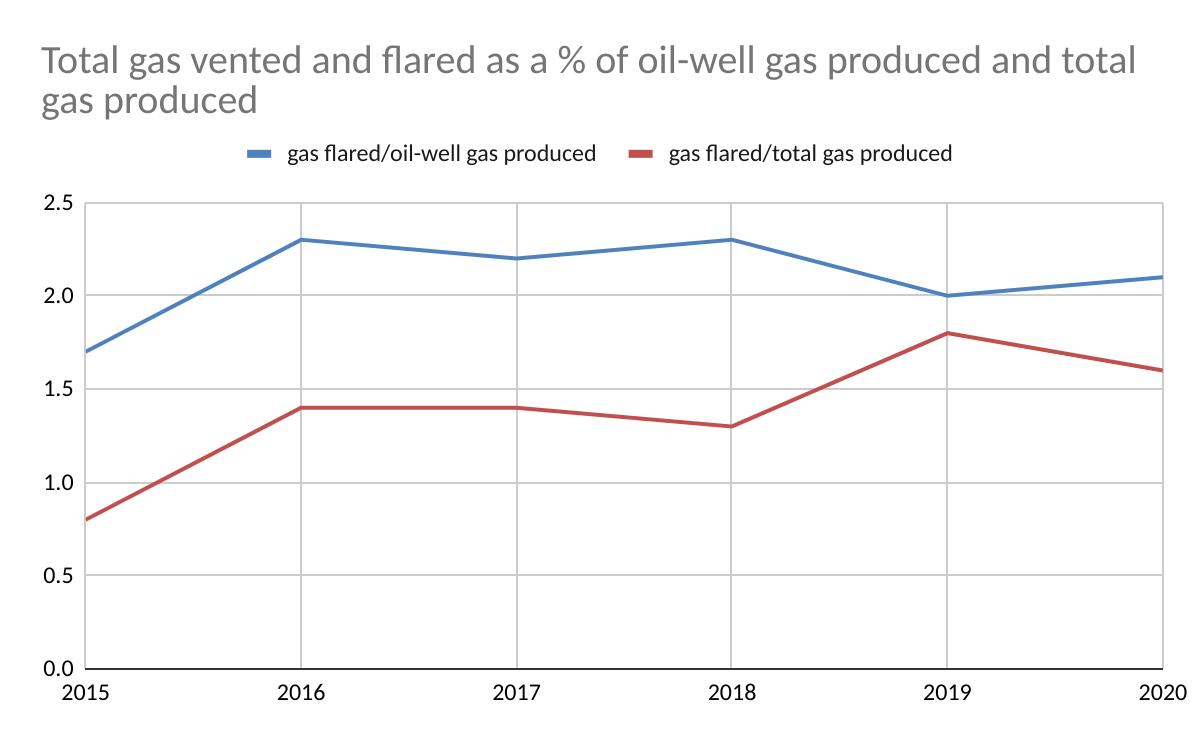
Given the importance of flaring and venting from both environmental and resource conservation standpoints, accurate and reliable data are necessary and should be readily available to the public. ONRR has advised me that they will begin posting flaring and venting data on their website within 2 months. This is a positive step. Currently, data from the 3 primary sources differ considerably.
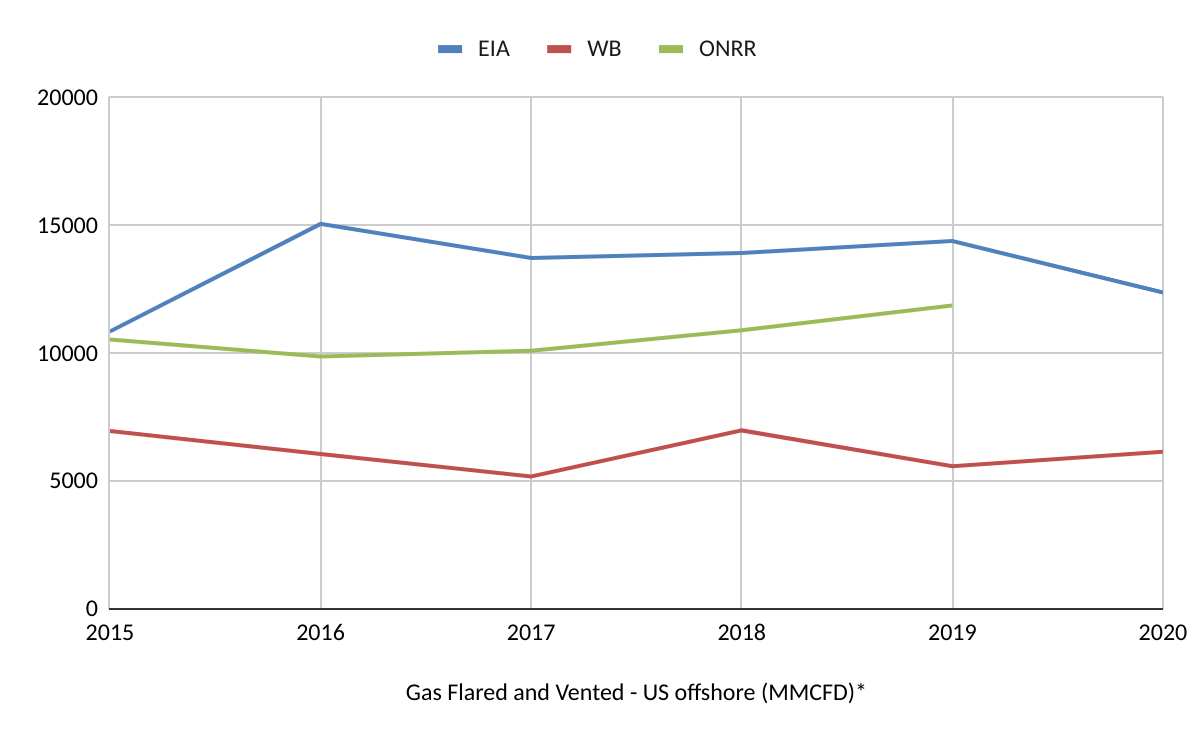
Data Sources:
Comments:
Reports of interest:
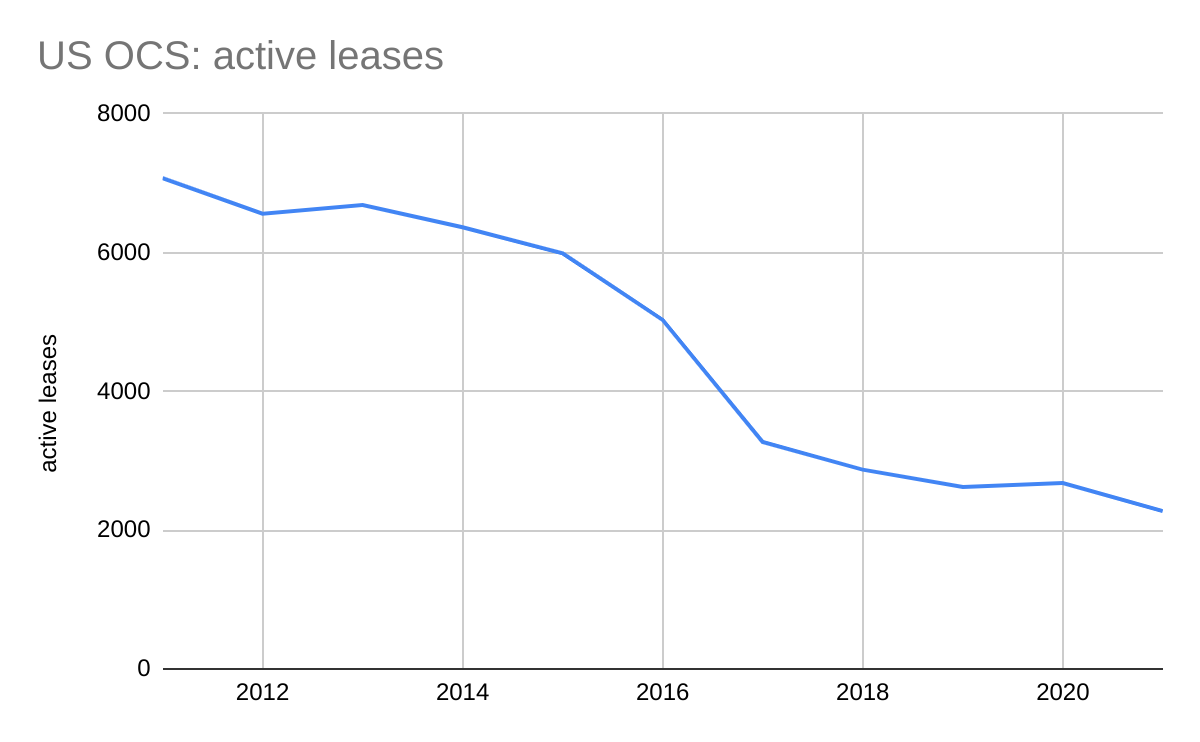
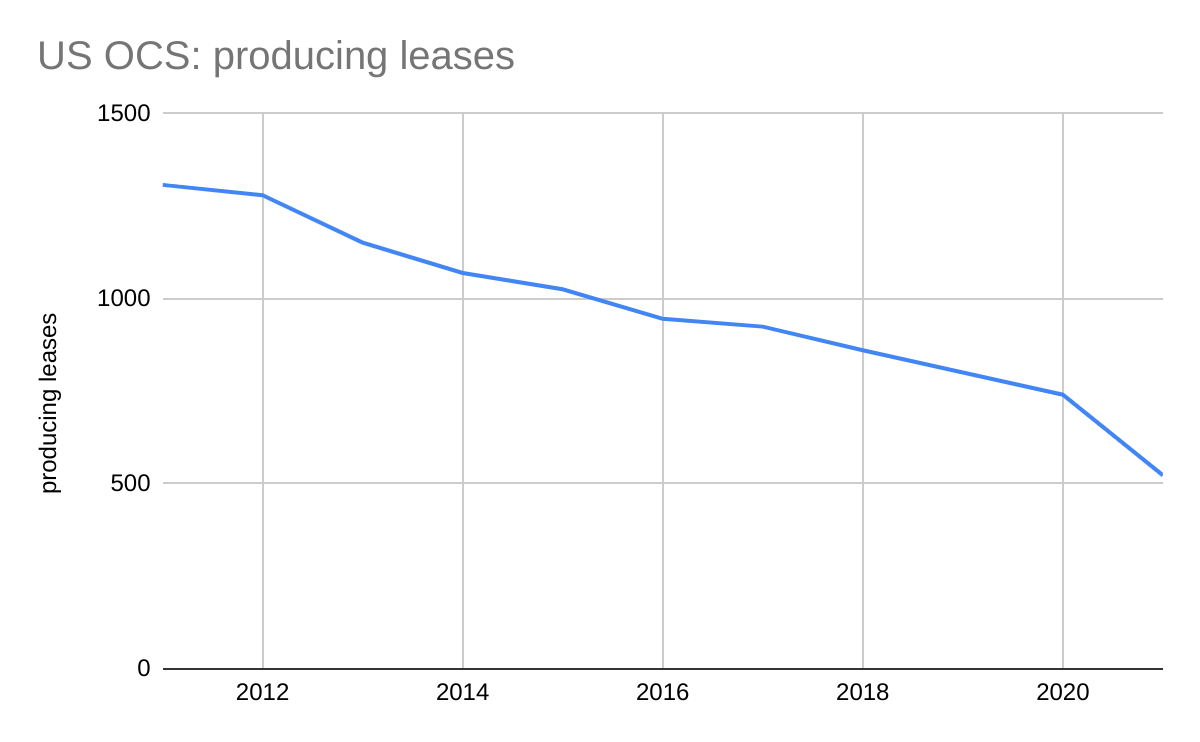
Posted in energy policy, Gulf of Mexico, Offshore Energy - General, tagged active leases, Gulf of Mexico, history, OCS Lands Act, producing leases on May 4, 2022| Leave a Comment »
OCS Lands Act, 43 U.S. Code § 1332 – Congressional declaration of policy
(3) the outer Continental Shelf is a vital national resource reserve held by the Federal Government for the public, which should be made available for expeditious and orderly development, subject to environmental safeguards, in a manner which is consistent with the maintenance of competition and other national needs;
Current reality:
https://budsoffshoreenergy.com/2022/02/28/us-offshore-leasing-time-for-action/
Posted in Gulf of Mexico, Offshore Energy - General, rigs-to-reefs, tagged deepwater production, Gulf of Mexico, number of platforms, platform density, rigs-to-reefs on April 11, 2022| Leave a Comment »

Deepwater production is noteworthy for widely dispersed surface structures supplemented with subsea systems. In the past 30 years, the total number of Gulf of Mexico platforms declined by 50% while the oil production doubled. Of course, this level of production is not sustainable without regular lease sales and increased exploration. In that regard, the signs are not good.
435 GoM shelf platforms have been removed in just the last 5 years (2017-2021). The loss of platforms is accompanied by a loss of marine habitat that the rigs-to-reefs program has partially compensated for. There have been a number of other interesting proposals for the use of old platforms, some more serious than others.
Current number of Gulf of Mexico platforms by water depth:
| water depth | floating and fixed production platforms |
| all depths | 1757 |
| >400 m | 52 |
| >1000 m | 35 |
| >1500 m | 16 |
| >2000 m | 7 |
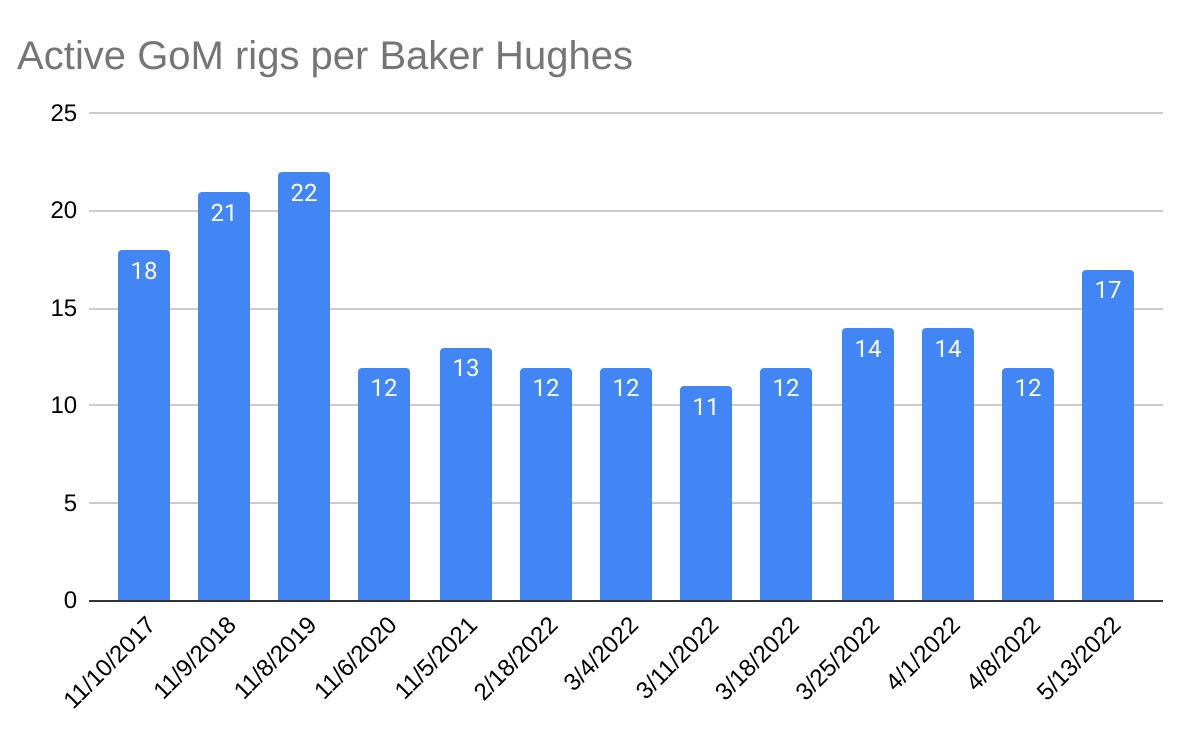
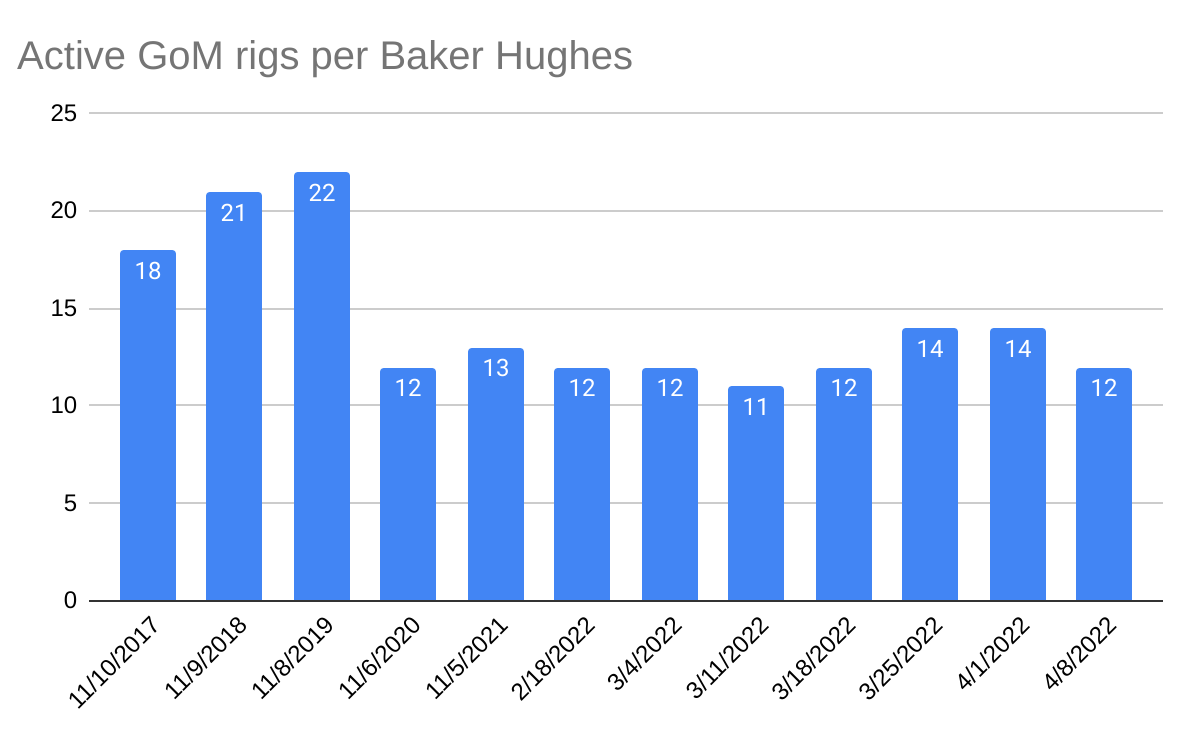
Posted in drilling, Gulf of Mexico, Offshore Energy - General, tagged Baker Hughes rig count, Gulf of Mexico on April 8, 2022| Leave a Comment »