Note: I have attached a PDF for those who want to download the charts and table. I have also added a “flaring and venting” category for easy access to these posts.
Minimizing flaring and venting is important from both environmental and resource conservation standpoints. Flaring and venting volumes are also good indicators of how well production systems are designed, managed, and maintained.
The best performance indicators are the percentages of produced gas that are flared and vented both for oil-well gas (OWG, also known as associated gas or casinghead gas) and gas-well gas (GWG or non-associated gas).
I compile monthly flaring and venting volumes for the Gulf of Mexico using data submitted to the Office of Natural Resources Revenue (ONRR). Reporting these data is mandatory and strictly enforced. Violators are subject to civil and criminal penalties.
In assessing performance trends, it’s important to segment venting and flaring volumes for both OWG and GWG production. Venting produced gas (mostly methane) is a more significant environmental concern from both air quality and greenhouse gas (GHG) perspectives. Reductions in methane emissions are a priority for regulators and leading operators.
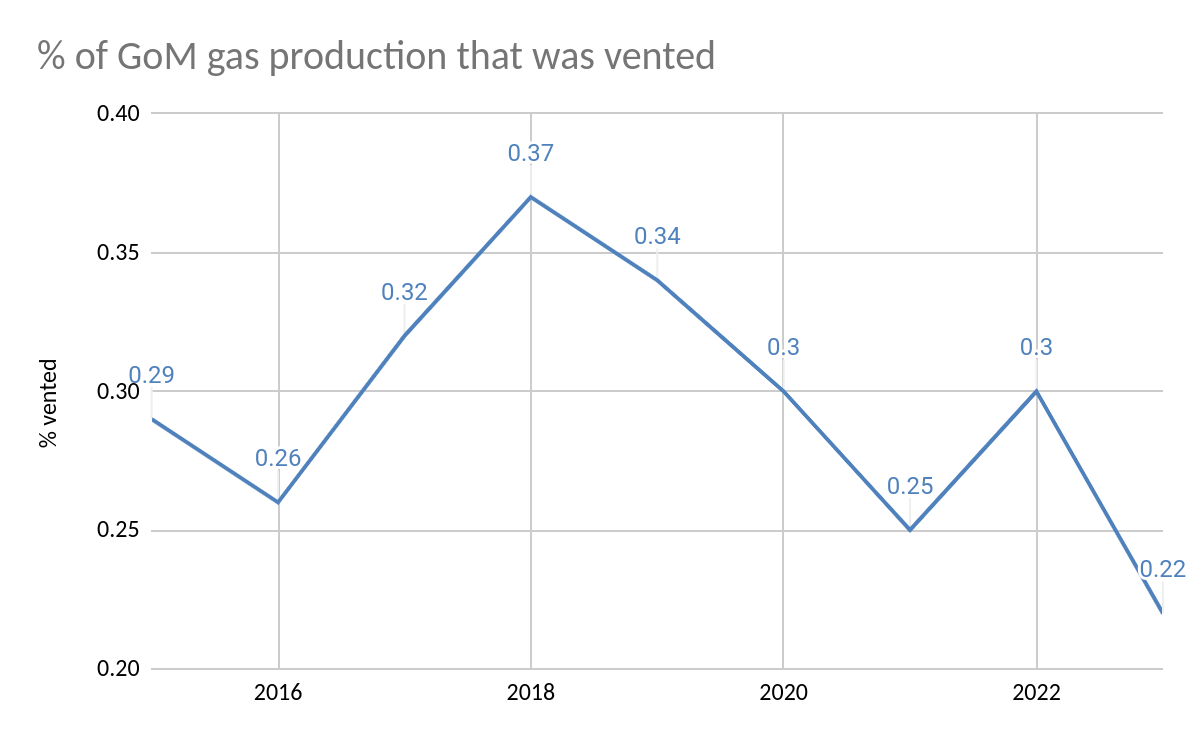
Flaring and venting data for 2019-2023 are summarized in the charts and table below. All volumes are in millions of cubic feet (MMCF). For the last chart (% of total gas production vented), I added ONRR data for 2015-2018 to provide a longer term perspective on overall venting performance.
Observations:
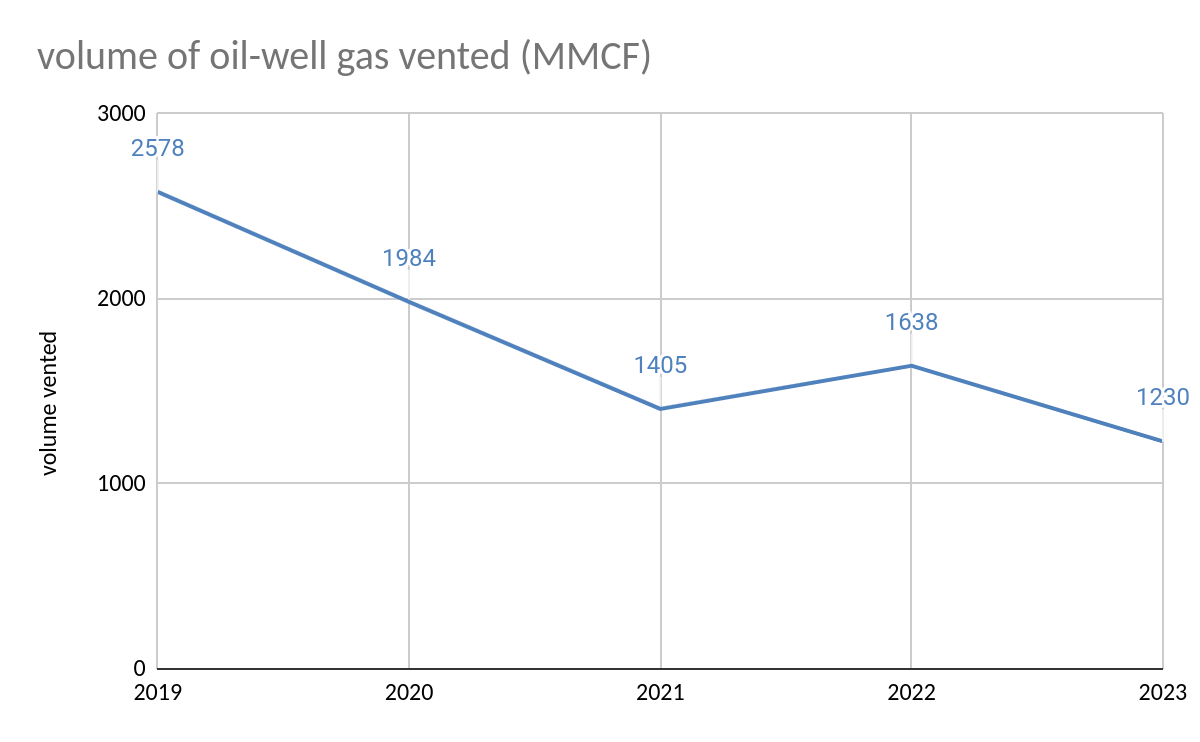
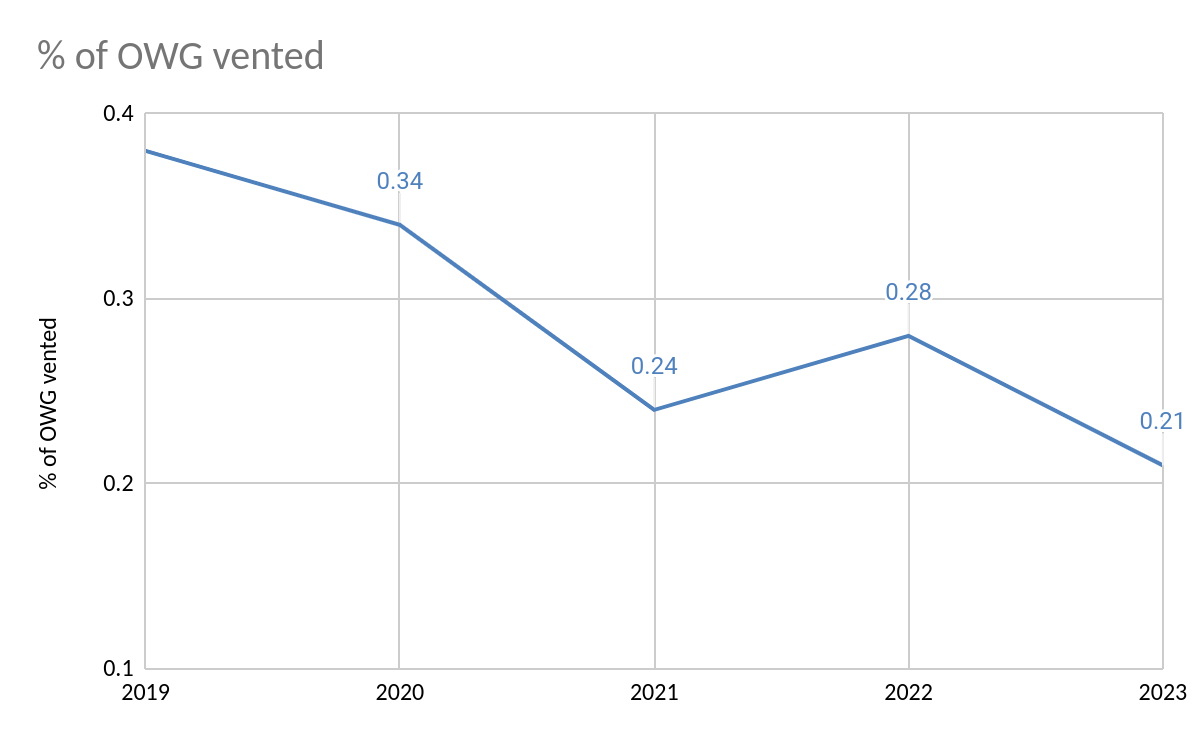
- OWG venting has declined significantly both in terms of the total volume and % flared. Most OWG is now produced at modern deepwater platforms equipped with efficient flare stacks. Venting from these facilities is minimal. A performance target of <0.2% for OWG venting should therefore be achievable.
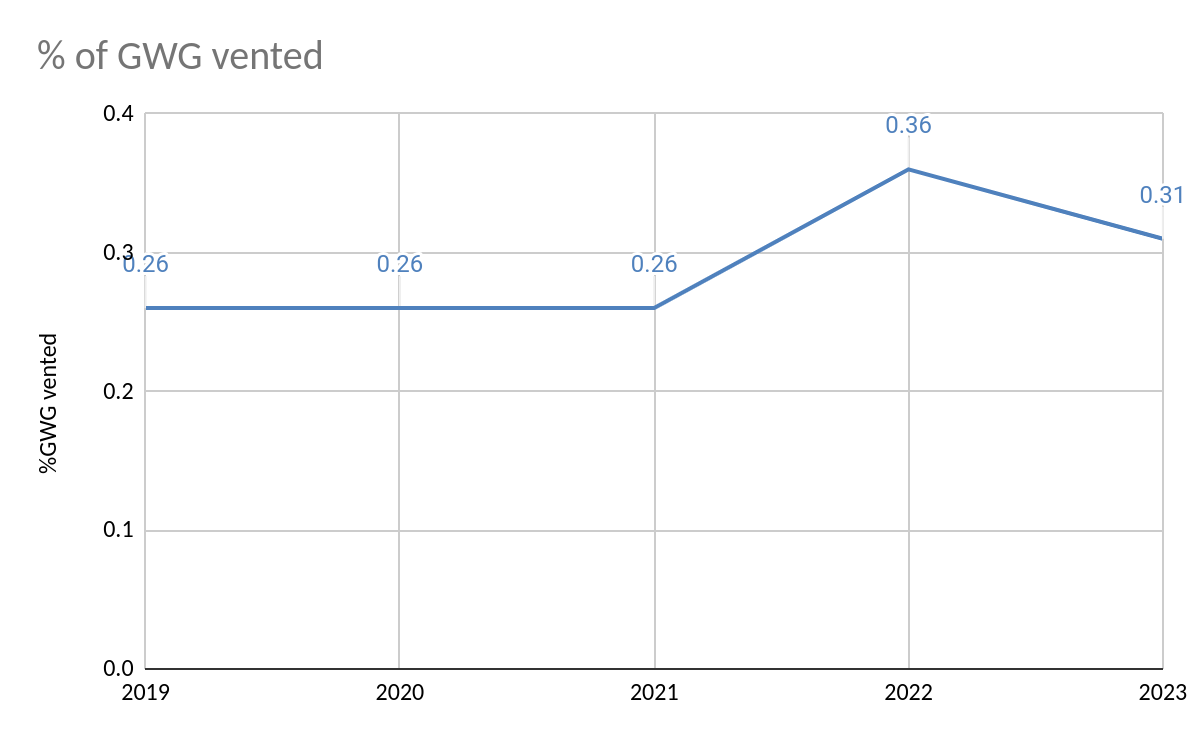
- GWG venting volumes have declined sharply. However, given the parallel decline in GWG production, the % of GWG vented has actually increased. Most gas wells are on older shelf platforms where flare booms cannot be safely and economically added. Nonetheless, it’s disappointing that the % of GWG vented increased to > 0.3% in both 2022 and 2023.
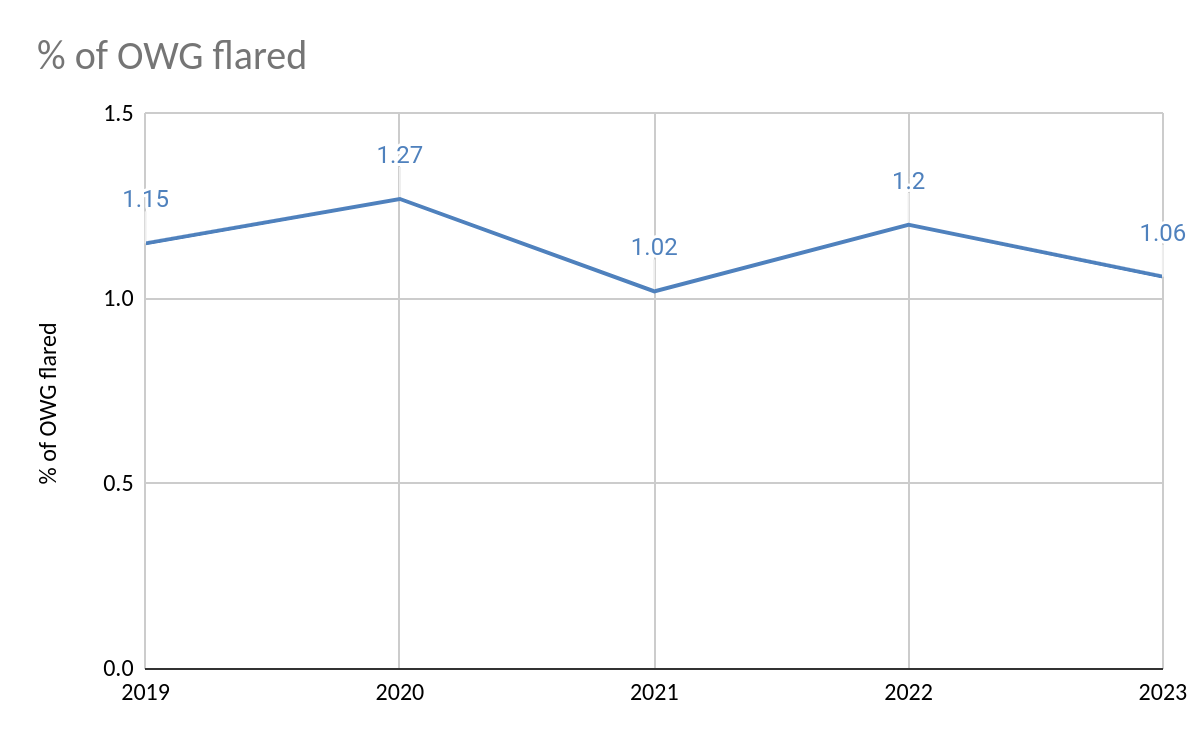
- OWG flaring has remained relatively constant both in terms of the volume and % flared. Given that most OWG is produced at deepwater facilities, reduction of the flaring % to <1.0 should be achievable.
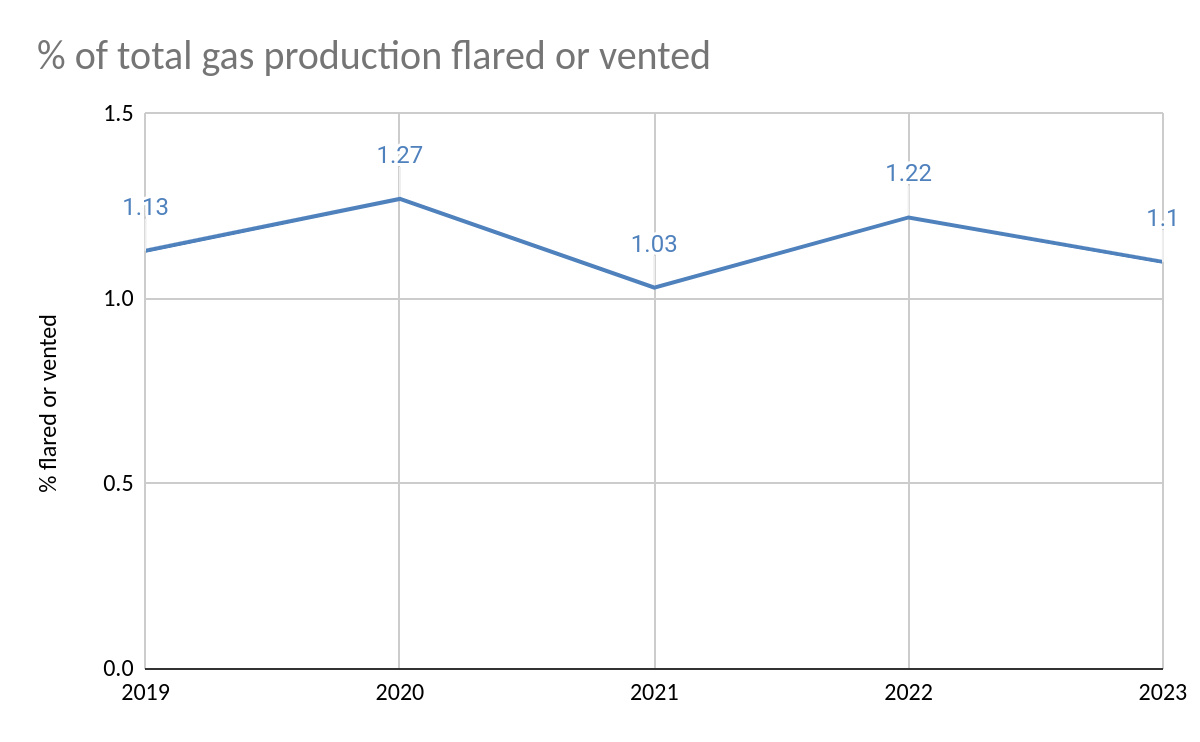
- The % of the total gas flared or vented has remained relatively constant at >1.0%. Again, a target of <1.0% should be achievable.
- In the table, the figures in blue are particularly encouraging and the figures in red are the most disappointing.
- Overall, the numbers are good, but continuous improvement should be the objective. Reductions in GWG venting and OWG flaring should be prioritized.
- As previously discussed, flaring/venting performance could be better assessed if information on large flaring/venting episodes was made publicly available. Explanations are needed for spikes in monthly ONRR flaring/venting volumes. Are these spikes associated with production startups, tropical storm restarts, major compressor issues, administrative/accounting corrections, or something else?
| 2019 | 2020 | 2021 | 2022 | 2023 | |
| OWG flared | 7727 | 7385 | 5919 | 6987 | 6342 |
| OWG vented | 2578 | 1984 | 1405 | 1638 | 1230 |
| OWG produced | 670,699 | 582,254 | 582,824 | 581,235 | 598,005 |
| % OWG flared | 1.15 | 1.27 | 1.02 | 1.20 | 1.06 |
| % OWG vented | 0.38 | 0.34 | 0.24 | 0.28 | 0.21 |
| GWG flared | 405 | 432 | 311 | 213 | 212 |
| GWG vented | 958 | 578 | 548 | 722 | 468 |
| GWG produced | 364,082 | 224,808 | 209,558 | 203,342 | 152,400 |
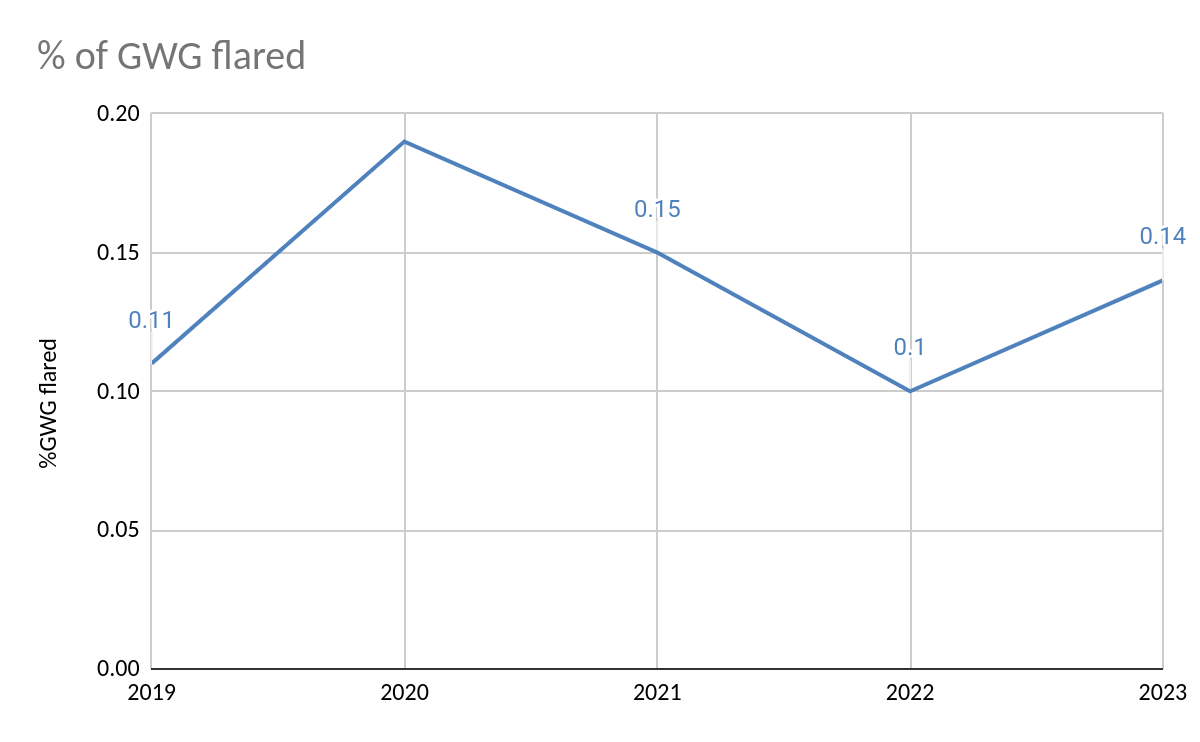
| %GWG flared | 0.11 | 0.19 | 0.15 | 0.10 | 0.14 |
| %GWG vented | 0.26 | 0.26 | 0.26 | 0.36 | 0.31 |
| total flared and vented | 11668 | 10233 | 8183 | 9559 | 8252 |
| total gas production | 1,034,782 | 807,062 | 792,382 | 784,577 | 750,405 |
| % flared or vented | 1.13 | 1.27 | 1.03 | 1.22 | 1.10 |
| total vented | 3536 | 2416 | 1953 | 2360 | 1698 |
| % vented | 0.34 | 0.30 | 0.25 | 0.30 | 0.22 |
| total flared | 8132 | 7817 | 6230 | 7200 | 6554 |
| % flared | 0.79 | 0.97 | 0.79 | 0.92 | 0.87 |
OWG=oil well gas; GWG=gas well gas; all volumes are in MMCF