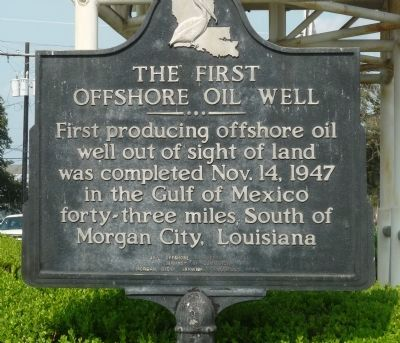
The platform was supported by an attendant barge that provided living quarters and equipment and materials needed for the drilling operations. This was reportedly the first drilling tender.
BSEE’s borehole file records indicate that 31 wells were drilled on this block beginning in September 1947.
BOEM’s production file shows initial production rates of 7000 to 10,600 bbls of oil per month. The accuracy of these old data is uncertain.
This was reportedly the first time drilling crews worked 12-hour tours for seven days and then rotated to shore for seven days off.
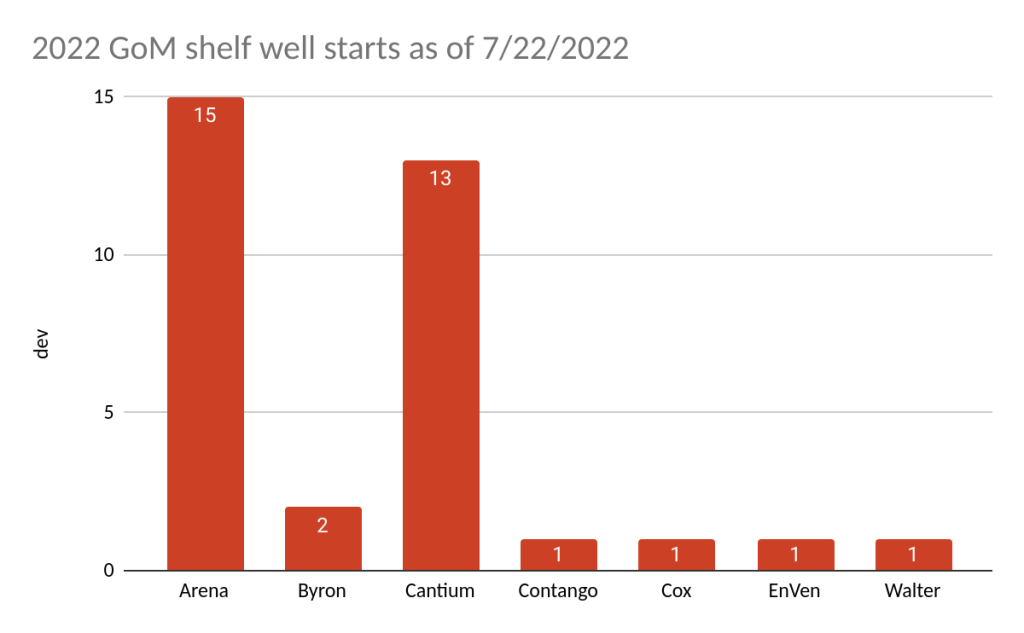
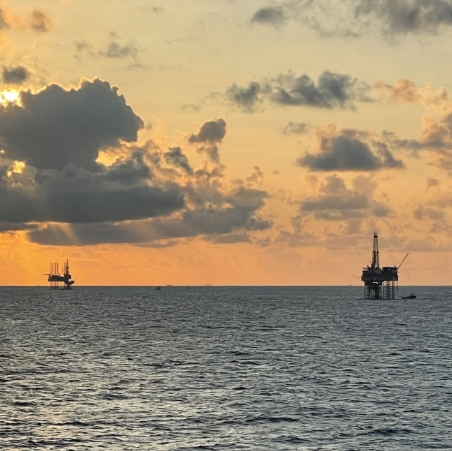
Without much hype, shelf operators continue to find and extract oil and gas from beneath the shallow waters of the GoM. The 1700 shelf platforms that remain provide energy for our economy and important hardbottom substrate for marine life. Keep it going! Only 25 more years until the 100th anniversary! 😀
Foremost energy experts like Daniel Yergin understand that oil and gas will be critical to our economy and security for decades, and that offshore production is an important component of our energy supply chain. Unfortunately, our massive outer continental shelf has, from an oil and gas standpoint, been effectively reduced to the central and western GoM.
Opportunities in the GoM are being seriously constrained by the extended pause in leasing. A lease sale has not been held for 615 days, the longest US offshore leasing gap since the 1950’s.
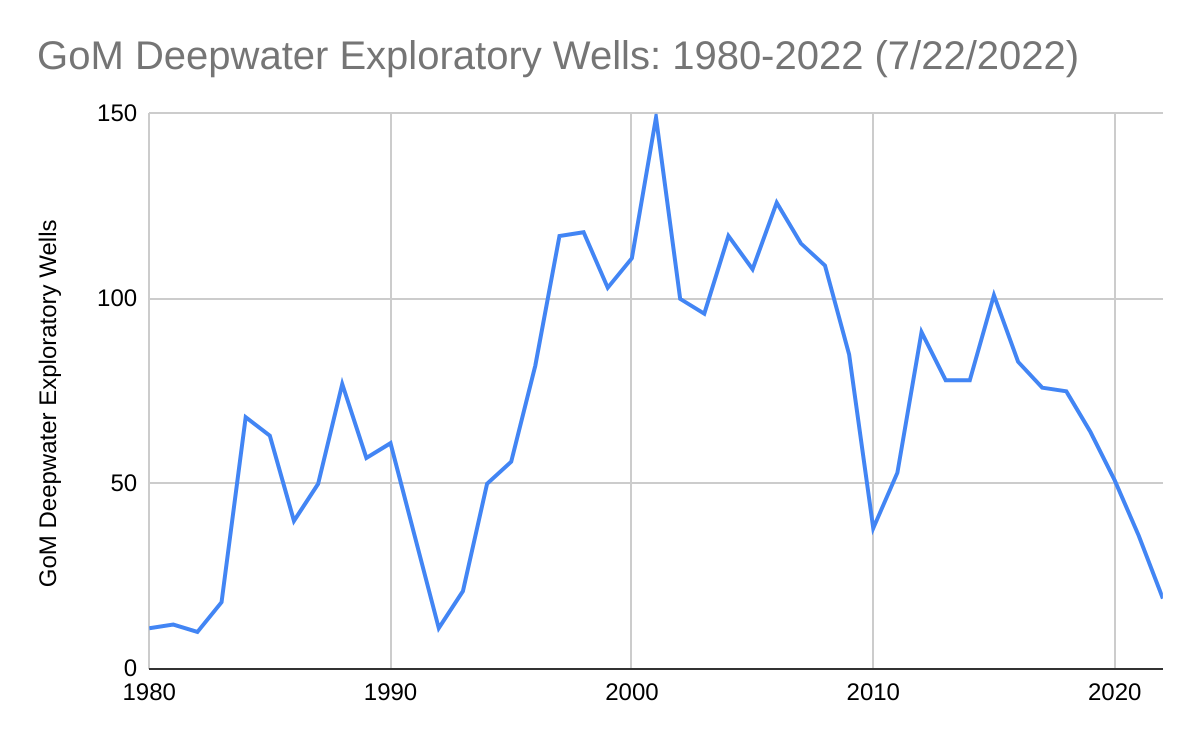
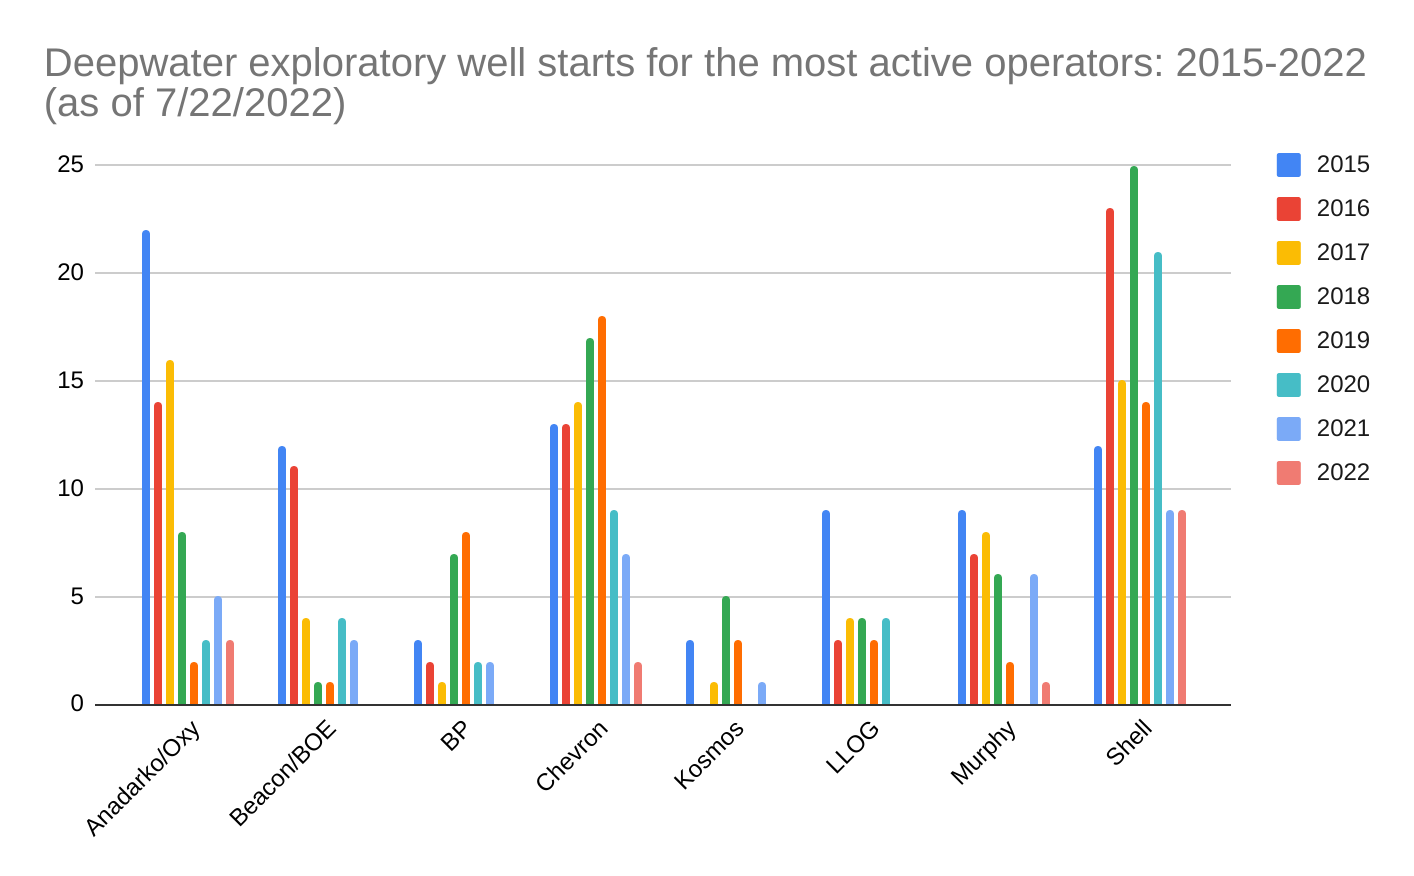
Reserve replacement and sustained production are dependent on exploration. The charts below illustrate the decline in GoM exploratory drilling and the reduced activity by some of the more important operating companies.
Per BSEE data, the number of exploratory well starts averaged only 3/month for the last 18 months (chart 2). This level of activity is the lowest since the early days of deepwater operations (chart 1). There was even more drilling during the post-Macondo moratorium (2010-2011).
ConocoPhillips and Exxon have not drilled a GoM exploratory well since 2016 and 2018 respectively. Activity by other operators has also declined significantly (chart 3). BP has not spudded an exploratory well since Sept. 2021.
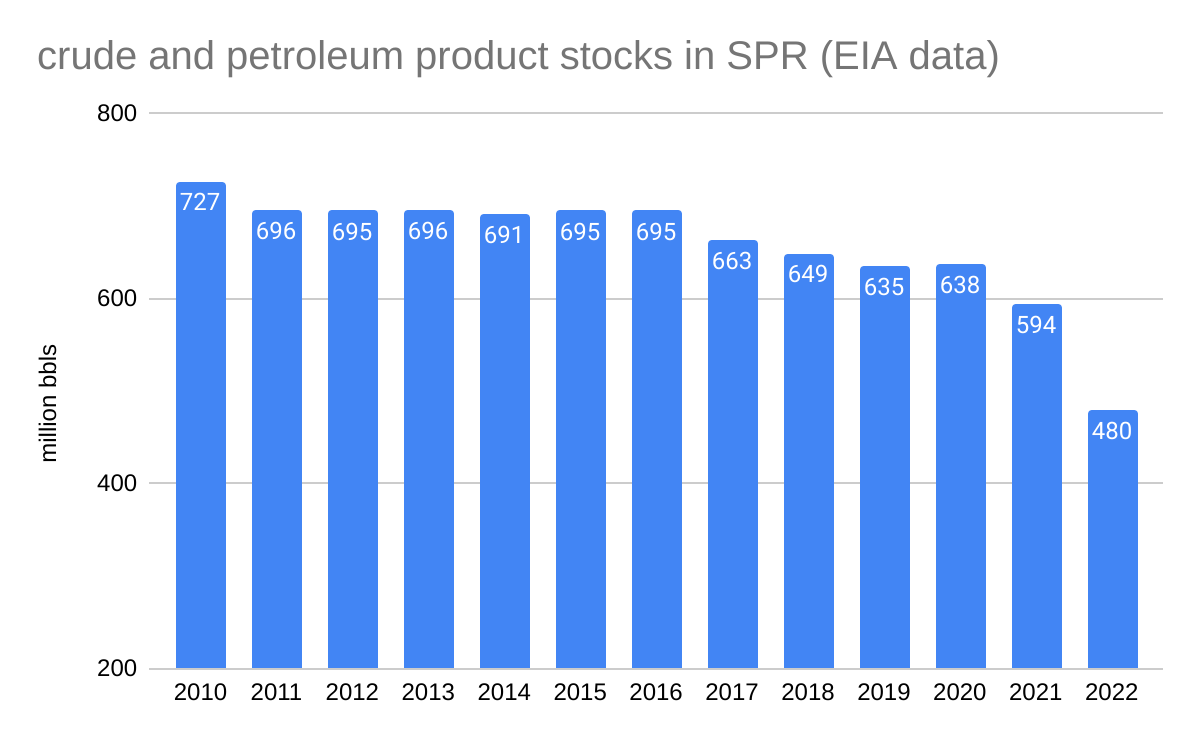
…that the SPR legislation authorized the sale of large volumes of oil for the purpose of easing worldwide prices. Per section 151 of the statute, which was passed following the oil embargoes in the 1970’s, the SPR was intended todiminish the vulnerability of the United States to the effects of a severe energy supply interruption.
…that SPR oil could be sold to all entities including Chinese companies that are also buying oil from Russia, the country being boycotted. How absurd is that? (The confirmation of one such transaction is pasted below.)
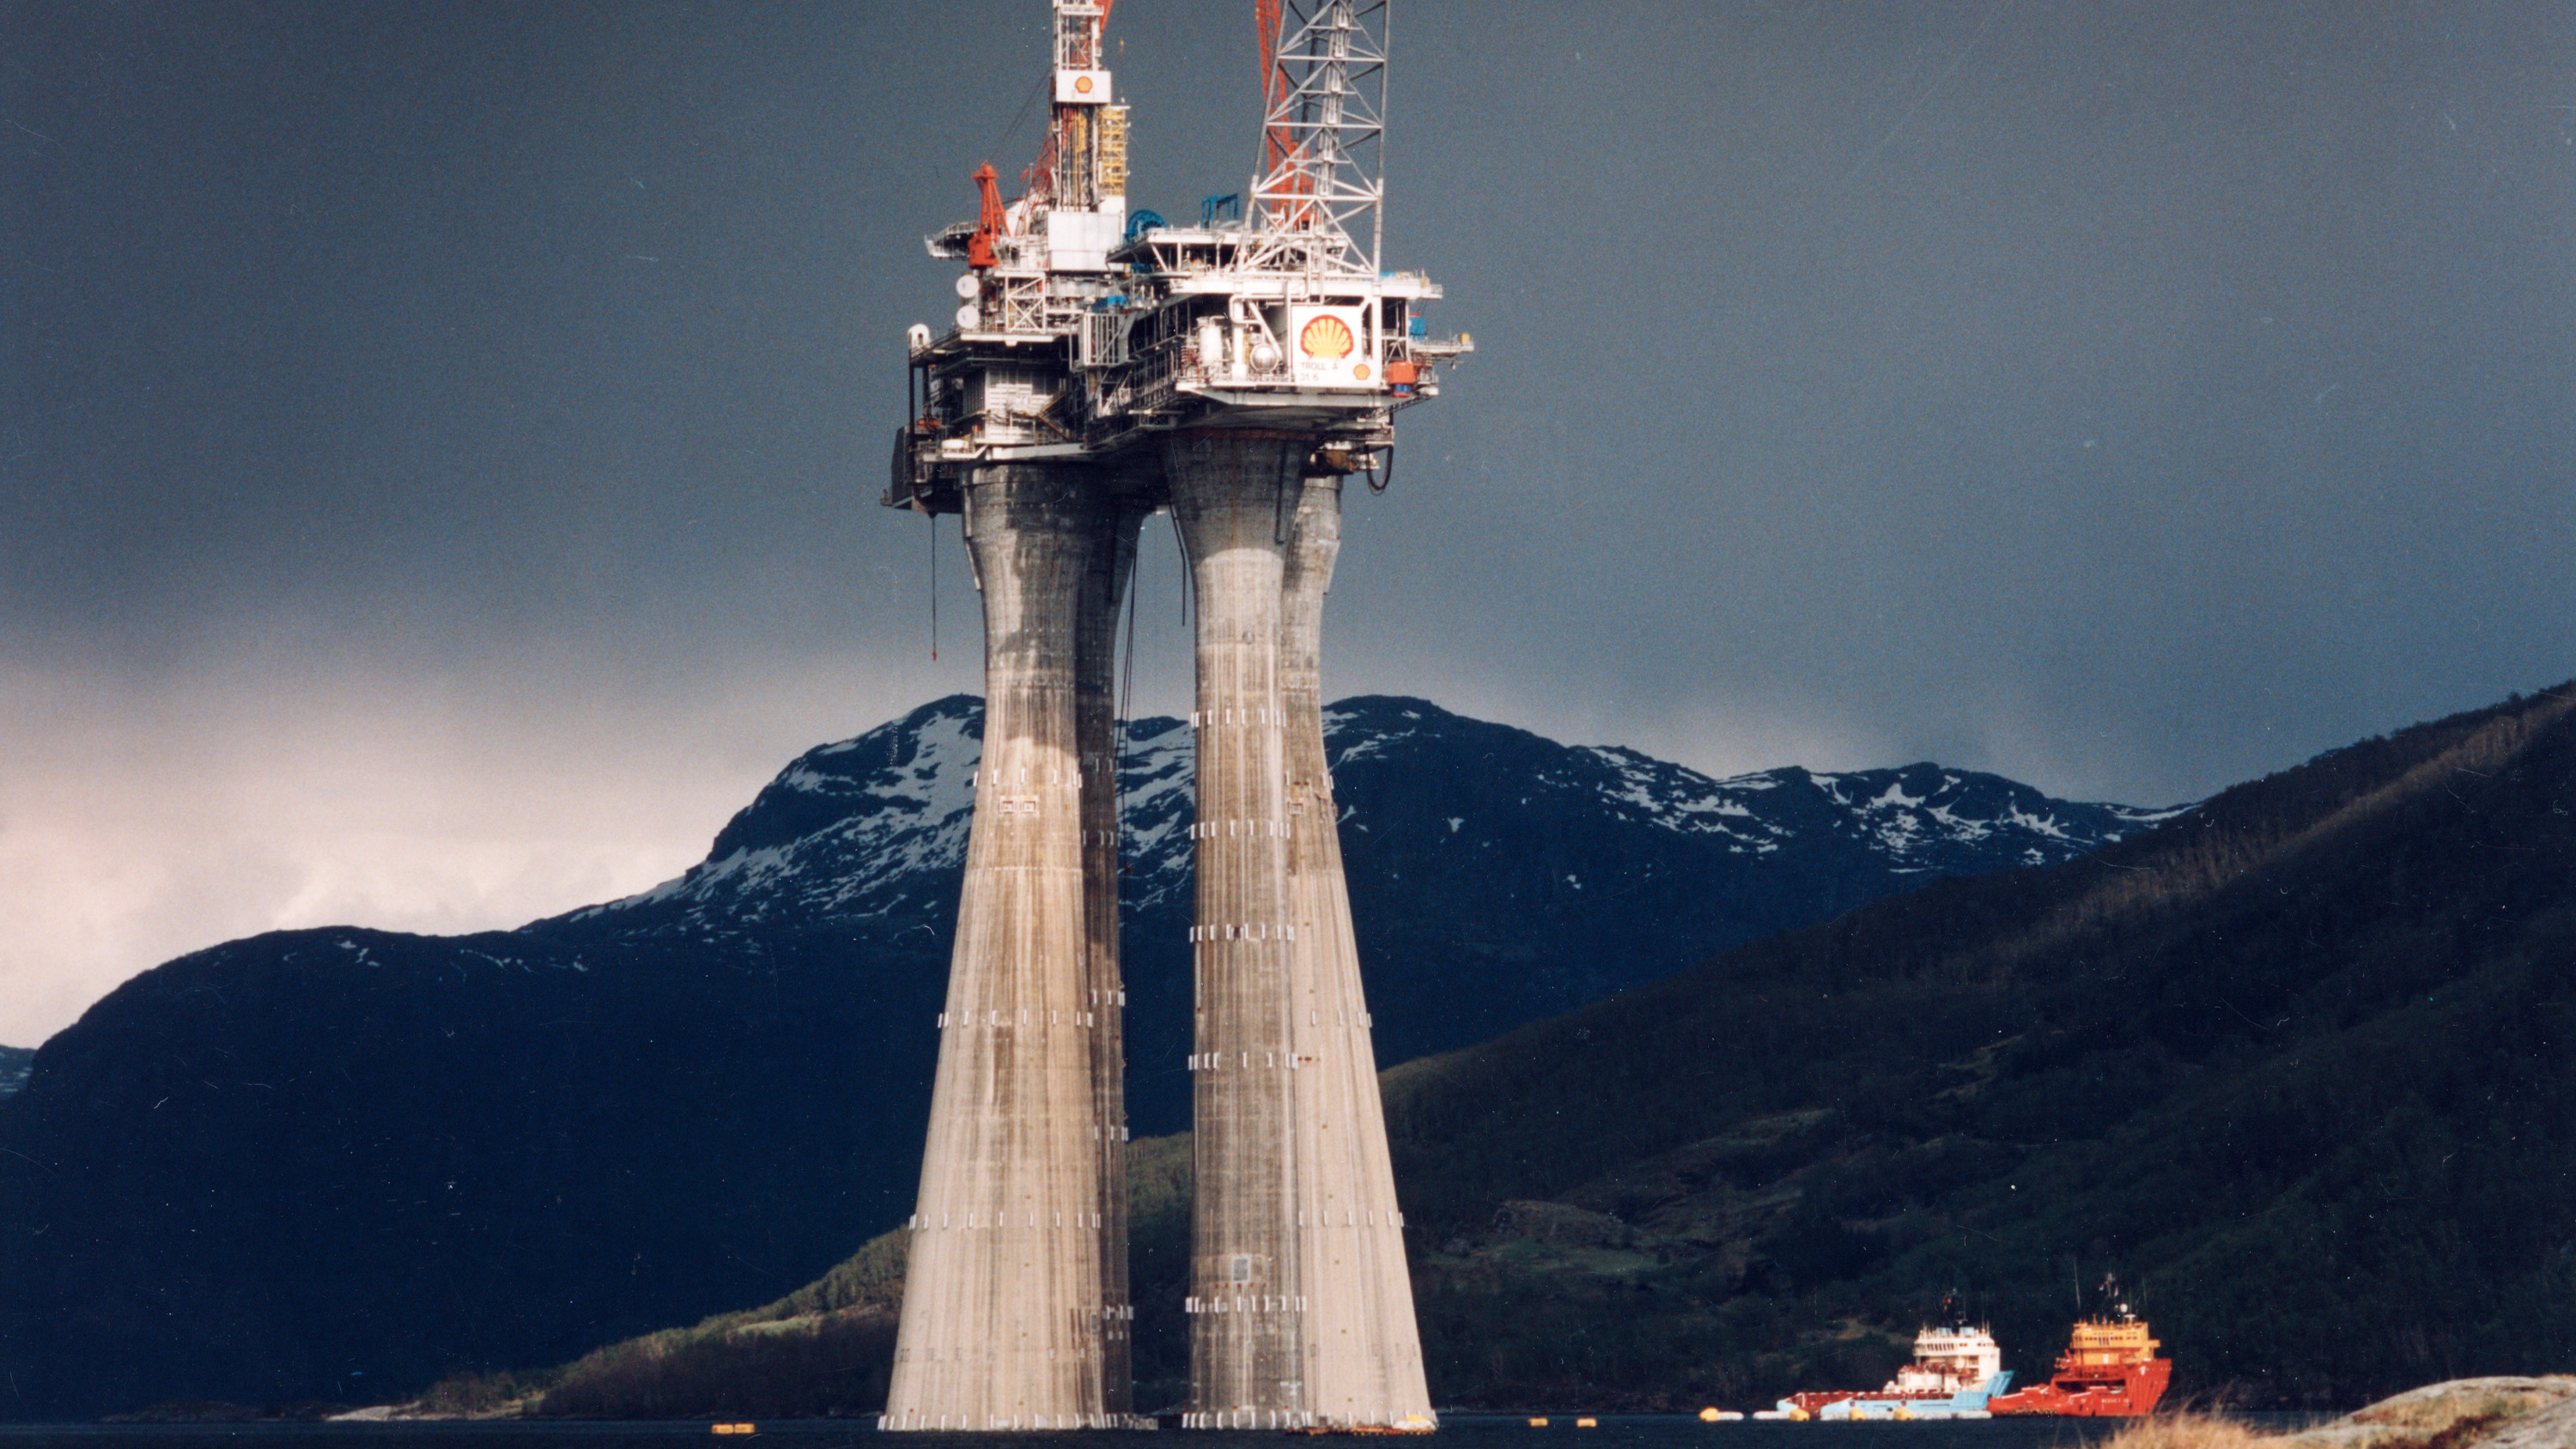
Good article from our friends at the Petroleum Safety Authority of Norway. When old guys reminisce, people need to listen 😉
“Reagan feared that the world, and especially Europe, would become too dependent on Soviet gas, and saw Troll as an opportunity to create greater independence.”
“Lerøen sees parallels to the current situation, with Russia’s invasion of Ukraine, and the importance Norwegian gas has for the EU, which wants to become independent of Russian gas.”
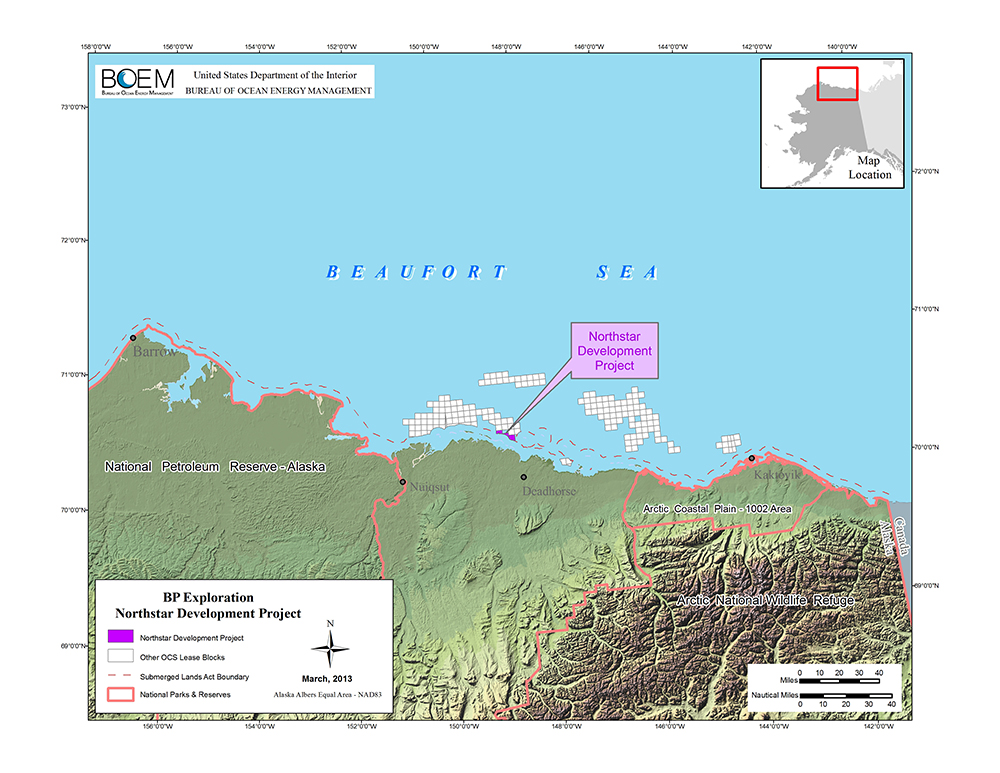
The only current Alaskan OCS production is from Northstar, a joint State-Federal Unit in the Beaufort Sea. The production island is in State waters, but 7 of the wells produce from the Federal sector. The field was originally developed by bp, but Hilcorp is the current operator. To date, BSEE has conducted 5 inspections of the facility in 2022, and no incidents of noncompliance (INCs) were identified.
Per BOEM records, 4 companies operate Pacific (California) OCS facilities that are currently producing. Three of those operators have superior 2022 inspection records. No INCs were issued to either Exxon (11 Santa Ynez Unit inspections) or Freeport-McMoRan (24 Platform Irene inspections). Only 2 warning INCs were issued during 12 inspections of Beta Operating Co. platforms Ellen, Elly, and Eureka in the Beta Unit offshore Long Beach.
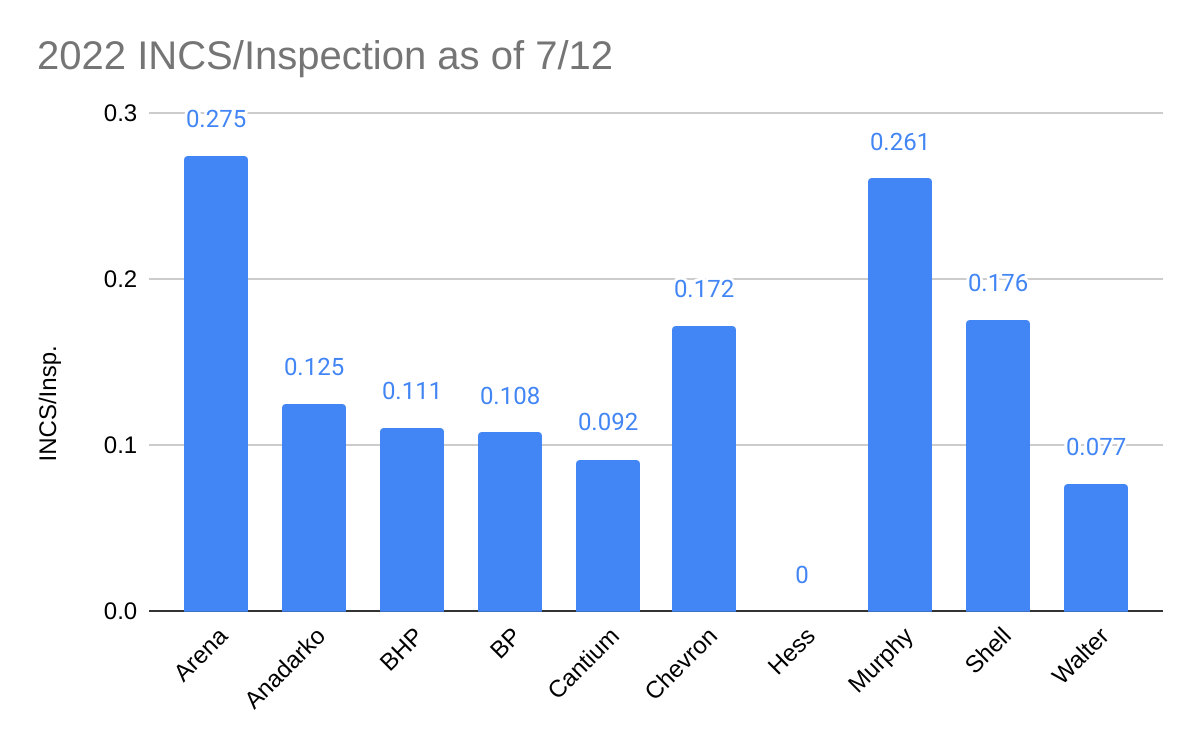
Operating companies (listed alphabetically): Arena, Anadarko (Oxy), BHP, bp, Cantium, Chevron, Hess, Murphy, Shell, and Walter
Criteria:
Must average <0.3 incidents of compliance (INCs) per inspection. (This is less than half the GoM 2022 YTD average of 0.64 INCs/inspection.)
Must operate at least 3 production platforms.
Must have drilled at least one well.
Pacific and Alaska operations will be considered in a separate post.
Comments:
Impressive performance by Hess: 21 inspections and no INCs
Cantium and Walter averaged less than 0.1 INCs/inspection. The INC rates for Anadarko (Oxy), BHP, and BP were only slightly higher.
Among the Honor Roll companies, Shell (highest production, 9 deepwater platforms, and 13 well starts) and Arena (115 shelf platforms and 12 well starts) were the deepwater and shelf activity leaders.They thus had the highest INC exposure.
Although CSI and FSI INCs are typically more significant than W INCs, that is not always the case, so the INCs have not been weighted by type.
As has been previously noted, more inspection data should be readily available online. At a minimum, the specific INC (type) numbers (e.g. P-103, G-110, etc) should be posted so the public can better assess performance. Absent this information, interested parties are left to speculate about the significance of the violations.
While compliance is not synonymous with safety, most experienced observers believe there is a strong correlation. In the 1990’s, John Shultz, a PhD candidate at Carnegie Mellon Univ., studied US offshore facilities and safety data and developed expert and regression models to predict the likelihood of accidents and spills. That was a data rich era in that there were ~4000 US offshore platforms (more than twice the current number) and ~100 well starts/month (>10 times the current rate). In John’s thesis, he found that INCs are a very good predictor of accidents and spills. The offshore world has changed and further study of the correlation between compliance and safety performance is highly recommended.
Chevron may be the only GoM operator to own its helicopter fleet. Data on their safety performance relative to GoM helicopter contractors do not appear to be available online.
Their news release focuses on hurricane preparedness and the benefits of owning their fleet. I’m not sure how significant these advantages are given that other companies can ensure similar availability through their contracts. A comparative analysis would be of interest.
“Other companies that depend on contracted helicopters to evacuate can’t create their own schedule and might have to start departing the platform days in advance,” said Jose Jaramillo, manager of Chevron’s aircraft operations in the Gulf of Mexico. “With our own helicopters on standby, we have more flexibility in determining when to safely shut down the platform, and after the storm passes, we can quickly remobilize, assess our facilities and bring production back online days faster.”
The leading causes, not all inclusive, of the accidents since 1999 are listed below, and secondary causes of these events include 13 related to helideck size or design related issues. • 21 engine related, • 25 loss of control or improper procedures, • 18 helideck obstacle strikes, • 13 controlled flight into terrain, and • 12 other technical failures
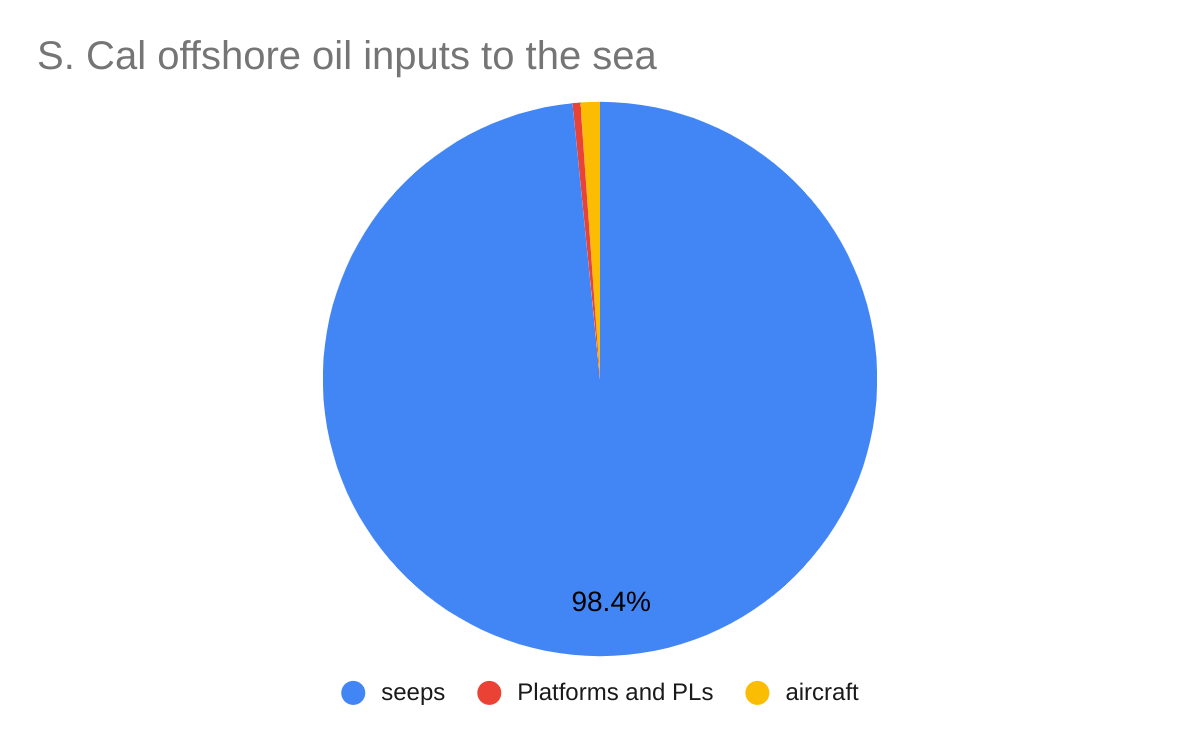
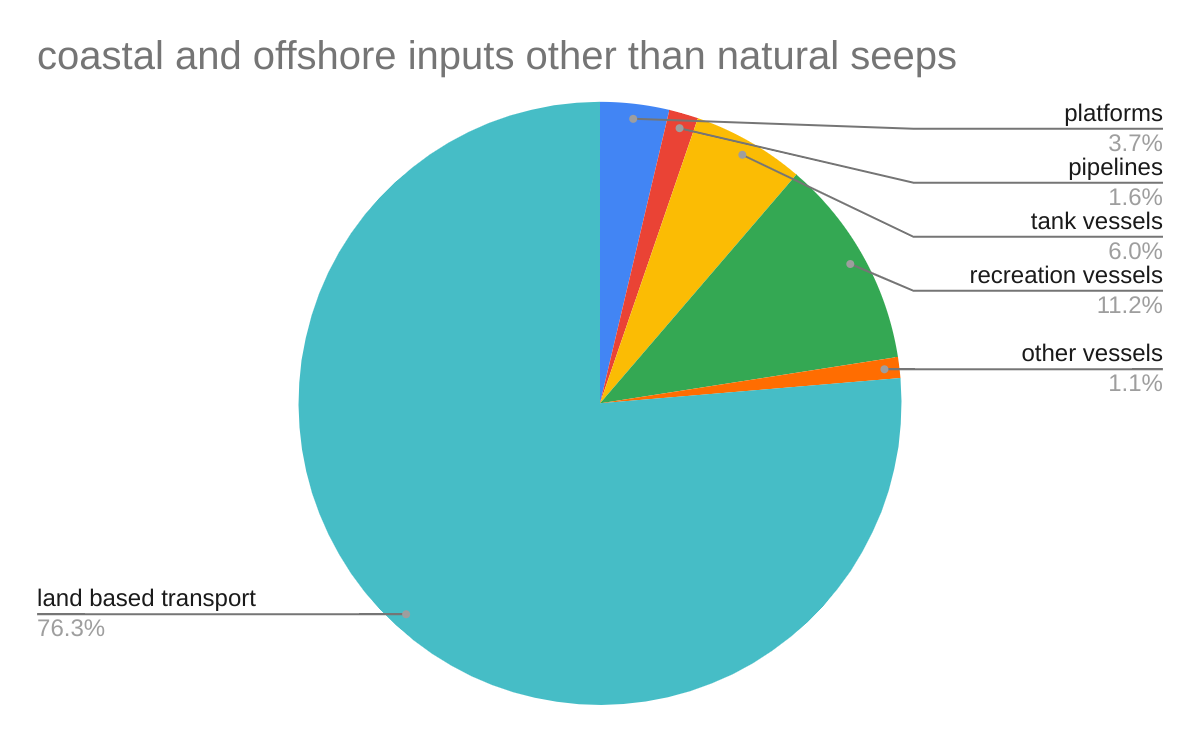
One of our very savvy BOE readers shared data (attached) from Oil in the Sea III, a National Academies report that is the best source of information on oil inputs into US waters. The data for Southern California are presented below in 3 charts. The first chart shows that natural seeps are overwhelmingly the leading offshore source of oil entering SoCal waters, with offshore platforms and pipelines accounting for <0.5% of the oil.
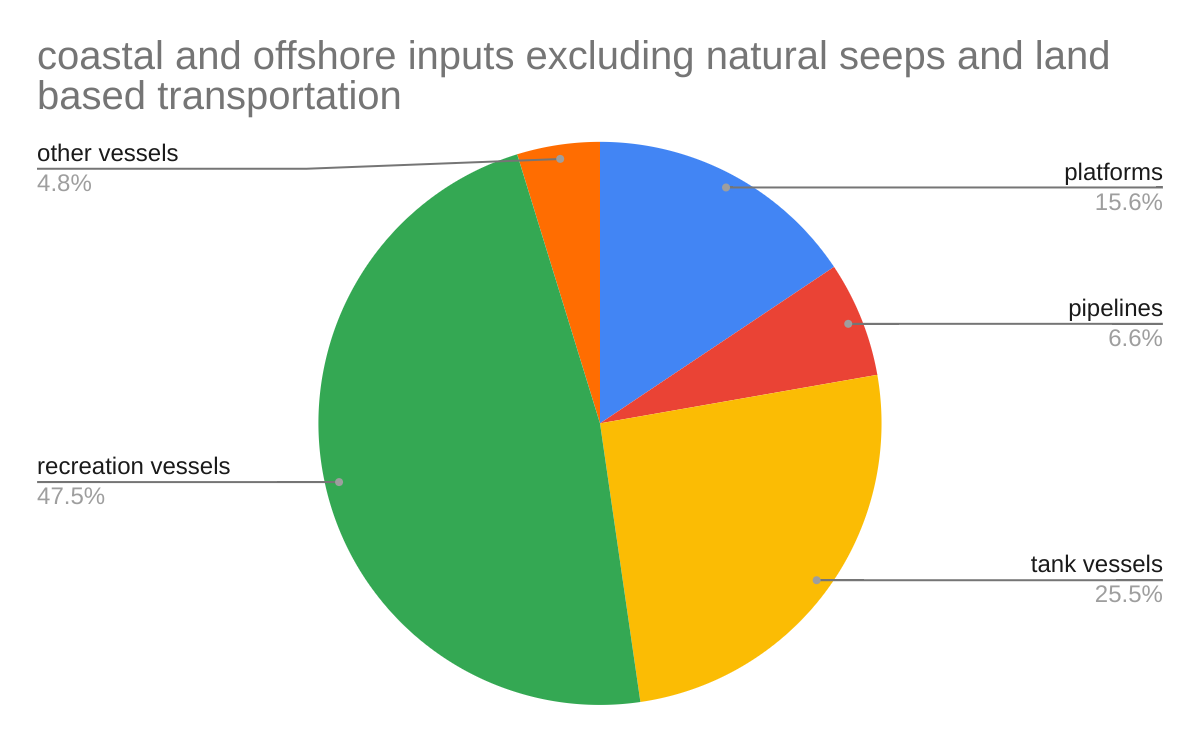
The second and third charts exclude natural seepage and compare the coastal and offshore oil inputs from the other sources. When land based transportation inputs are included (chart 2), platforms and pipelines (combined) account for 5.3% of the oil.
Excluding natural seepage and land based transportation inputs (chart 3), recreation vessels are by far the leading source of oil (47.5%), with platforms and pipelines (combined) accounting for less than half that volume (22.2%).
These data add important perspective, but are not intended to discount platform and pipeline spills. These spills can have significant localized impacts, and every effort must be made to prevent their occurrence.