The Supreme Court will hear a case that could significantly scale back federal agencies’ authority, with implications for regulations affecting the US offshore program. The court could overturn a precedent known as the “Chevron doctrine” that instructs judges to defer to federal agencies when interpreting ambiguous federal laws.
Few Supreme Court doctrines have been stretched more by regulators and lower-court judges than Chevron deference, which says judges should defer to regulators’ interpretations when laws are supposedly ambiguous. The High Court agreed Monday to give Chevron a much-needed legal review.
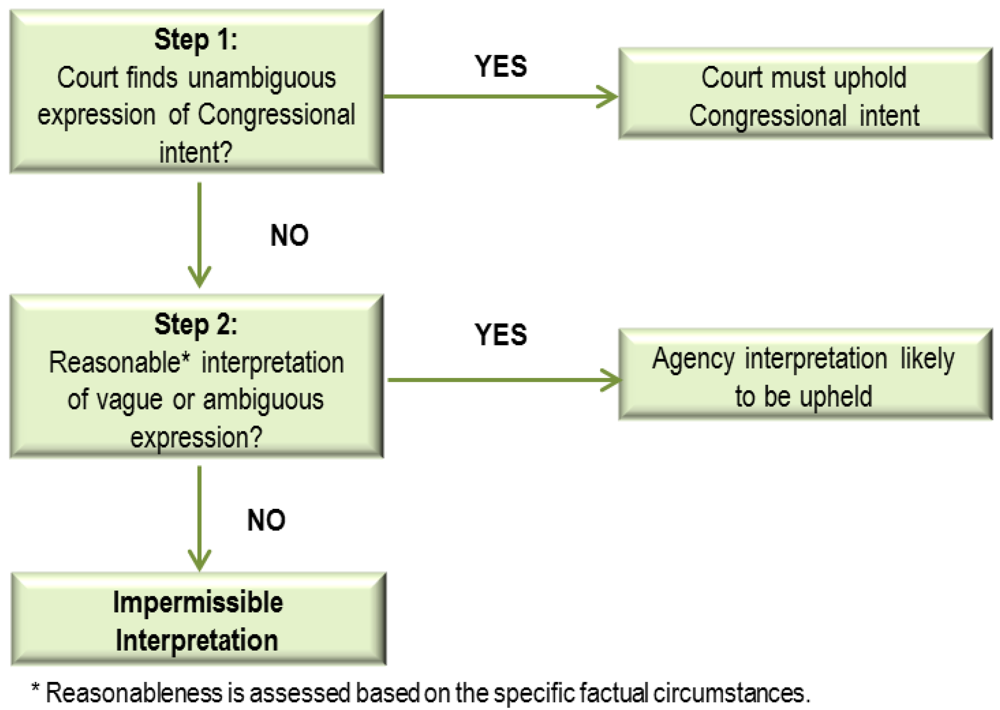
One of the most important principles in administrative law, the “Chevron deference” was coined after a landmark case,Chevron U.S.A., Inc. v. Natural Resources Defense Council, Inc., 468 U.S. 837 (1984). The Chevron deference is referring to the doctrine of judicial deference given to administrative actions. In Chevron, the Supreme Court set forth a legal test as to when the court should defer to the agency’s answer or interpretation, holding that such judicial deference is appropriate where the agency’s answer was not unreasonable, so long as Congress had not spoken directly to the precise issue at question.
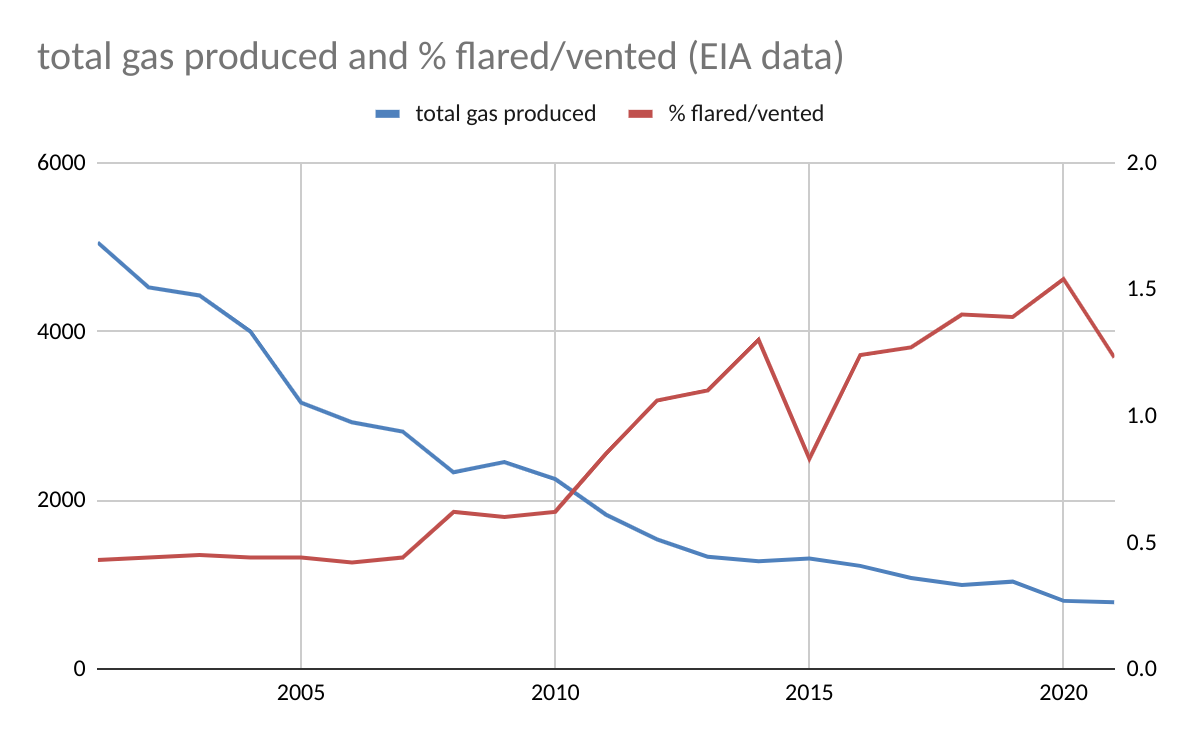
According to EIA data for 2001-2021, Gulf of Mexico flaring and venting volumes peaked in 2001 at 21.6 bcf, 2.25 times the volume flared or vented in 2022 (ONRR data for 2022). However, gas production in 2001 was 5.05 tcf, 6.4 times higher than in 2022. The % of the produced gas that was flared or vented in 2001 was thus 0.4%, less than 1/3 the 2022 rate of 1.22%.
Points to consider:
In 2001, gas production was mostly from gas wells, which have lower flaring/venting rates. As gas production declined because of lower gas-well gas (GWG) production, flaring/venting rates increased (see the chart below). This would account for some of the difference in flaring/venting rates (2001 vs. 2022). However, in recent years, the % of gas-well gas flared or vented has been between 0.3 and 0.5% which is comparable to the rate for all gas production (0.4%) in 2001. So the reduction in GWG production is not the entire reason for the higher flaring/venting rates in recent years. Hence the need for more transparency on flaring/venting performance.
Oil-well gas (OWG) production alone in 2001 (923 bcf) was higher than total gas production (784 bcf) in 2022. If the oil-well gas (OWG) flaring/venting rate was the same as the recent rate for OWG (1.2-1.5%), the volume of gas flared or vented from OWG alone (only 18% of total gas production in 2001) would have accounted for 11.1 – 13.8 bcf or 51-64% of the total volume flared/vented in 2001.
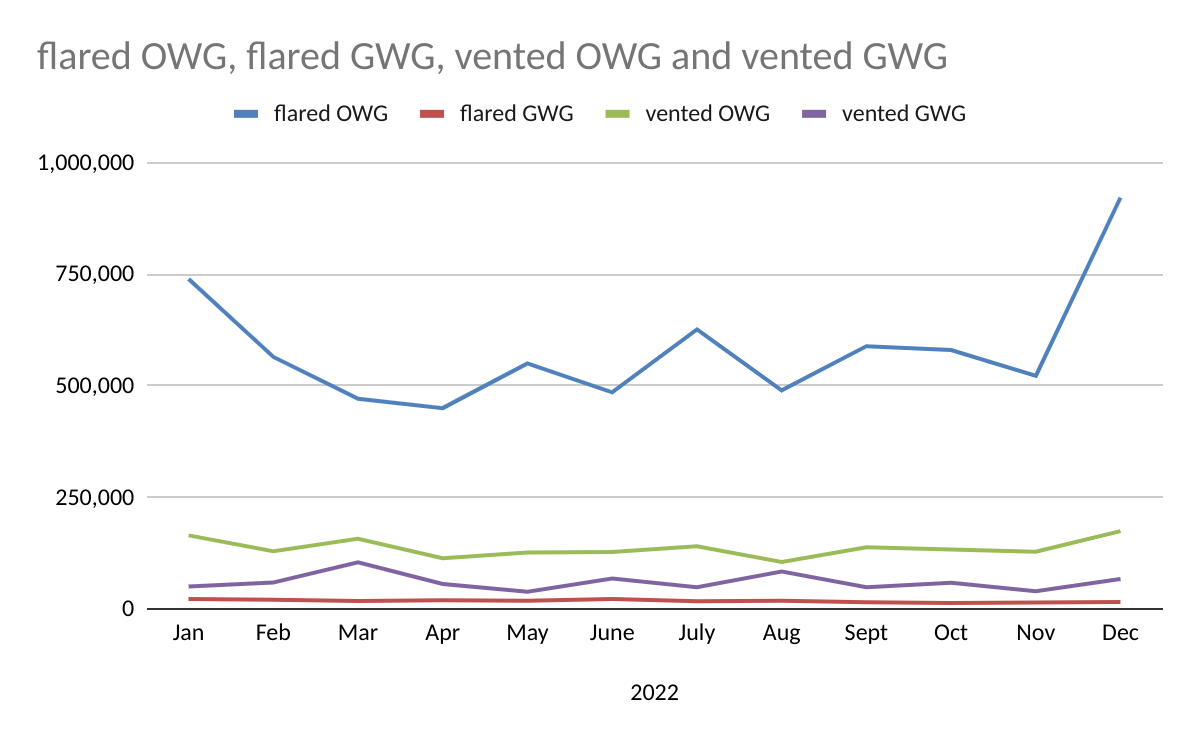
A very large increase in OWG flaring in December skewed the 2022 data (921 million cu ft vs 522 million in November, see 2nd chart below). OWG vented and gas-well gas (GWG) vented also spiked in December (third chart). Were these spikes associated with production startups, major compressor issues, administrative/accounting corrections, or other issues?
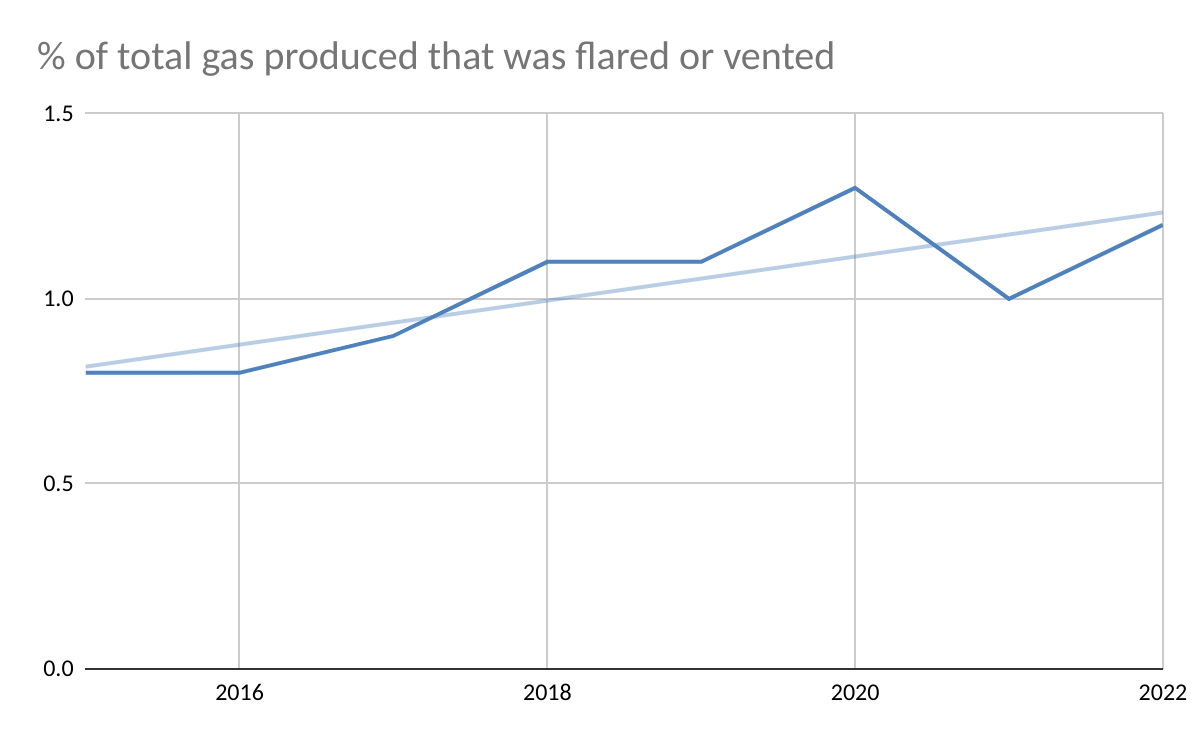
Although total venting increased by 407 million cu ft (21%) in 2023 vs. 2022, the overall venting trend is still favorable (last chart).
Kudos to ONRR for posting the flaring/venting data.
More regulator/industry transparency on flaring episodes is needed, particularly in light of the PNAS paper and the June 2022 Inspector General Report.
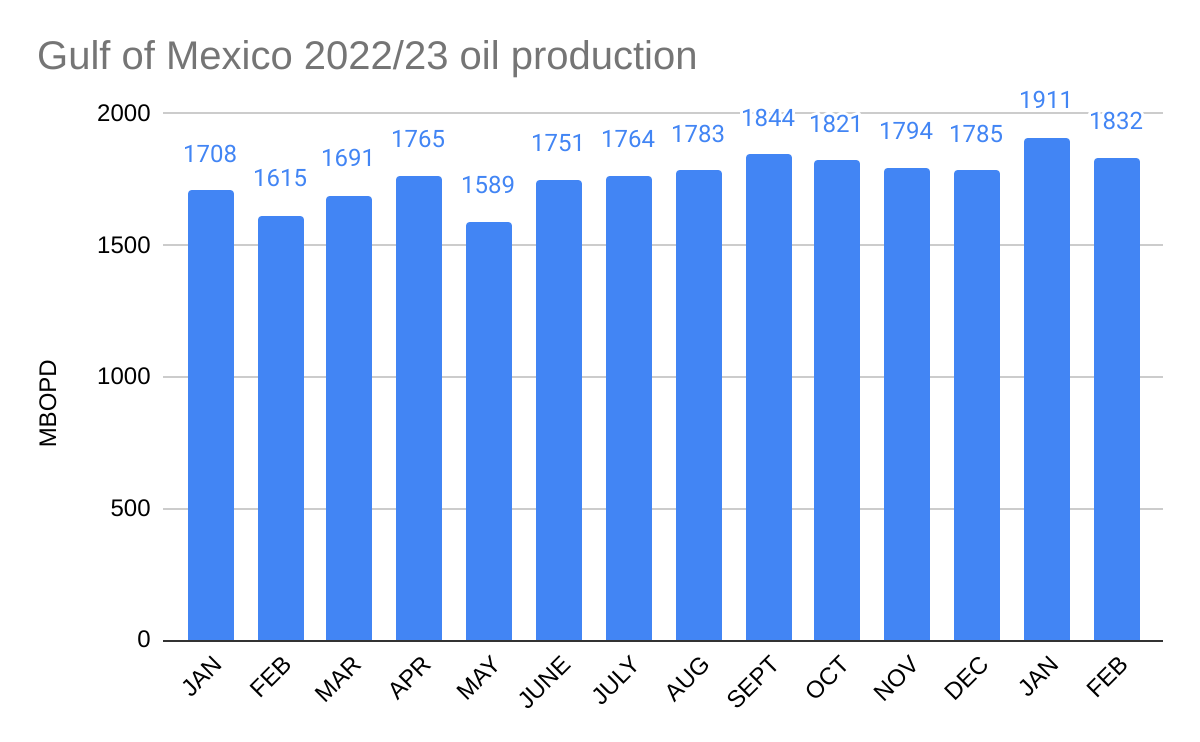
Industry consultancy Rystad Energy estimates Guyana will be pumping 1.7 million barrels per day by 2035, which is higher than other major offshore basins including the Gulf of Mexico, ranking the country as the world’s fourth largest offshore oil producer.
The GoM is currently producing >1.8 million bopd. If Rystad/OilPrice intended to say that Guyana production will exceed GoM production in 2035, that could be the case. However, sustained GoM production in 2035 could easily be >1.7 million bopd with proper resource management by government and industry. In fact, BOEM’s latest forecast (table below) calls for production >1.8 million bopd in 2031, the last year in their forecast.
Old York Road near West Olney Avenue. December 14th, 1914.
I saw this old picture and was intrigued by the “Mobiloils” sign. I didn’t think Standard of New York had already evolved into Mobil in 1914. A couple of Wiki excerpts explain:
Following the break-up of Standard Oil in 1911, the “Standard Oil Company of New York” (or ‘Socony’) was founded, along with 33 other successor companies.
Socony merged with Vacuum Oil Company to form Socony-Vacuum. Vacuum Oil had used “Mobiloil” automobile lubricating oil brand since 1904, and by 1918 it became recognizable enough that the company filed it for registration as a trademark (it was registered in 1920)
Korea President Yoon Suk Yeol sings “American Pie” by Don McLean during entertainment portion of State Dinner with President Biden. pic.twitter.com/M91Tj4WrHa
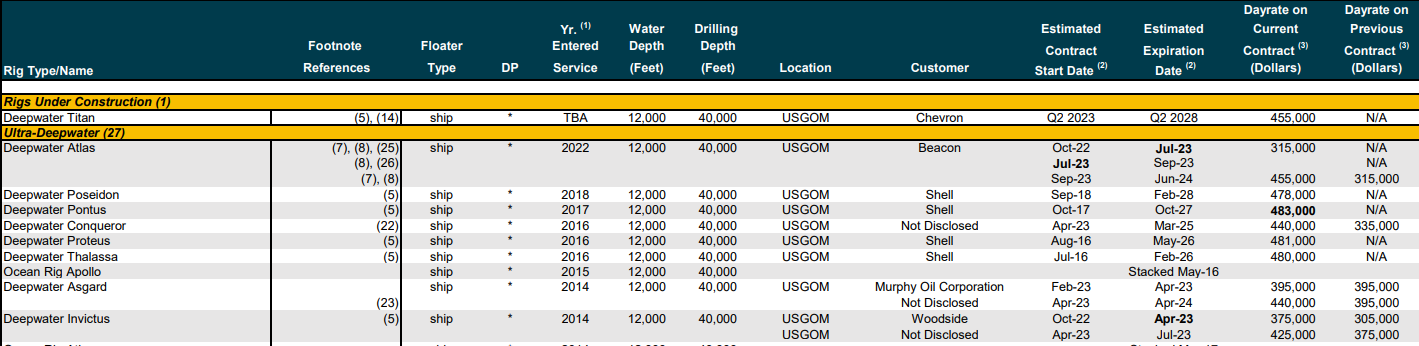
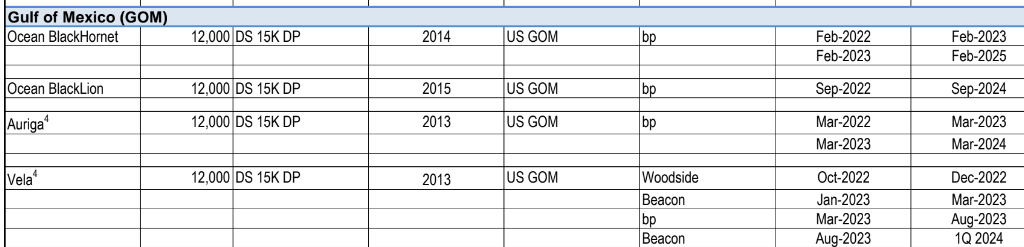
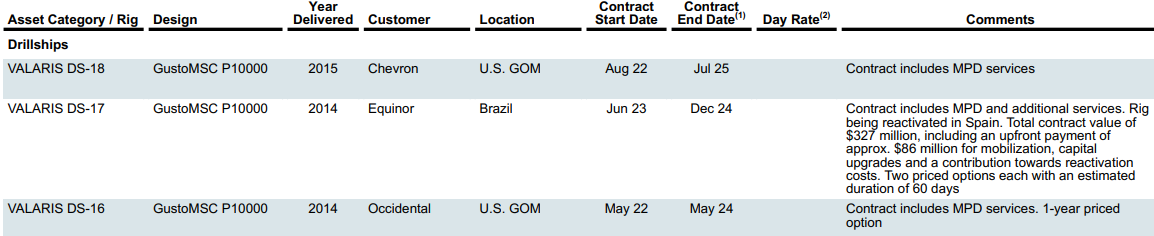
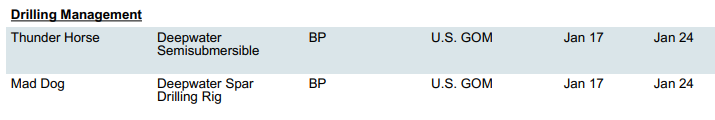
Based on drilling contractor rig activity reports, the table below lists 19 deepwater MODUs under or soon to begin contracts in the GoM. (Further details are pasted at the end of this post.) Per the Valeris report, platform rigs are operating on bp’s Thunder Horse and Mad Dog platforms. Per the BSEE borehole file, Arena and Cantium continue to drill development wells on the GoM shelf.