Feeds:
Posts
Comments

Archive for the ‘Gulf of Mexico’ Category

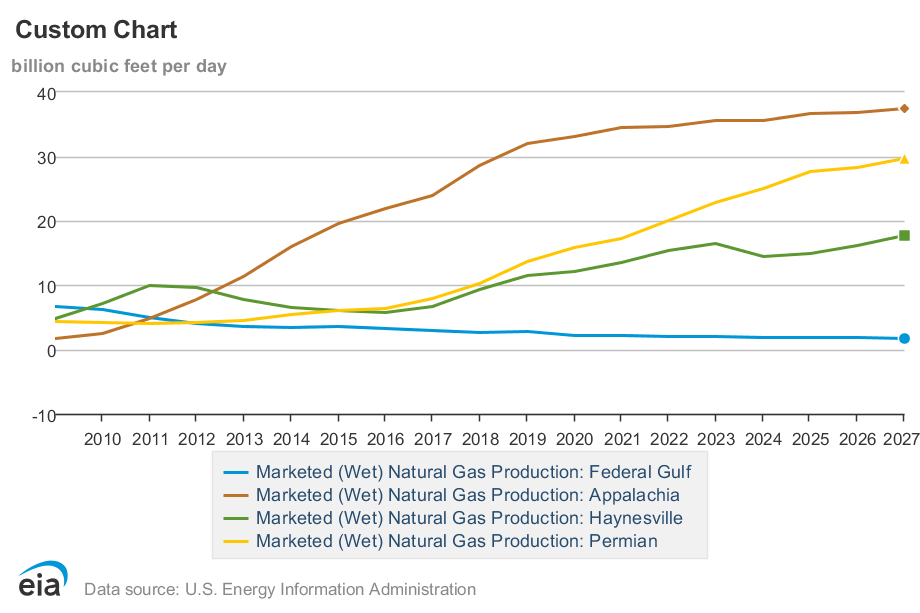
Per EIA data, the Appalachia, Permian, and Haynesville regions accounted for 67% of the total marketed gas production in the US in 2025 and 81% of the growth last year.

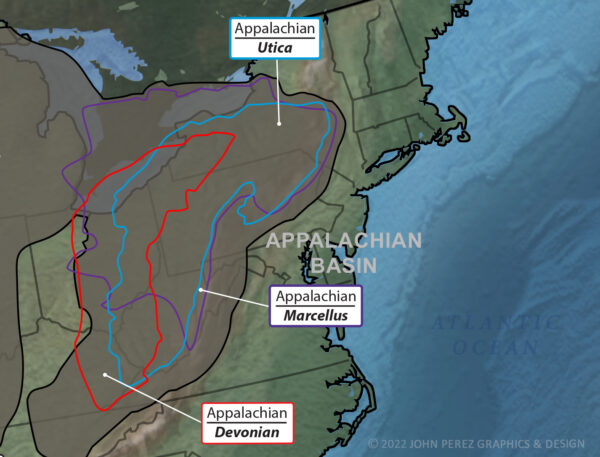
In 2025, more natural gas was produced in the Appalachia region of the Northeast than in any other US region, accounting for 31% of marketed natural gas production. (See the chart below.) Were it not for pipeline capacity limitations, recent growth in Appalachia production would have been greater.

Appalachia production is primarily from the Marcellus and Utica shales in PA, WV, and Ohio.

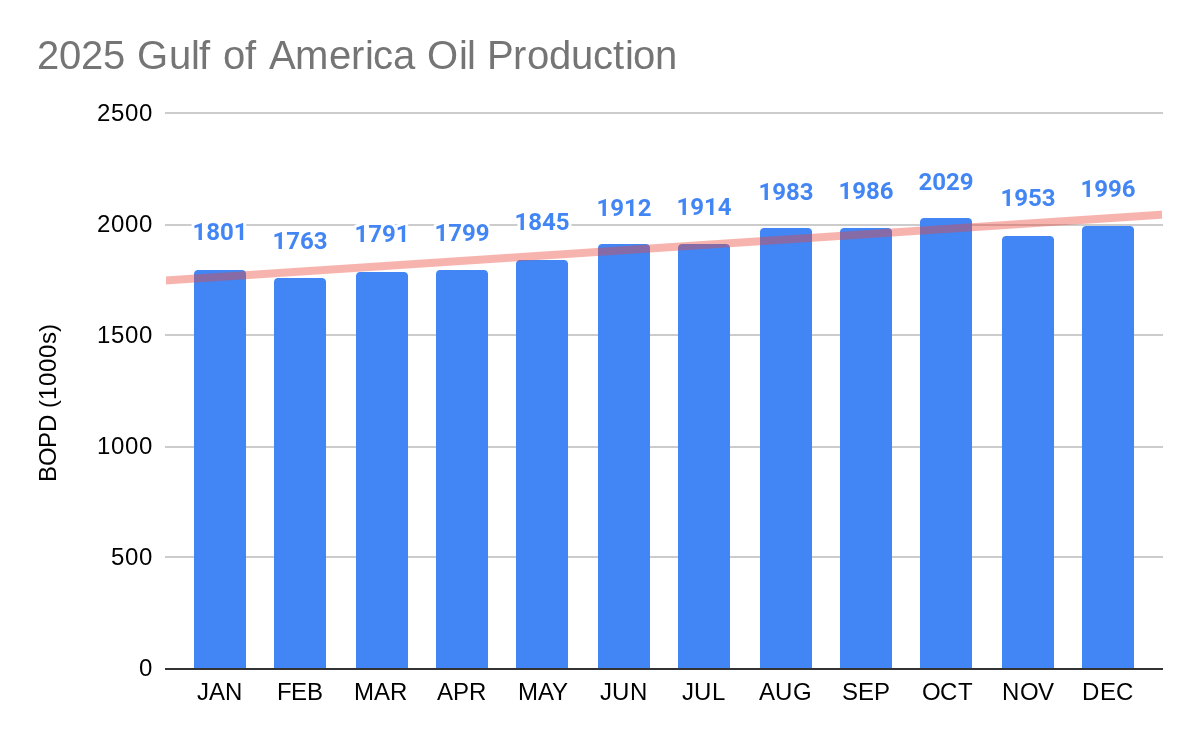
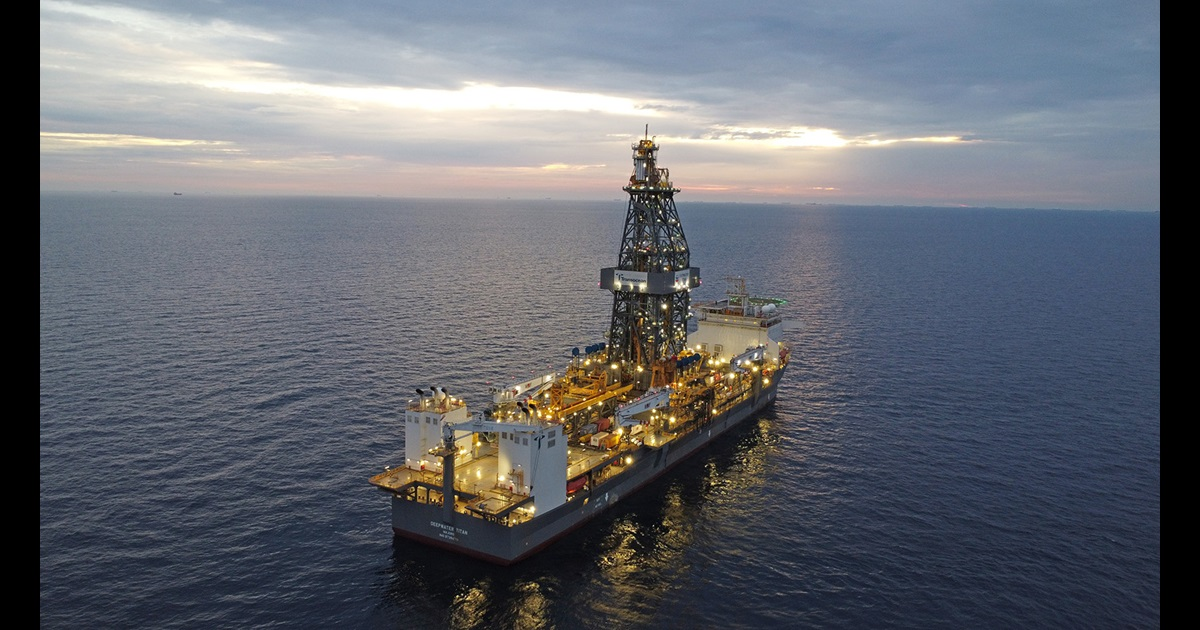
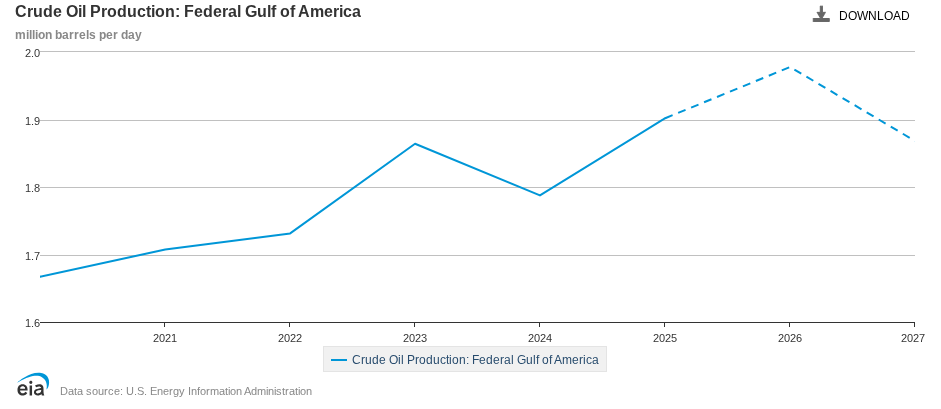
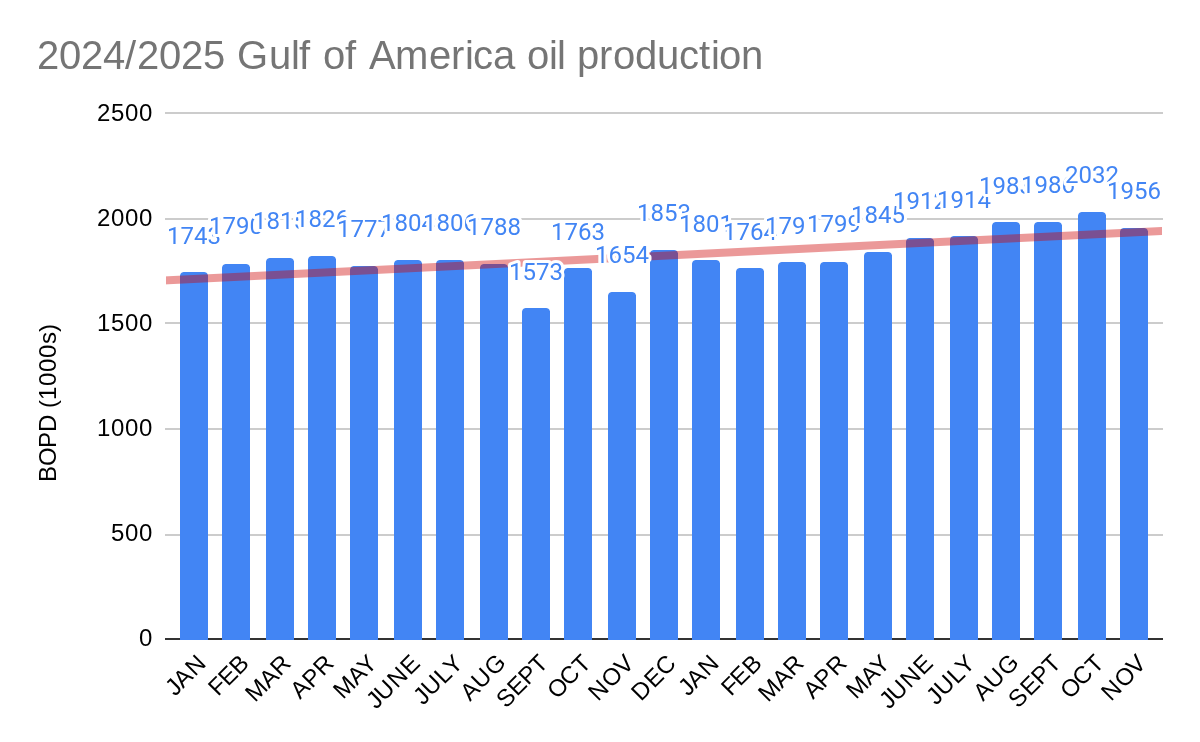
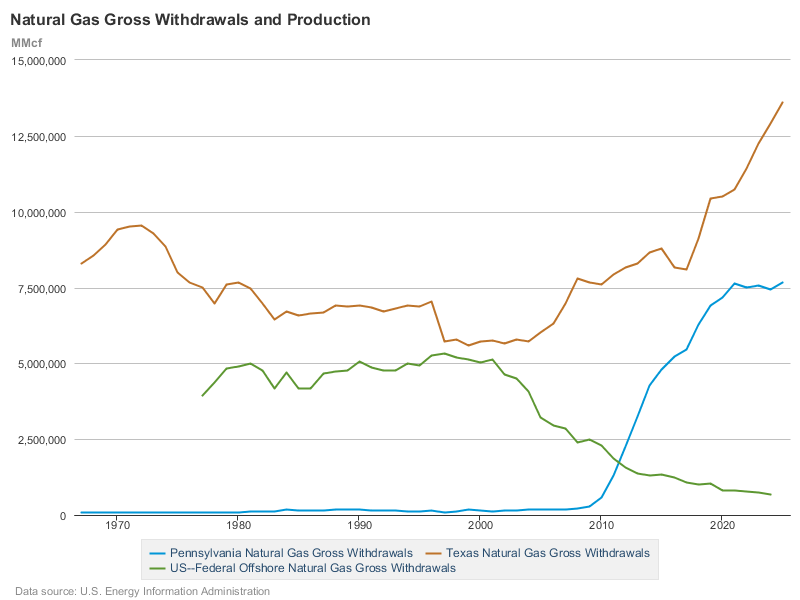
OCS gas production, 80% of which is now associated gas from deepwater oil wells, continues to lag the shale basins. This is a big change from 25 years ago when the OCS produced more gas than any state but Texas. (See the chart below.) Interest in ultradeep (subsurface) OCS shelf gas prospects remains scant despite favorable demand forecasts and technological advances.

.

Meanwhile, New York continues to block development of the State’s ample shale gas resources. foregoing the economic and environmental benefits.

Read Full Post »

red=blocks receiving bids at BBG2; blue=BBG1 and Sale 261 leases; green=active leases issued prior to Sale 261

Although bidding at Sale BBG2 was rather subdued, Gulf heavyweights BP, Chevron, Shell, and Oxy/Anadarko, along with increasingly important Woodside Energy, competed for the 4 red blocks in the Green Canyon area (map above and table below). These elephant hunters presumably see excellent Paleogene (Wilcox) prospectivity in those blocks.

17 of the sale’s 38 bids (45%) and $32.8 milion of the sale’s $47 million in high bids (70%) were for these 4 blocks. BP’s $21 million bid for GC 404 was by far the sale’s highest bid.

Green Canyon
Block No.
No. of biddersHigh BidderBid
4045BP$21,009,990
4052BP$885,99
4485Chevron$4,967,067
4925Chevron$5,887,188

At this time, the high costs and technical complexities (e.g. deepwaterand high pressure/high temperature reservoirs) limit Wilcox development to major oil companies and well financed, technically savvy independents. Expect some of the international majors that did not participate in BBG2 to acquire lease interest at a later date, which will again raise questions about the merits of joint bidding restrictions.

From AAPG graphic-Wilcox trend map. Eastern area can be subdivided into an outboard and inboard trend, with wells in the latter area showing variable thickness due to salt tectonics contemporaneous with deposition (From Zarra et al. 2019’s AAPG Search and Discovery article).

Imbedded below is a good presentation on the Paleogene Wilcox by Dr. Mike Sweet, Univ. of Texas:

Read Full Post »

Only 13 companies participated in the lease sale:

  • Chevron .
  • Shell
  • Walter
  • Houston Energy
  • LLOG (now owned by Harbour Energy)
  • Oxy/Anadarko
  • Woodside
  • BP
  • Red Willow
  • Focus Exploration
  • Renaissance Offshore
  • Navitas Petroleum
  • CL&F Offshore

The No-Shows:

US supermajors once active in the Gulf that have become perennial No-Shows:

  • Exxon
  • ConocoPhillips

International majors with a Gulf presence:

  • Equinor
  • Eni
  • Total
  • Petrobras
  • Repsol

Typically active independents

  • Arena
  • Cantium
  • Beacon Offshore
  • Talos
  • Kosmos
  • Murphy

Why was the participation so poor?

  • Only 3 months between BBG1 and BBG2
  • Lease sale certainty reduces urgency
  • Concerns about longer term policy changes?
  • Mergers reduce participation and competition?
  • New ownership, change in priorities?
  • More limited geologic prospectivity?

It would be helpful to hear from some of the companies that chose not to participate.

Read Full Post »

Although no one was expecting a barnburner only 3 months after the previous sale, BBG2 was historically weak for a Gulf-wide sale. The table below compares BBG2 with the previous 4 Gulf sales, none of which were particularly impressive.

However, the sale was not without highlights. There was some spirited bidding for tracts in the Green Canyon area. BP’s bid was the highest of 5 for GC Block 404. BP bid $21 million for the block, 45% of the high bids sum for the entire sale. The BP bid was also $20 million higher than the next highest bid for that tract (ouch!).

Also interesting was Chevron edging Shell $5,887,188.00 to $5,501,240.00 to acquire GC Block 492.

Sale No.257259261BBG1BBG2
date11/17/20213/29/202312/20/202312/10/20253/11/2026
companies
participating
3332263013
total bids22332842316121938
tracts receiving bids21432442275118125
sum of all bids
$millions
198.5309.8441.9371.969.9
sum of high bids
($millions)
101.7263.8382.2279.447.0
highest bid
company
block
$10,001,252
Anadarko
AC 259
$15,911,947
Chevron
KC 96
$25,500,085
Anadarko
MC 389
$18,592,086
Chevron
KC 25
$21,009,990
bp
GC 404
most high bids
company
sum ($millions)
46
bp
29.0
75
Chevron
108.0
65
Shell
69.0
50
bp
61.0
6
Anadarko (Oxy)
4.0
sum of high bids ($millions)
company
47.1
Chevron
108
Chevron
88.3
Hess
61.0
bp
22.6
bp
most high bids by independent14-DG Expl.13-Beacon
13-Red Willow
22-Red Willow14-Murphy5-LLOG
1excludes 36 leases improperly acquired for carbon disposal purposes; 2excludes 69 leases improperly acquired for carbon disposal purposes; 3excludes 94 leases improperly acquired for carbon disposal purposes

For historical comparison purposes, Gulf Sale 206 drew $3.7 billion ($5.6 billion in today’s dollars) in 2008. Twenty-siz sales between 1972 and 2013 garnered more than $1 billion in high bids.

Sale stats

Read Full Post »

Gulf of America oil and gas lease sale BBG2 will be held tomorrow. The Notice of Sale is attached.

Although Big Beautiful Gulf 1 (BBG1) was rather lackluster, BBG 2 is unlikely to match it in terms of the number of bids and their sum. Prior to BBG1, there had been no lease sale for two years. BBG 2 is being held only 3 months later.

Given the short duration between sales, the bid evaluations for BBG1 are not yet completed. However, the sale notice advises that any block which received a bid in BBG1 is excluded from BBG2.

Will the recent increase in oil prices influence bidding? Probably not given the longer term nature of offshore development and expectations that the current price spike will be of short duration. Onshore shale oil production is more responsive to price fluctuations.

Read Full Post »

December 2025 Gulf oil production had to average 1.993 million bopd for 2025 to match the 2019 record. It exceeded that mark by 0.003 million bopd. However, October and November production were revised slightly downward resulting in a near dead heat annual average.

A closer look at the numbers (table below) shows that 2025 edged 2019 by a mere 250 bopd. Amazing!

Major caveat: The Nov and Dec 2025 figures will likely be revised slightly when EIA releases the next update at the end of January. Fingers crossed!😀

Top 3 Yearsave. daily production (1000’s of barrels)
20251897.67
20191897.42
20231864

Read Full Post »

Deepwater Titan

Per Baker Hughes, the latest (2/20/2026) Gulf of America rig count (2/20/2026) slipped to 9. The count was 10 the previous week and 12 a year ago. In 2023 and 2024, the BH rig count was a more healthy 15-20.

8 of the 9 rigs currently drilling are at high potential deepwater locations: 3 in the Mississippi Canyon Area, 3 in Green Canyon, 1 in Walker Ridge, and 1 in Alaminos Canyon. One rig was drilling on the shelf in the Eugene Island Area.

Per MMS data, the active Gulf rig count in 2001 was 148. The 2001 count was not a one year blip; the number of rigs active in the Gulf exceeded 100 for the ten year period from 1994-2003.

Although drilling and production have become more efficient with improved exploration technology, modern well completion practices, high pressure/temperature equipment, and enhanced recovery programs, drilling activity must still be sufficient to replace reserves and sustain production over the longer term.

2025 may have been a record production year for the Gulf; we’ll find out at the end of this week. However, that level of production is not sustainable without increased drilling activity.

The EIA (chart below) is forecasting another banner year for Gulf oil production in 2026. However, they are pointing to a decline in 2027, when new production is not anticipated to be sufficient to offset natural declines. The decline in production is likely to continue beyond 2027 absent increased drilling.

BH rig count criteria: To be counted as active a rig must be on location and be drilling or ‘turning to the right’ for 4 out of 7 days during a week. A rig is considered active from the moment the well is ‘spudded’ until it reaches target depth or “TD”. Rigs that are in transit, rigging up, or being used in non-drilling activities such as workovers, completions, or production testing, are NOT counted as active.

Read Full Post »

On February 12, 2024, the bankruptcy court approved the sale of certain Cox Operating assets to Natural Resources Worldwide LLC (NRW), a company that had no prior offshore experience. NRW contracted with Array Petroleum to operate 154 Cox legacy platforms (per BOEM data). NRW is listed as the operator of just one platform.

In 2025, NRW/Array operations accounted for 486 incidents of non-compliance (INCs), 36.2% of the Gulf of America total. Array and NRW had INC/facility inspection rates of 2.1 and 7.0 respectively, well above the Gulf average of 0.42 and the top performers’ rates of 0.05 to 0.13.

In Array’s defense, their violations declined sharply in the second half of 2025. However, the number of inspections of their facilities declined even more sharply, so the INCs/facility inspection ratio actually increased in the second half.

For the 2025 data in the table below:W=warning, CSI=component shut-in, FSI=facility shut-in. The 3 numbers for Array in each box are full year 2025 data (top), first half 2025 (middle), and second half 2025 (bottom)

operatorWCSI
FSI
total INCs
Facility
Insp.
INCs/isp
Array352
311
41
93
46
47
6
6
0
451
363
88
218
184
34
2.1
2.0
2.6
NRW102413557.0

Three other companies had more than 10 shelf platforms and INC/facility inspection ratios >1.0: Greyhound Energy (23 platforms), Renaissance (21 platforms) and Sanare Energy (38 platforms).

operatorWCSIFSItotal INCs
facility insp
INCs/
fac.
insp
Greyhound Energy321033231.4
Renaissance Offshore2619347441.1
Sanare Energy6020282751.1

The table below provides 2025 oil and gas production through Oct (with Gulf of America rank) for the 5 companies mentioned in this post. In determining rankings, subsidiaries and affiliates were counted as a single company (e.g. Chevron, Unocal, and Hess counted as one company).

oil (bbls)oil rankgas (MCF)gas rank
Renaissance729,904191,220,43319
Array416,267211,197,91520
Sanare246,845251,763,55218
Greyhound182,65827280,42326
NRW101,11029104,02530

Read Full Post »

Tracts receiving bids in Sale BBG1

To date,BOEM has deemed 96 of the 181 BBG1 high bids to be acceptable. No high bids have been rejected. Although the sale was “beautiful but not big,” the bids were relatively strong on a per acre basis. The number of rejected bids may thus be quite low.

No bids were accepted during BBG1’s Phase 1 review. This means that none of the tracts receiving bids were determined to be nonviable as was the case for the 199 tracts that were improperly acquired for carbon disposal purposes in Sales 257, 259, and 261. (Unsurprisingly, neither of the acquiring companies has submitted an exploration plan for any of these CCS leases. The leases will likely expire without activity. Much to the dismay of the large and diverse group of opponents, the carbon disposal industry is focusing on onshore locations along the Gulf Coast.)

Meanwhile, a Cook Inlet lease sale is scheduled for March 4, and another Gulf of America sale will be held on March 11. Despite attractive terms, don’t expect either to be a banner “red jacket” lease sale. (See the John Rankin recognition below.)

More information on BOEM’s bid evaluation process.

Read Full Post »

Was 2025 the Gulf’s highest ever production year? We’ll find out in 3 weeks when EIA posts the December 2025 data.

November production dipped a bit putting the production record in doubt. December production had to average 1.993 million bopd to match 2019.

There are also typically small revisions for the prior two months, which could affect the outcome. It will be a nail-biter! 😉

Top 3 oil production years for Federal waters in the Gulf:

Top 3 Yearsave. daily production (1000’s of barrels)
20191898
2025 (through November)1889
20231864

Read Full Post »

Older Posts »