Minimizing flaring and venting is important from both environmental and resource conservation standpoints. Flaring and venting volumes are also good indicators of how well production systems are designed, managed, and maintained.
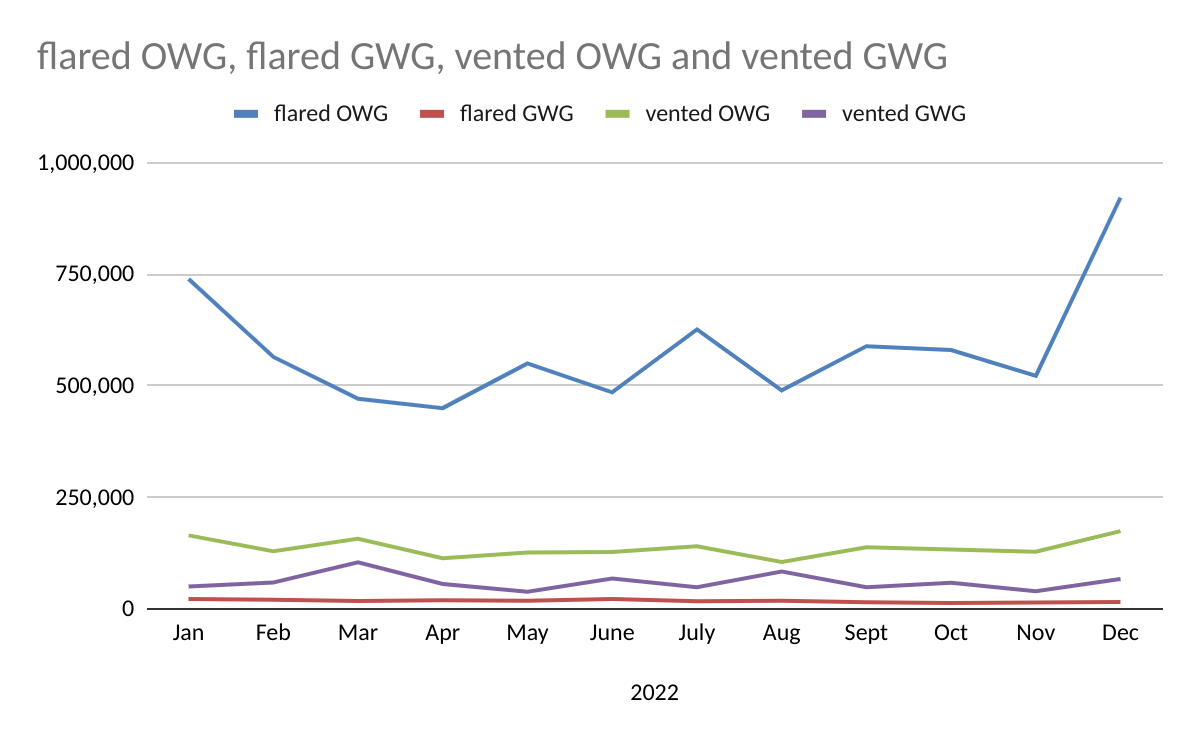
The best performance indicators are the percentages of produced gas that are flared and vented both for oil-well gas (OWG, also known as associated or casinghead gas) and gas-well gas (GWG or non-associated gas).
Updated flaring and venting volumes for the Gulf of America have been compiled using monthly data submitted to the Office of Natural Resources Revenue (ONRR). This is the best data source because reporting is mandatory and strictly enforced, and flaring and venting are accounted for separately.
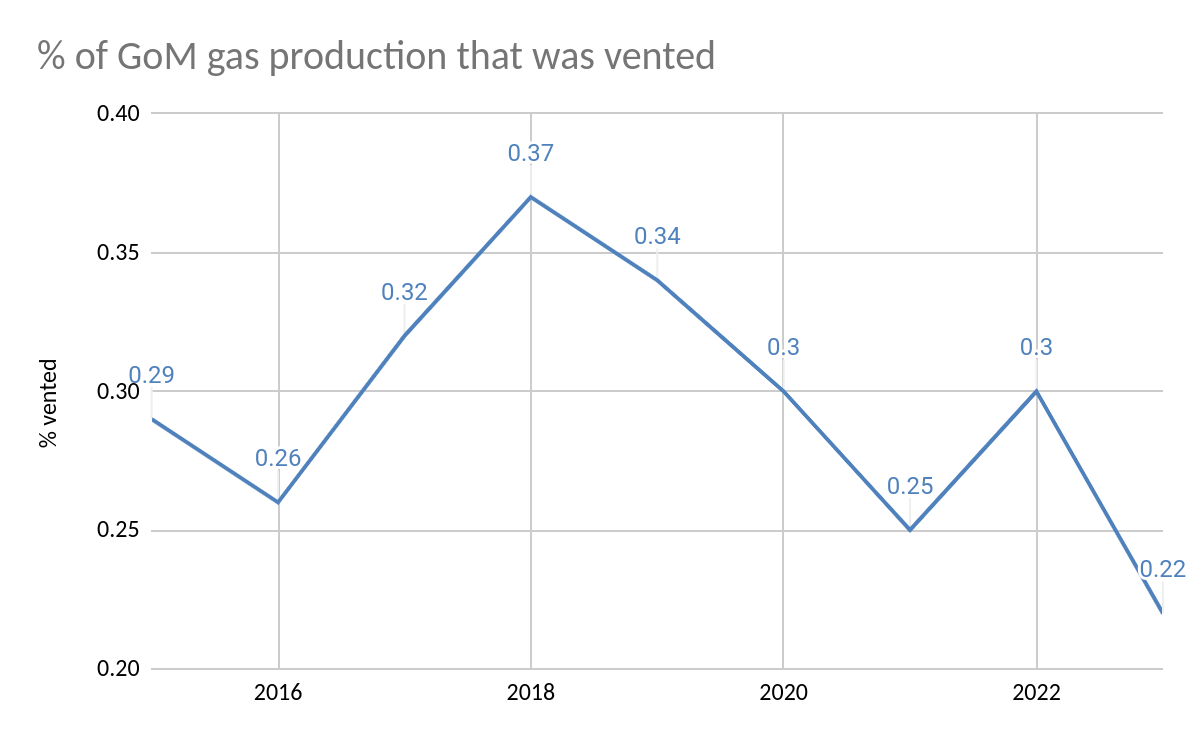
In assessing performance trends, it’s important to segment venting and flaring volumes for both OWG and GWG production. Venting produced gas (mostly methane) is a more significant environmental concern from both air quality and greenhouse gas (GHG) perspectives.
Flaring and venting data for 2019-2024 are summarized in the table below. All volumes are in millions of cubic feet (MMCF).
Notes and comments:
- The more disappointing 2024 numbers are entered in red. The blue numbers, all related to OWG venting, are encouraging.
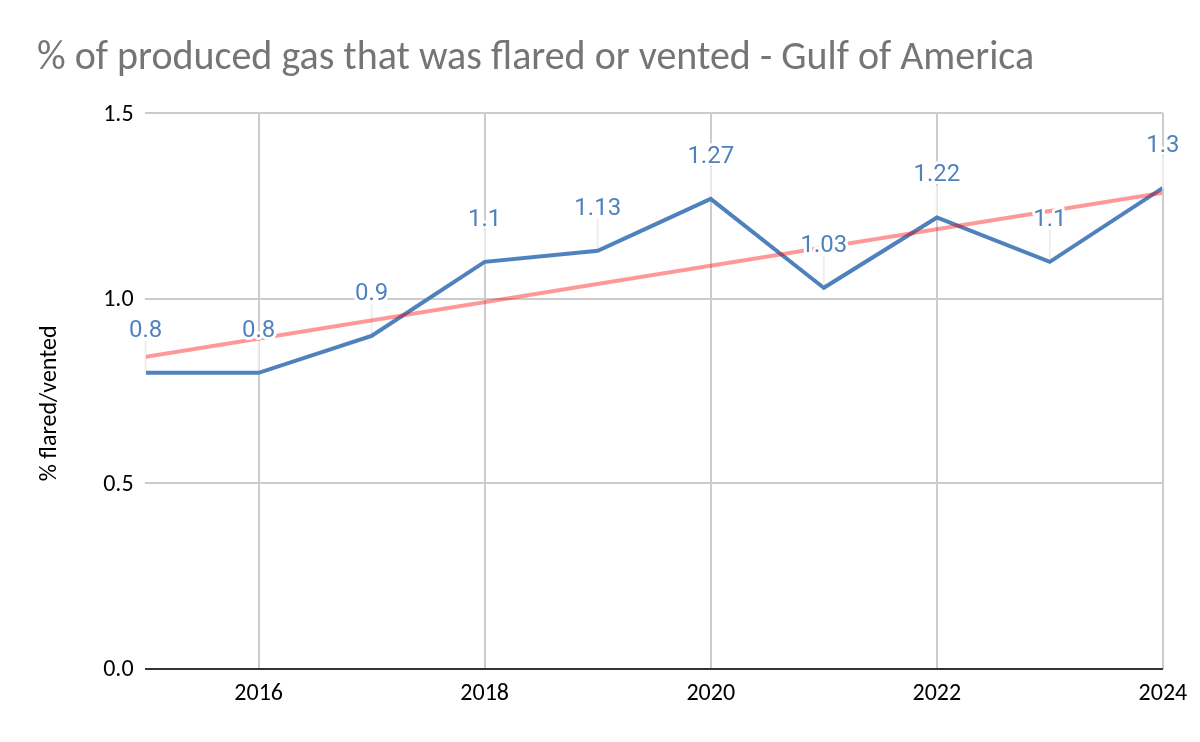
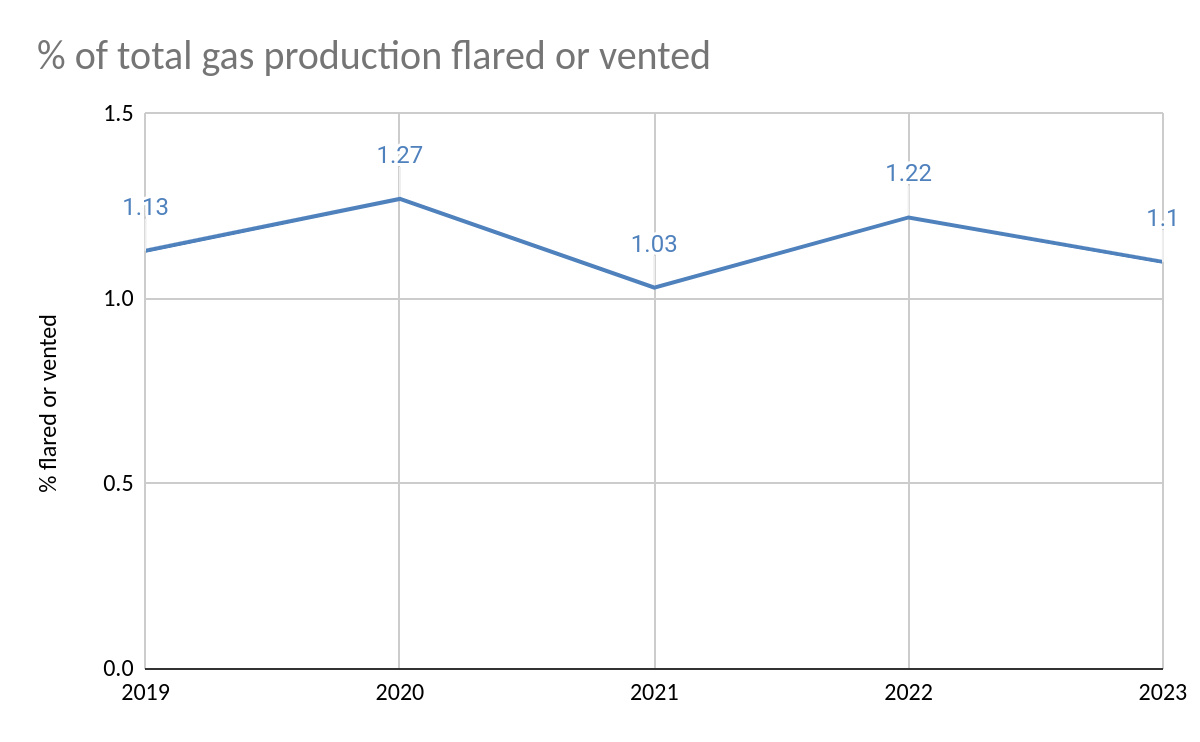
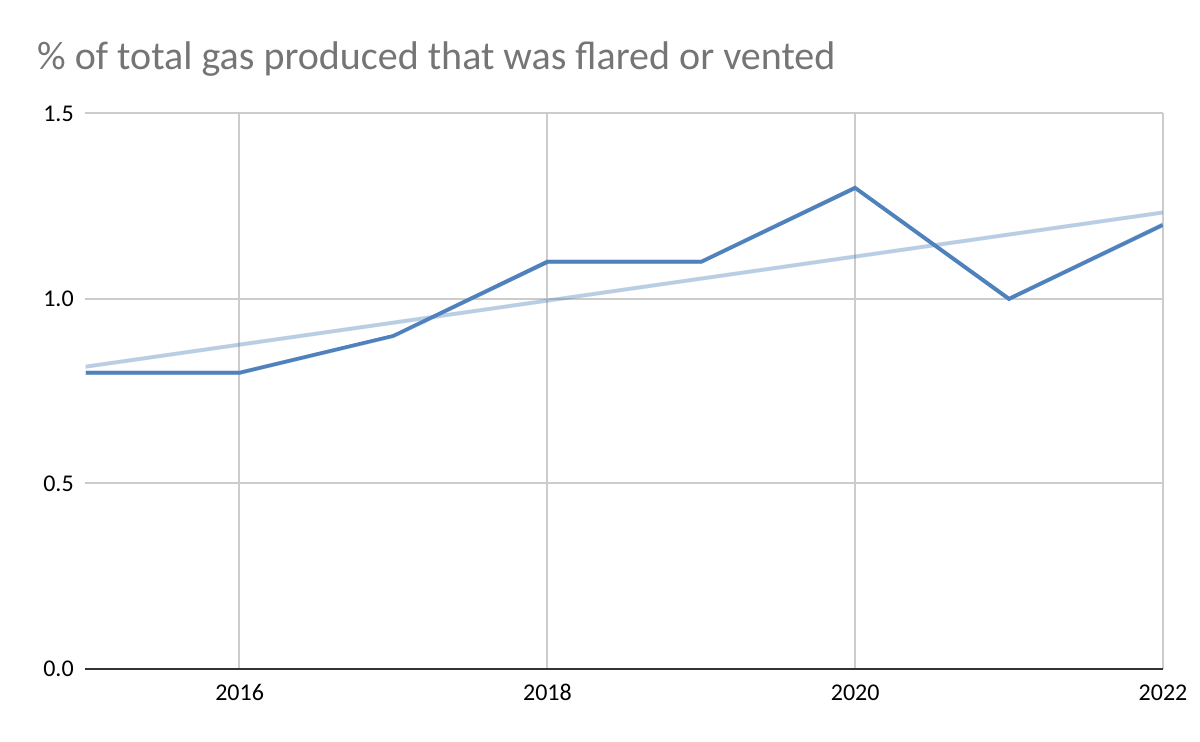
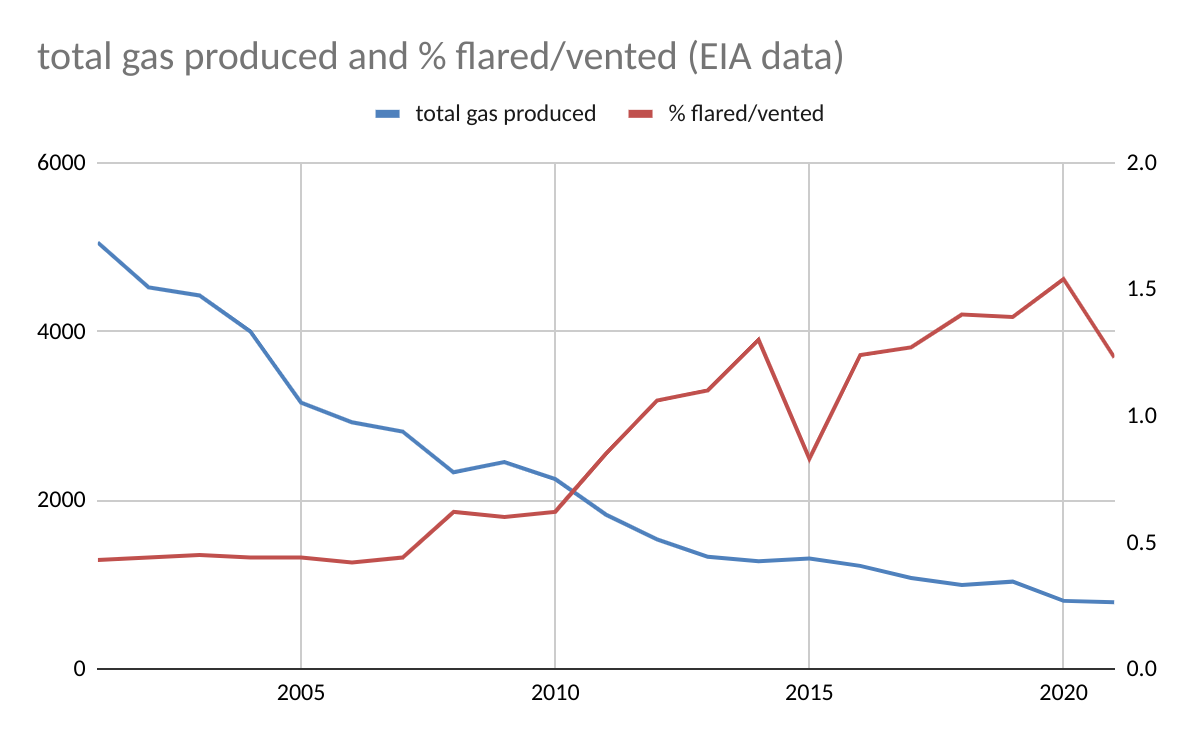
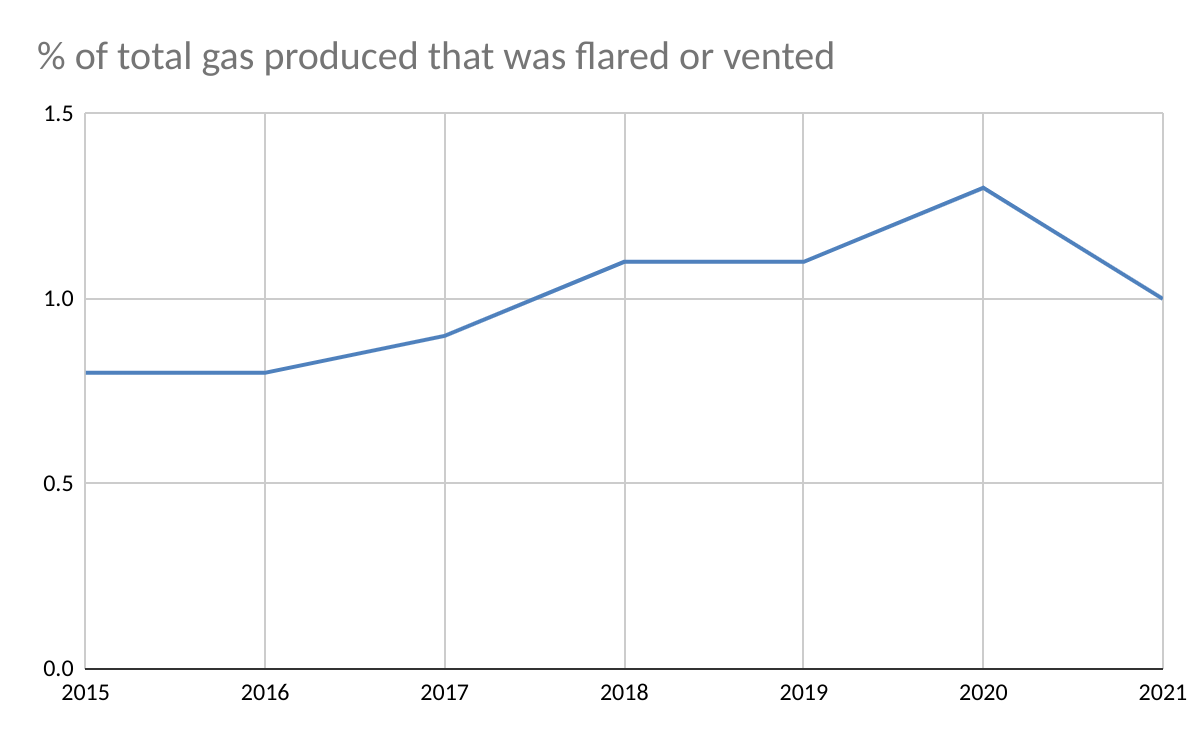
- The % of all produced gas that was flared or vented in 2024 (1.3%) was the highest in the past 10 years (see the chart below the table). Until 2018, annual flaring/venting rates of <1% of production were commonly achieved. This should be the target going forward.
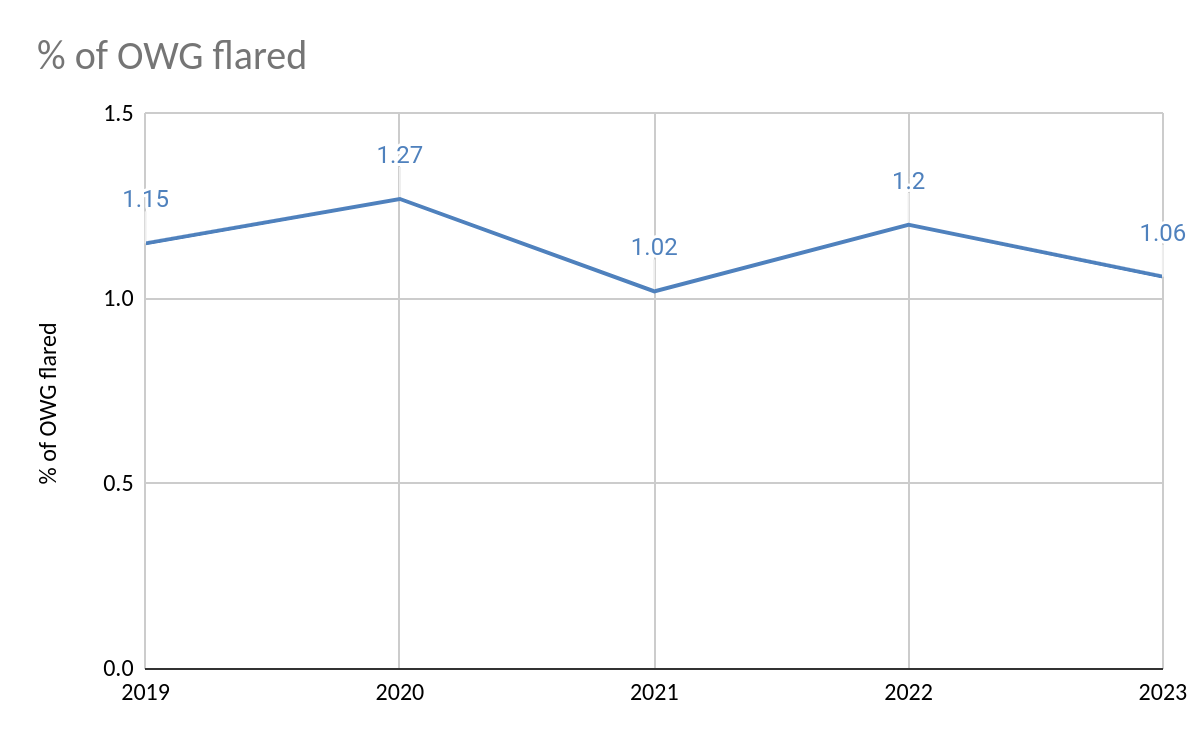
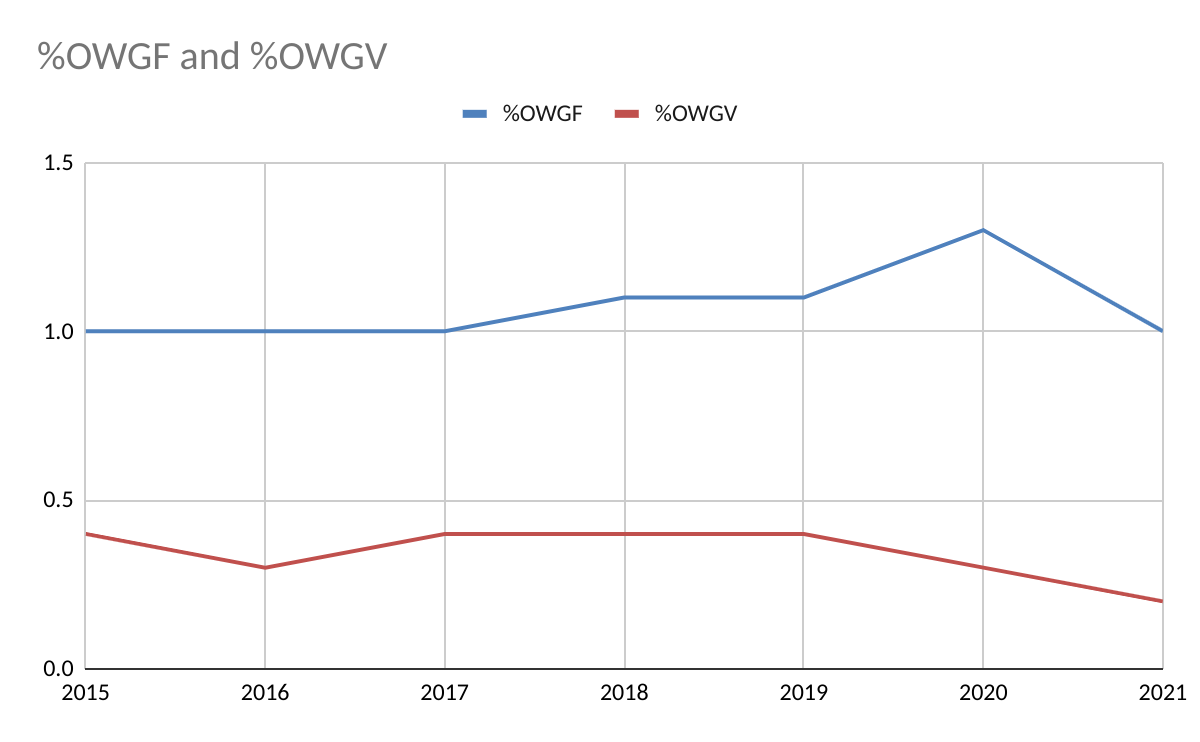
- OWG flared increased significantly from 2023 levels, both in terms of the volume (7.26 billion cu ft) and the % of OWG produced (1.22%).
- Production curtailments and restarts related to Tropical Storms Francine and Helene may have contributed significantly to the 2024 flaring increase. ONRR’s monthly reports show a near doubling of the average monthly flaring volume in Sept., when Francine and Helene shut-in 42% and 29% of oil production respectively. However, even if the Sept. flaring surge is normalized to the monthly average for the other 11 months, the total 2024 flaring still exceeds the 2023 volume by 361 MMCF.
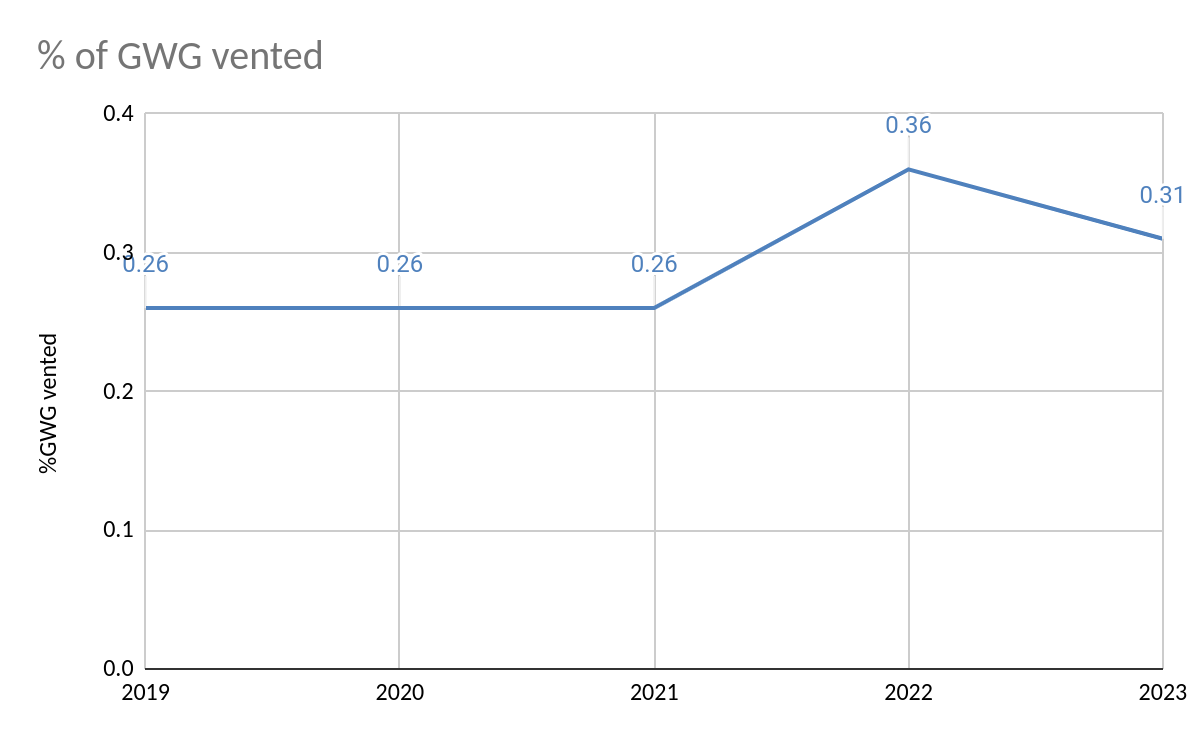
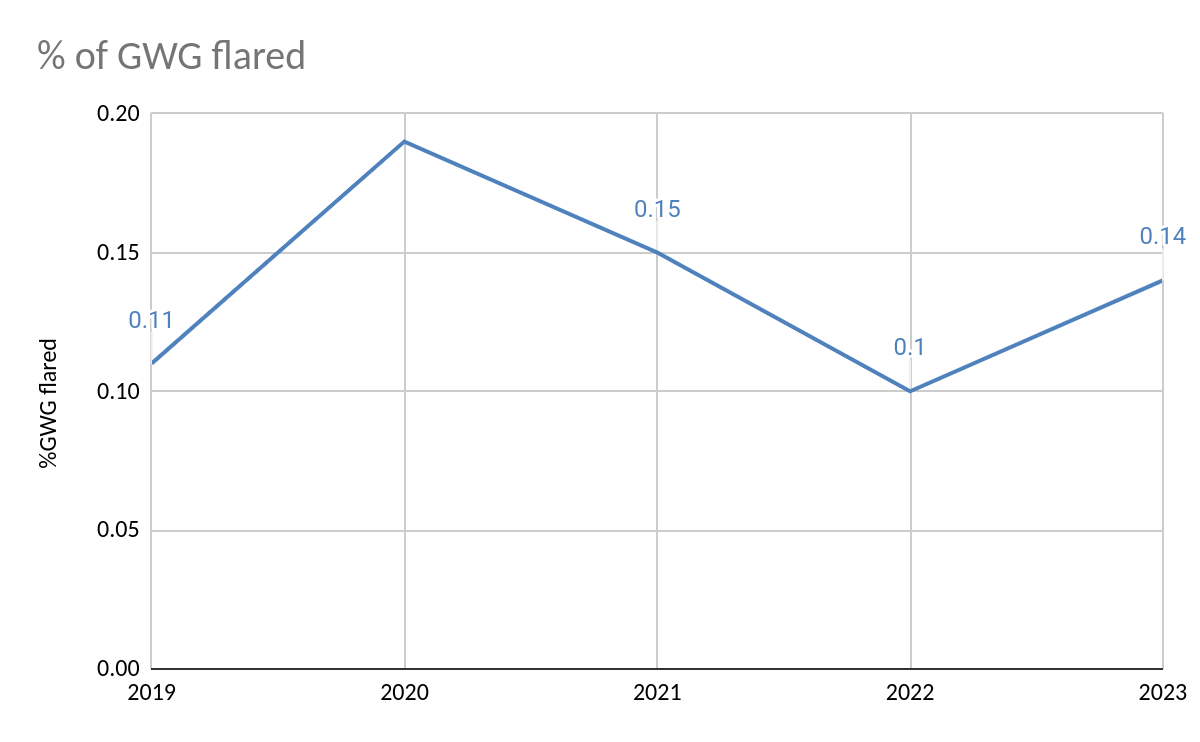
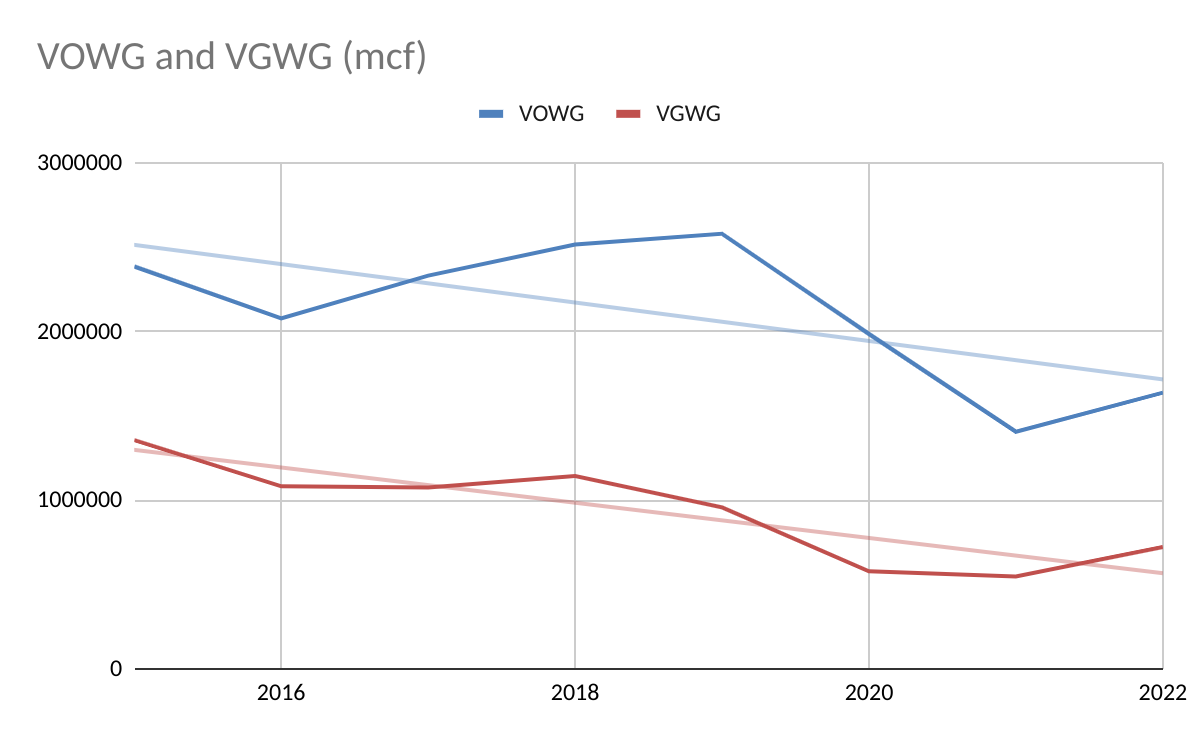
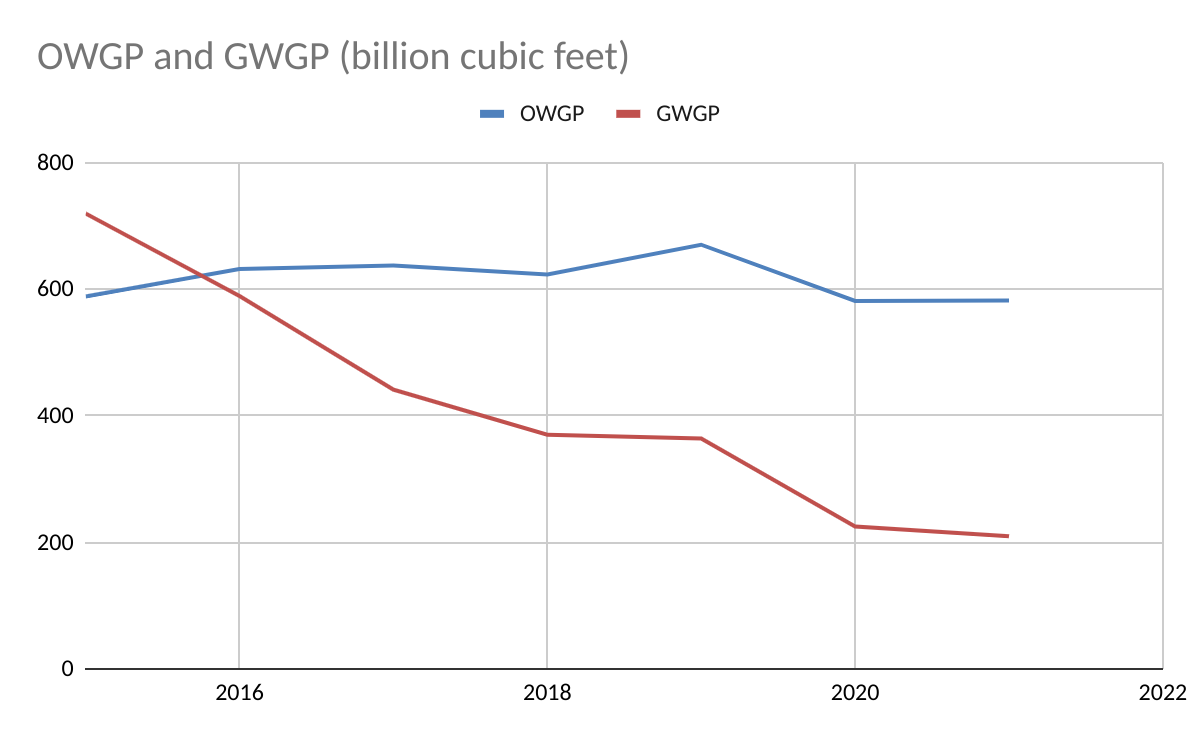
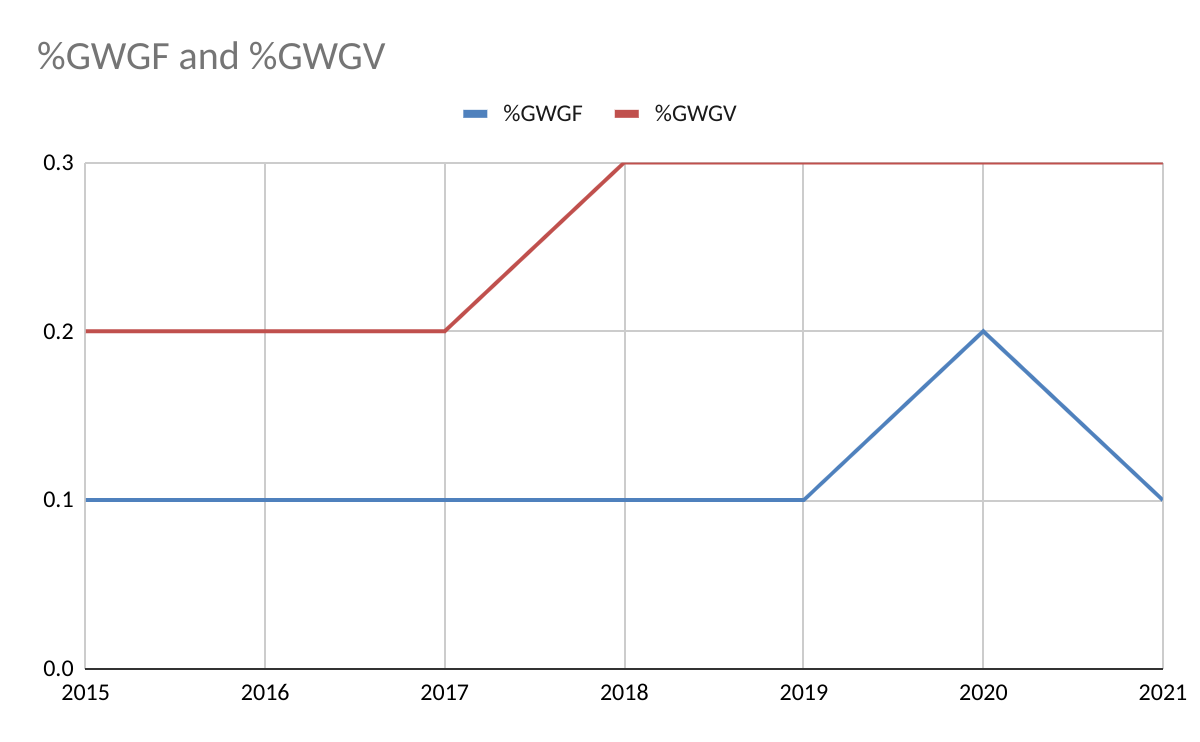
- The % of GWG vented in 2024 was the highest in the 6 year period and double the 2019, 2020, 2021 rates. Inefficiencies associated with the dramatic decline in GWG production, down 41.5% from 2023, may be a contributing factor.
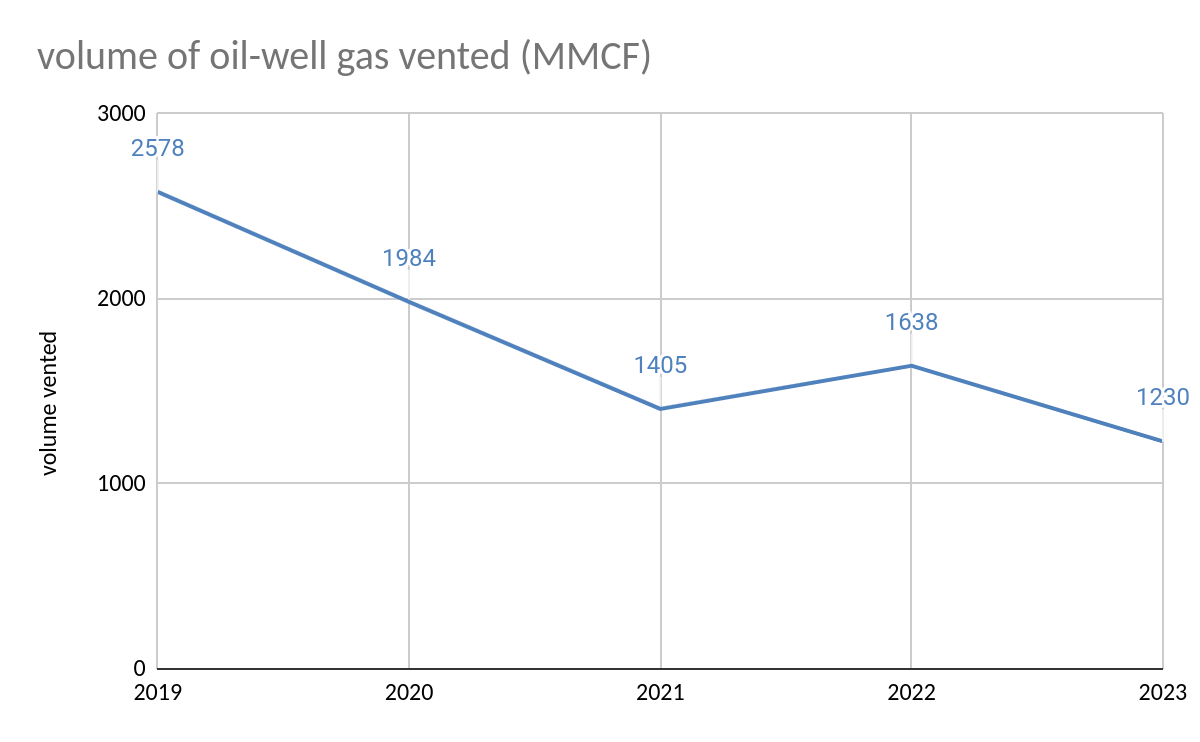
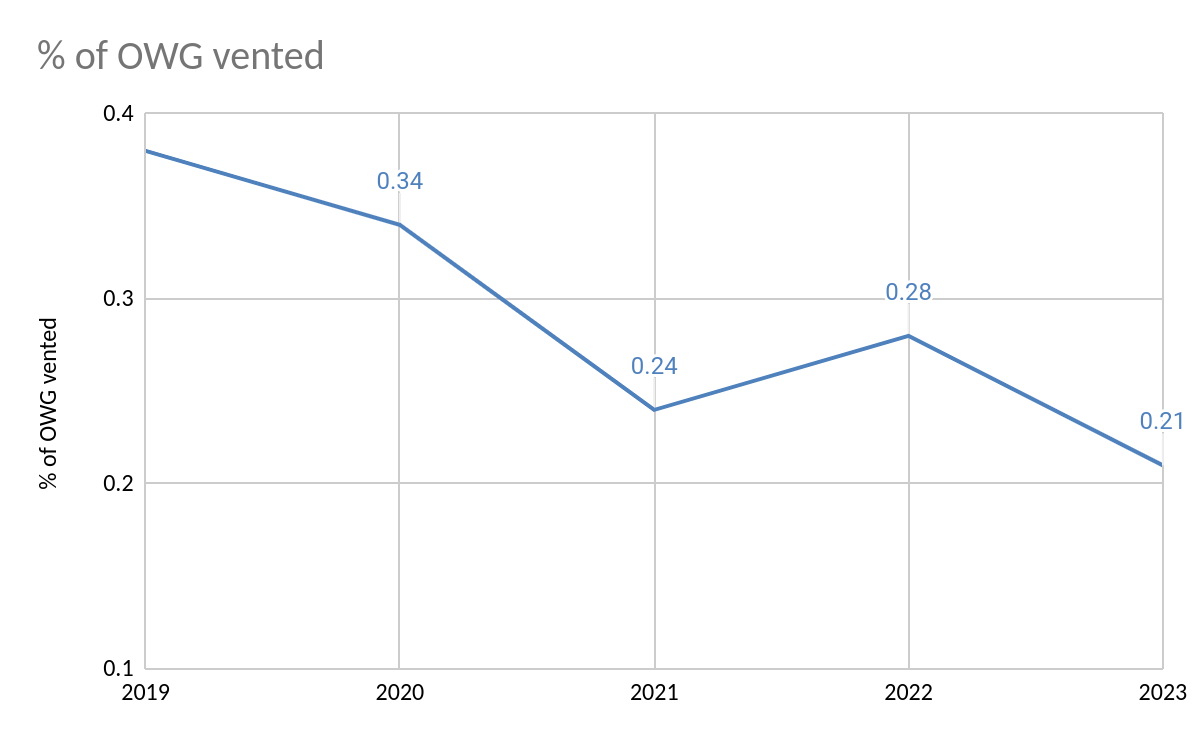
- The continued decline in OWG venting to only 0.16% in 2024 is encouraging. The decline should be sustainable given that most OWG is now produced at modern deepwater platforms equipped with efficient flare stacks.
- Given the significance of these data, from safety, conservation, and environmental perspectives, a more comprehensive analysis by the offshore industry and regulators should be a priority.
- Related posts
| 2019 | 2020 | 2021 | 2022 | 2023 | 2024 | |
| OWG flared | 7727 | 7385 | 5919 | 6987 | 6342 | 7260 |
| OWG vented | 2578 | 1984 | 1405 | 1638 | 1230 | 965 |
| OWG produced | 670,699 | 582,254 | 582,824 | 581,235 | 598,005 | 595,600 |
| % OWG flared | 1.15 | 1.27 | 1.02 | 1.20 | 1.06 | 1.22 |
| % OWG vented | 0.38 | 0.34 | 0.24 | 0.28 | 0.21 | 0.16 |
| GWG flared | 405 | 432 | 311 | 213 | 212 | 232 |
| GWG vented | 958 | 578 | 548 | 722 | 468 | 465 |
| GWG produced | 364,082 | 224,808 | 209,558 | 203,342 | 152,400 | 89,167 |
| %GWG flared | 0.11 | 0.19 | 0.15 | 0.10 | 0.14 | 0.26 |
| %GWG vented | 0.26 | 0.26 | 0.26 | 0.36 | 0.31 | 0.52 |
| total flared and vented | 11668 | 10233 | 8183 | 9559 | 8252 | 8922 |
| total gas production | 1,034,782 | 807,062 | 792,382 | 784,577 | 750,405 | 684,758 |
| % flared or vented | 1.13 | 1.27 | 1.03 | 1.22 | 1.10 | 1.30 |
| total vented | 3536 | 2416 | 1953 | 2360 | 1698 | 1430 |
| % vented | 0.34 | 0.30 | 0.25 | 0.30 | 0.22 | 0.21 |
| total flared | 8132 | 7817 | 6230 | 7200 | 6554 | 7492 |
| % flared | 0.79 | 0.97 | 0.79 | 0.92 | 0.87 | 1.09 |