The 2023 Safety Honor Roll list will be posted tomorrow.
As background information, below is a summary of compliance data for 2022 and 2023.
The performance of Fieldwood and Cox skewed the 2022 and 2023 data. In 2022, Fieldwood was issued 448 INCs, 26% of the Gulf of Mexico total. In 2023, Cox was by far the leading violator with 718 INCs, 39% of the GoM total (780/43% when Cox affiliates are included). These data point to the importance of considering safety and compliance in approving lease assignments and making supplemental bonding determinations.
2022
2023
facility inspections
3309
3100
inspection types
10856
10341
W INCs
809
1050
CSI INCs
530
600
FSI INCs
376
180
total INCs
1715
1830
INCs/facility inspection
0.52
0.59
INCs/inspection type
0.16
0.18
Pacific facility inspections
280
300
Pacific inspection types
802
744
Pacific W INCs
22
11
Pacific CSI INCs
13
14
Pacific FSI
1
0
Pacific total INCs
36
25
Pacific INCs/facility inspection
0.13
0.08
Pacific INCS/inspection type
0.04
0.03
Alaska facility inspections
8
5
Alaska inspection types
37
22
Alaska W INCs
0
1
Alaska CSI INCs
0
1
Alaska FSI INCs
0
0
Alaska INCs total
0
2
Alaska INCs/facility inspection
0
0.4
Alaska INCS/inspection type
0
0.09
INC=incident of noncompliance, W=warning, CSI=component shut-in, FSI=facility shut-in. No Alaska facilities are located on the Federal OCS. One Alaska facility, Hilcorp’s Northstar island, has wells that are completed on the OCS; hence the limited BSEE inspections.
Must average <0.3 incidents of noncompliance (INCs) per facility-inspection.
Must average <0.1 INCs per inspection-type. (Note that each facility-inspection may include multiple types of inspections (e.g. production, pipeline, pollution, Coast Guard, site security, etc). On average, each facility-inspection included 3.3 types of inspections in 2023. Here is a list of the types of inspections that may be performed.
Must operate at least 3 production platforms and have drilled at least one well (i.e. you need operational activity to demonstrate compliance and safety achievement).
May not have a disqualifying event (e.g. fatal or life-threatening incident, significant fire, major oil spill). Due to the extreme lag in updates to BSEE’s incident tables, district investigations and media reports are used to make this determination.
At Oil and Gas Lease Sale 261, Repsol was the sole bidder for 36 nearshore Texas tracts in the Mustang Island and Matagorda Island areas (red blocks at the western end of the map above). Exxon acquired 163 nearshore Texas tracts (blue in map above) at Sales 257 and 259. All 36 of the Repsol bids have now been accepted.
As previously posted here and here, carbon disposal bidding at the last 3 oil and gas lease sales has made a mockery of the leasing process and the regulations that guide it.
Hopefully, the carbon sequestration regulations that are under development will preclude conversion of leases acquired at Sales 257, 259, and 261. At a minimum, these regulations should require a competitive process for converting any oil and gas leases.
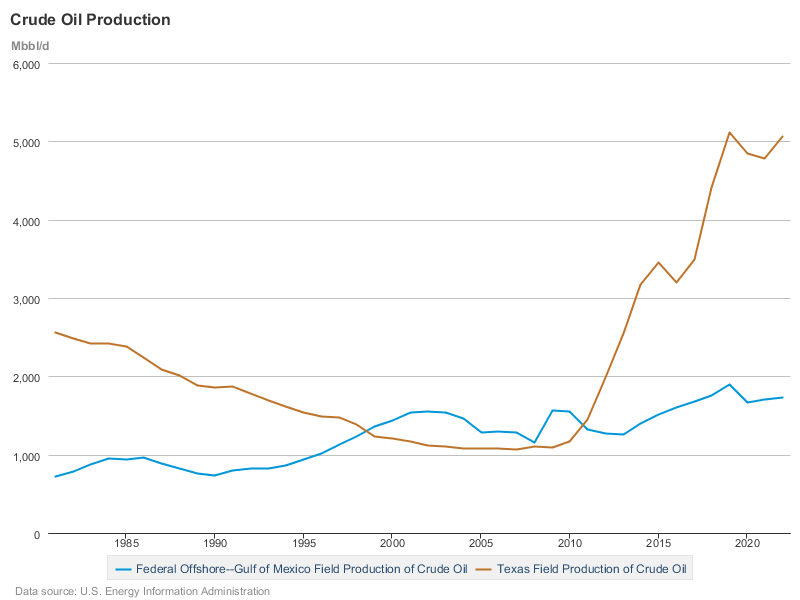
A friend owns land in the Texas Permian. His family gets a nice royalty check every month that has helped them get through some difficult times. Texas Permian production is almost entirely from private land, which is a big part of the success story. Payments to private land owners by responsible producers engender public support, access to resources, and growth in production. Add to that the continuous improvements in horizontal drilling, well stimulation and completion practices, and you have the success story that is the Texas Permian.
Similarly, private and state land plus technology launched the natural gas boom in my native state of Pennsylvania. When I was a student, we looked back at the Titusville/Colonel Drake glory days, and no one dreamed that the state would become a major natural gas exporter. Today, pipeline constraints, particularly in NJ and NY (which has managed to prevent access to the state’s substantial Marcellus and Utica shale resources) are preventing PA from further increasing gas sales.
The offshore lands on the US Outer Continental Shelf are a different story. Unfriendly, bordering on hostile, leasing policy (and not just during the current administration) has been partially overcome by advances in deepwater well and facility design that have lowered costs and increased productivity. However, OCS oil production is a fraction of what it could be.
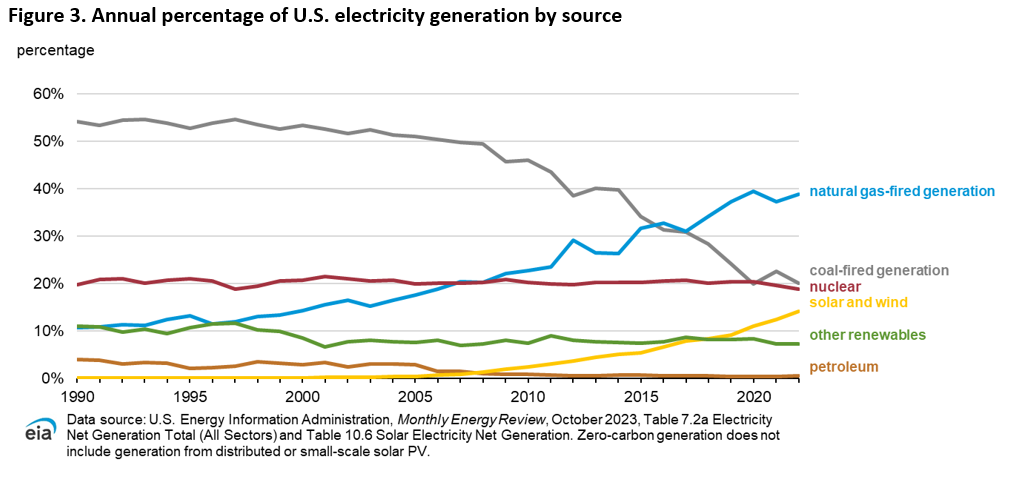
OCS gas production has fallen dramatically since the turn of the century. Ultradeep (subsurface) gas production was not economically viable and production was fading even before onshore shale gas began to dominate US gas markets. Most of the current OCS gas production is associated with deepwater oil production.
Less attention has been given to natural gas’s other important air quality advantages – low NOx. SO2, and particulate emissions. These emissions have greater local significance from a human health standpoint. Those who have ridden a bike behind a natural gas powered bus have no doubt experienced the natural gas advantage firsthand.
Roughly 237 NARWs have died since the population peaked at 481 in 2011, exceeding the potential biological removal (PBR) level on average by more than 40 times for the past 5 years (Pace III et al. 2021).
Human-caused mortality is so high that no adult NARW has been confirmed to have died from natural causes in several decades (Hayes et al. 2023).
Most NARWs have a low probability of surviving past 40 years even though the NARW can live up to a century.
There were no first-time mothers in 2022.
About 42% of the population is known to be in reduced health (Hamilton et al. 2021)
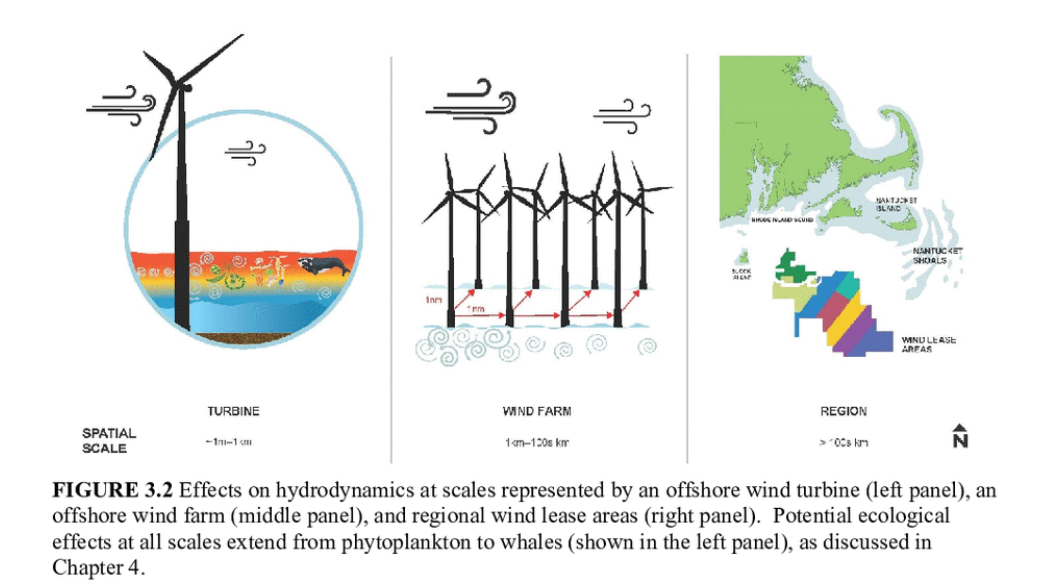
A NASEM study confirmed that offshore wind has the potential to alter local and regional hydrodynamics
“Effects to NARWs could result from stressors generated from a single project; there is potential for these effects to be compounded by exposure to multiple projects.” (p. 14)
BOEM/NOAA strategy:
No new mitigation is recommended pending further study.
“BOEM and NOAA Fisheries will work together alongside our partners (including the OSW industry) to further develop the information and science the agencies will use to inform their decisions to responsibly develop OSW while protecting and recovering NARWs.” (Comment: While regulator-industry collaboration is essential for effective offshore development, be it wind or oil and gas, regulators and operating companies have distinctly different missions and responsibilities and should not be viewed as partners.)
(p. 15): “As the OSW industry continues to grow and as projects begin construction, BOEM and NOAA Fisheries will continue to work with our partners to evaluate existing strategies and to further collect and apply newly available information to inform future decisions. This Strategy is an integral step to organize BOEM, NOAA Fisheries, and their partners around a shared vision and clear path to effectively study and manage this issue moving forward.” (???)
(p.17): BOEM will “attempt to avoid issuing new leases in areas that may impact potential high-value habitat and/or high use areas for important life history functions such as NARW foraging, migrating, mating, or calving. For areas that are leased, permitting activities should minimize any known or potential threat to NARWs and their habitats, and developers and BOEM should support research and monitoring.”
Questions:
How are the NARW threats identified in the NASEM study being mitigated?
Why are the Rice’s whale litigants okay with the more compelling threat to the NARW?
What happens if the hydrodynamic threats identified by the NASEM panel are confirmed?
Why isn’t this collaborative approach being pursued in assessing and mitigating risks to the Rice’s whale?
Can we expect the Federal government’s leading offshore wind promoter to impose restrictions that further weaken the economics of offshore wind development?
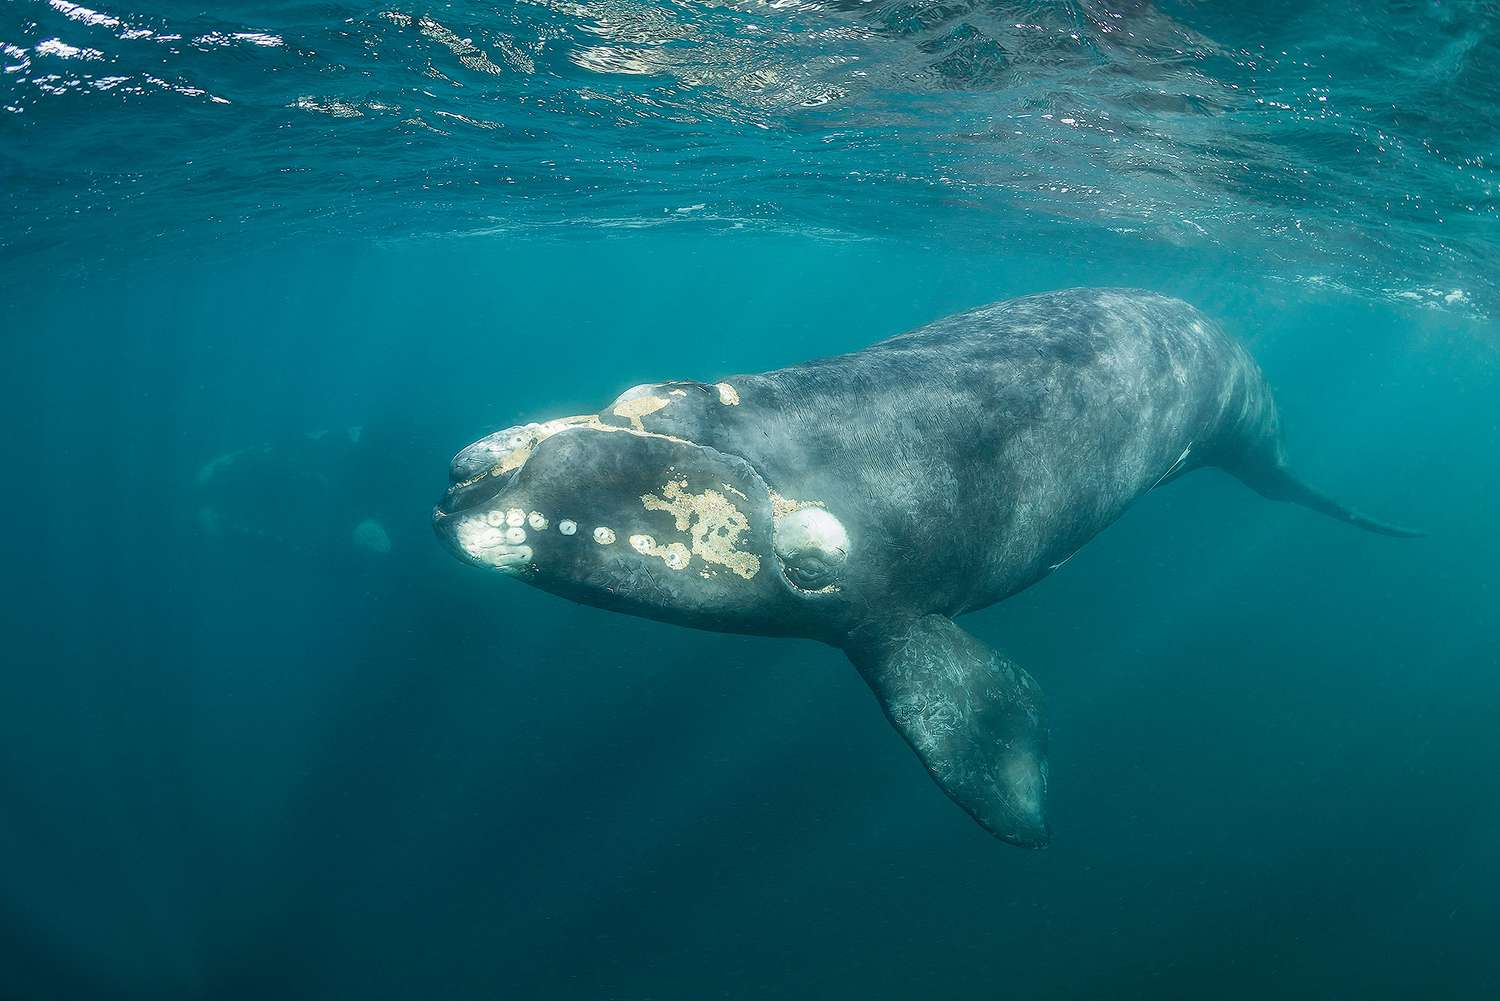
Pictured below: density of NARWs near wind leases and hydrodynamic effects of turbines
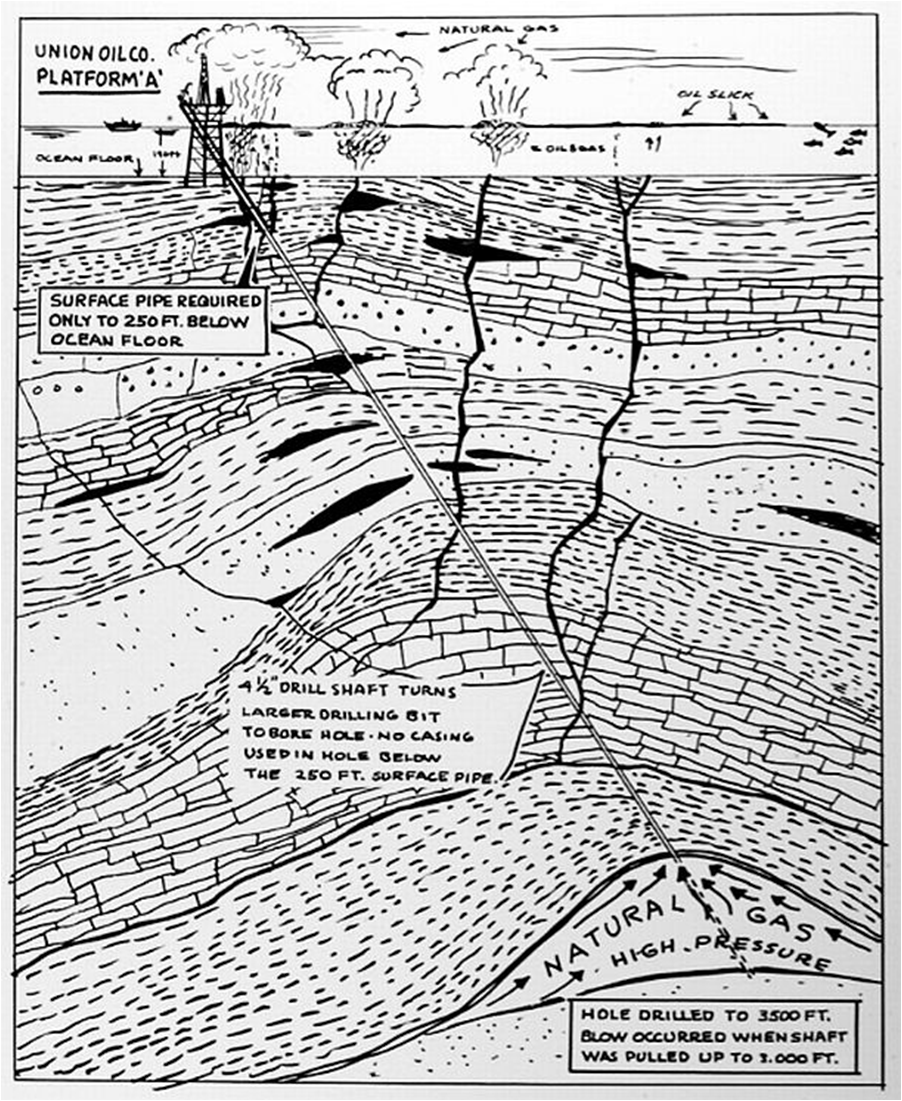
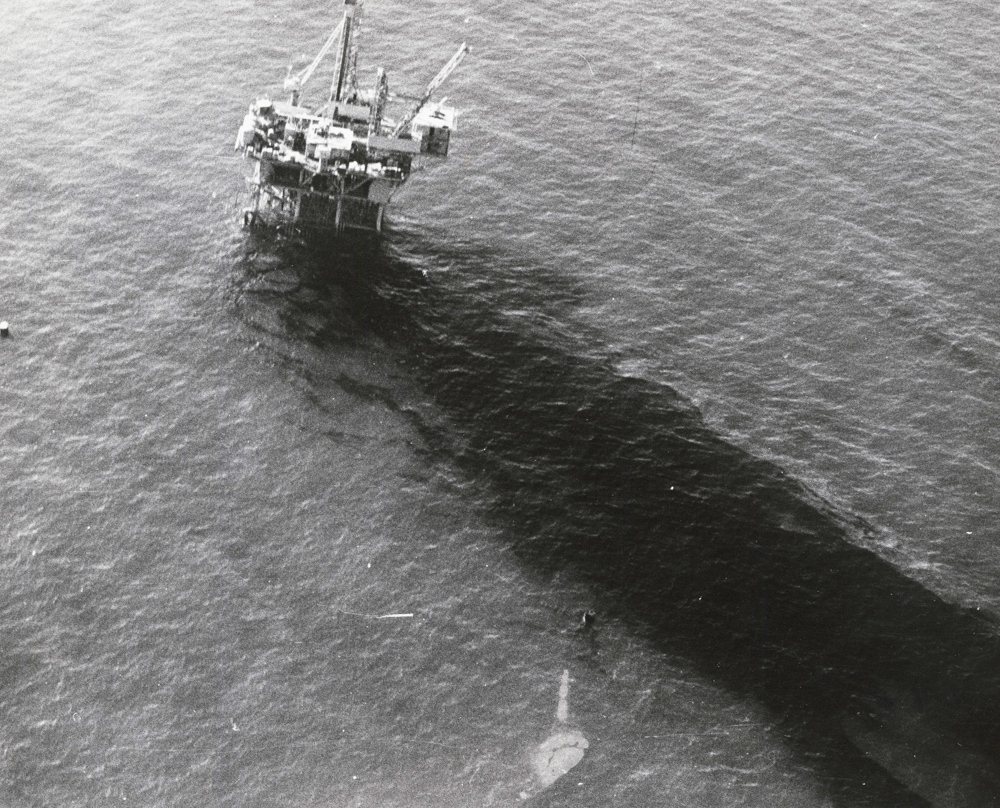
On January 28, 1969, well A-21, the 5th well to be drilled from Union Oil Company’s “A” platform began flowing uncontrollably through fractures into the Santa Barbara Channel.
The absence of any well casing to protect the permeable, fractured cap rock meant that the operator couldn’t safely shut-in a sudden influx of hydrocarbons into the well bore (i.e. a “kick”). Shutting-in the well at the surface would create well bore fractures through which oil and gas could migrate to shallow strata and the sea floor. The probability of an oil blowout was thus essentially the same as the probability of a kick (>10-2). Compare this with the historical US offshore oil blowout probability (<10-4) and the probability of <10-5 for wells with optimal barrier management.
Here, in brief, is the well A-21 story:
Well drilled to total depth of 3203′ below the ocean floor (BOF).
13 3/8″ casing had been set at 238′ BOF. The well was unprotected from the base of this casing string to total depth.
Evidence of natural seeps near the site suggested the presence of fracture channels
The well was drilled through permeable cap rock and a small high pressured gas reservoir before penetrating the target oil sands.
When the well reached total depth, the crew started pulling drill pipe out of hole to in preparation for well logging.
The first 5 stands of drill pipe pulled tight; the next 3 pulled free suggesting the swabbing of fluids into the well bore..
The well started flowing through the drill pipe. The crew attempted to stab an inside preventer into the drill pipe, but the well was blowing too hard. The crew then attempted unsuccessfully to stab the kelly into the drill pipe and halt the flow.
The crew dropped the drill pipe into the well bore and closed the blind ram to shut-in the well.
Boils of gas began to appear on the water surface. Oil flowed to the surface through numerous fracture channels. The above sketch by former colleague Jerry Daniels (RIP) depicts the fracturing, which greatly complicated mitigation of the flow.
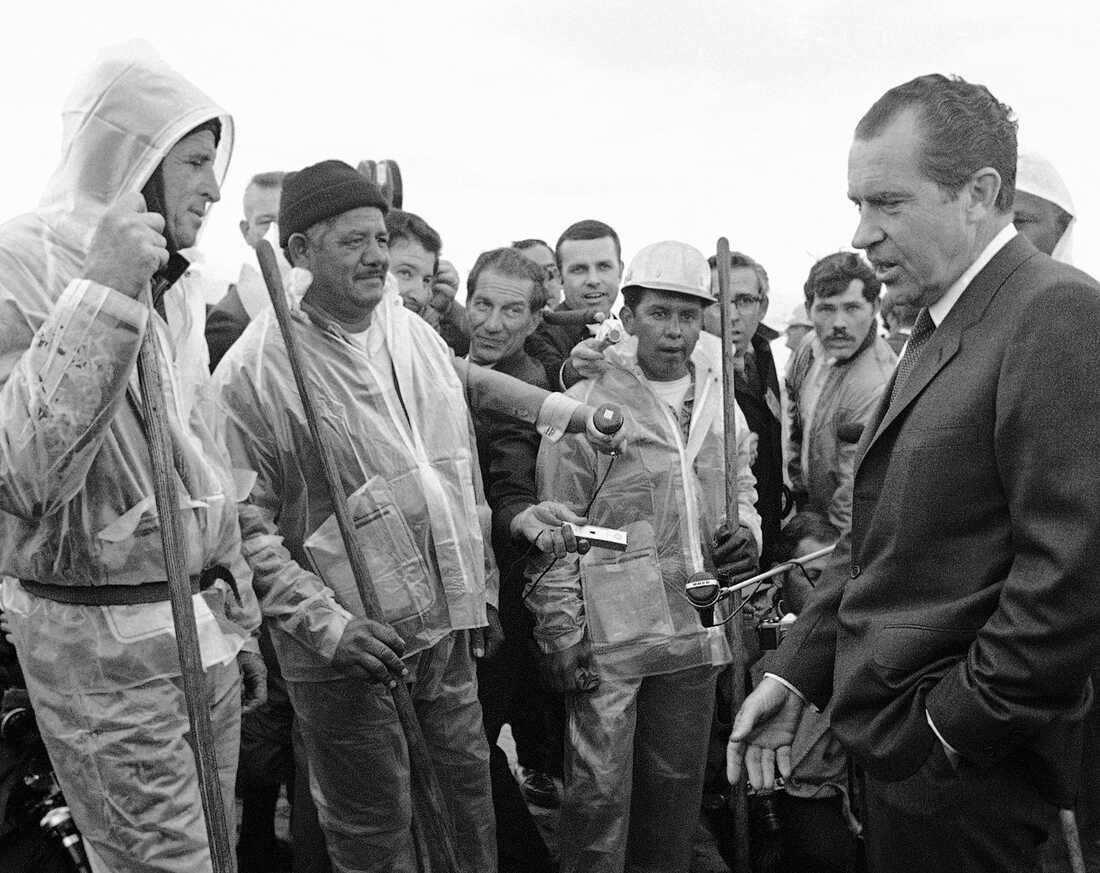
We need to continue studying these historically important incidents, not just the technical details but also the human and organizational factors that allowed such safety and environmental disasters to occur. The idea is not to shame, but to remember and better understand.
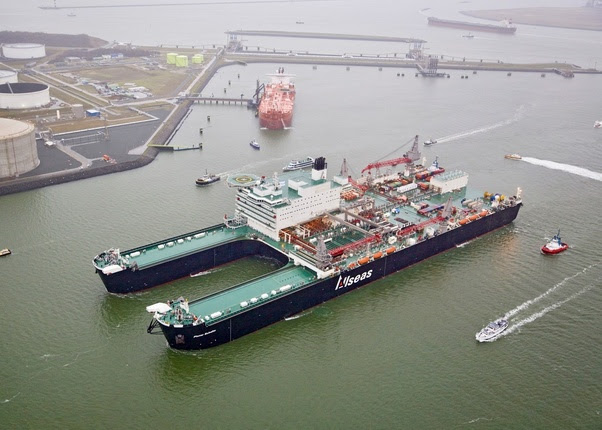
The financial, technical, and regulatory aspects of decommissioning have received much attention on this blog. Andrew Konczvald sends this photo with regrets that the behemoth “Pioneering Spirit” wasn’t available when he was concerned with such matters.
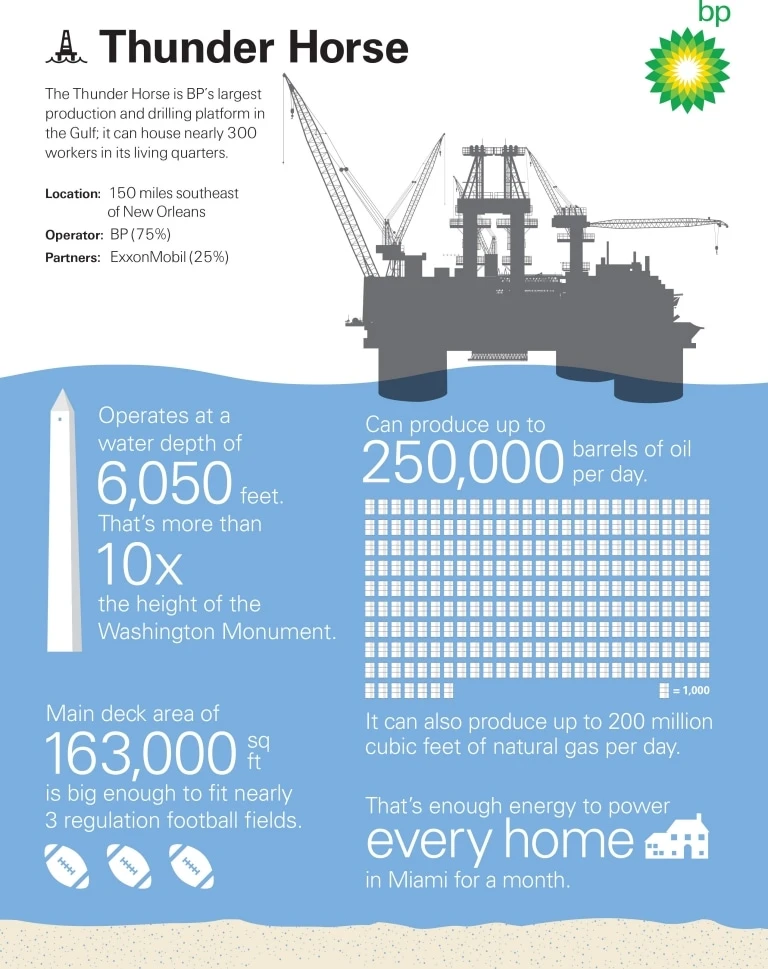
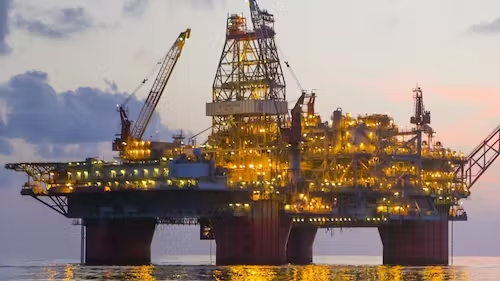
For comparison (size only given the different missions), the massive Thunder Horse floating production platform (see below) in the Gulf of Mexico is 136 m x 112 m, only 12 m narrower but just over 1/3 of the Pioneering Spirit’s length.
The worlds largest 403,342 gross tonnage ship ‘Pioneering Spirit’ (formerly Pieter Schelte) is a catamaran crane vessel owned by the Switzerland-based All Seas Group designed for the single-lift installation and removal of large oil and gas platforms and the installation of record-weight pipelines. The 382-metre-long (1,253 ft), 124-metre-wide (407 ft) vessel is the world’s largest vessel by gross tonnage, and since September 2021 also the largest floating sheer-leg in the world. It was built in South Korea by Daewoo Shipbuilding & Marine Engineering in 2013 at a cost of €2.6 billion. It commenced offshore operations in August 2016.Thunder Horse