Feeds:
Posts
Comments

Archive for the ‘natural gas’ Category

World Bank flaring data have some limitations as discussed in a previous BOE post. However, they provide an objective means of estimating and comparing flaring volumes worldwide, and therefore merit close attention.

The latest World Bank data tell us that significant gas flaring issues persist. Worldwide, 138,549 million m3 of gas were flared in 2022. This equates to a massive 4 tcf, the equivalent of the reserves in a major gas field and more than 5 times the total gas production in the Gulf of Mexico in 2022.

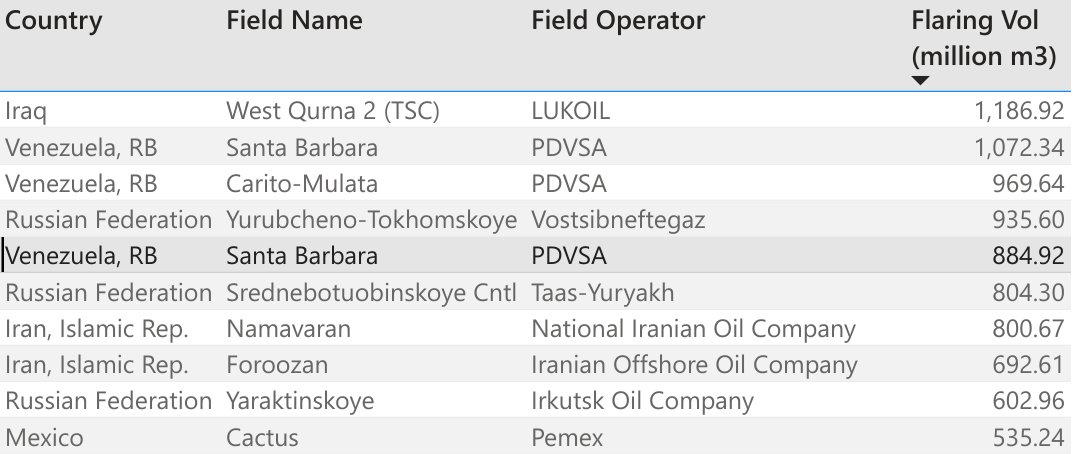
The top ten “flarers” are listed below. Each of these fields flared from 19 to 42 bcf. For comparison, the top ten GoM gas producers in 2022 produced 10 to 57 bcf, so single fields are flaring more than GoM companies are producing in total. Assuming for discussion purposes a gas-oil ratio of 1000 cu ft/bbl, all of the gas associated with 19 million to 42 million barrels of oil production was wasted from each field.
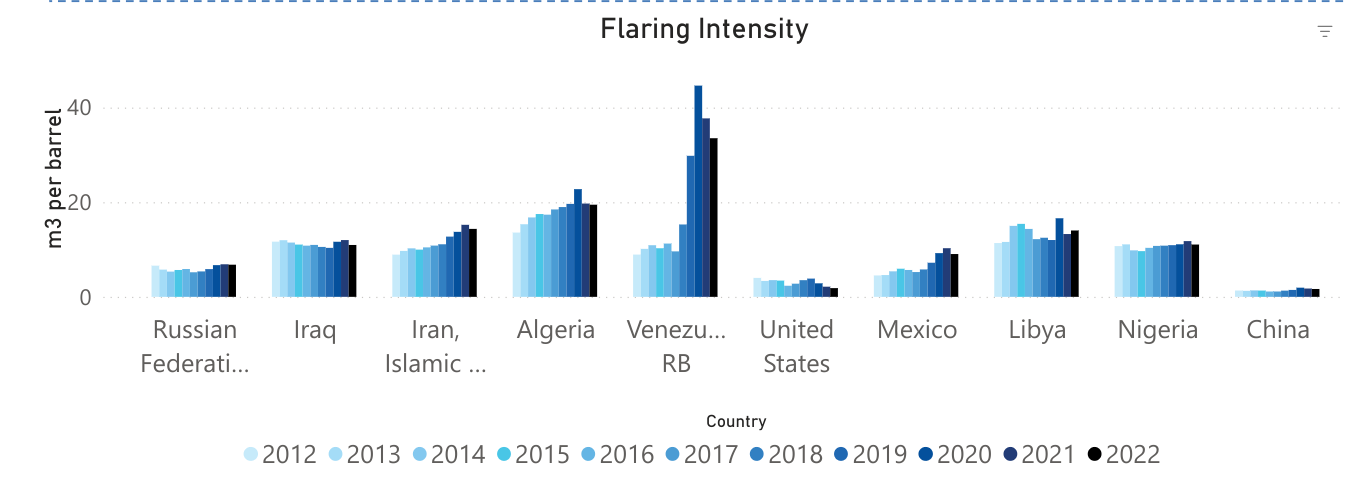
Posted below are the World Bank’s flaring intensity data (m3 of gas flared per bbl of oil produced) for the 10 countries with the highest flaring volumes. Venezuela’s flaring intensity rose to 44.6 m3/bbl in 2020, before declining moderately the following 2 years. 44.6 m3/bbl equates to 1575 cu ft/bbl. This gas flaring to oil production ratio implies that a very high percentage of Venezuela’s associated gas production was flared.
Here in North America, we have flaring issues of our own. Mexico’s Cactus Field is a top ten flarer (first table above) with 534.5 million m3 flared in 2022. The World Bank also lists 6 Permian Basin fields with >50 million m3 of gas flared in 2022.

Zeroing in on the US/Canada offshore sectors, fields with >1 million m3 of gas flared (2022) are listed below. Four of the top 7 are offshore Alaska and Newfoundland where the gas cannot currently be marketed and reinjection, field use, and flaring are the only options. Can production from these fields be better managed to reduce flaring volumes?

fieldoperatorm3 (millions)f3 (millions)
White Rose (Nfld)Cenovus41.691472
Hibernia (Nfld)HMDC40.991448
ShenziBHP31.341107
Northstar (AK)Hilcorp11.23397
ConstitutionOxy10.76380
PompanoTalos10.54372
Endicott (AK)Hilcorp10.07356
UrsaShell8.19289
MarmalardMurphy6.62234
LuciusOxy3.09109
MarlinOxy3.08109
MarsShell2.278
HolsteinOxy1.4852

The extraordinary 1.1 bcf of gas that was flared at the Shenzi field may help explain the large (1 bcf) increase in oil well gas flaring in the Gulf of Mexico in 2022. Based on the World Bank data and ONRR data for the GoM, Shenzi accounted for 16% of GoM oil-well gas flaring in 2022. As noted in that post, more regulator/industry transparency on lease and field specific flaring is needed. ONRR’s posting of flaring and venting data is a positive step, but it doesn’t include lease specific data and doesn’t explain major flaring episodes.
Read Full Post »

From ONRR OGOR B data:

20212022
OWG flared59196987
OWG vented14051638
GWG flared311213
GWG vented548722
total flared and vented81839559
total gas prodution791,983784,238
% flared or vented1.031.22
OWG=oil well gas; GWG=gas well gas; all volumes are in MMCF

Observations:

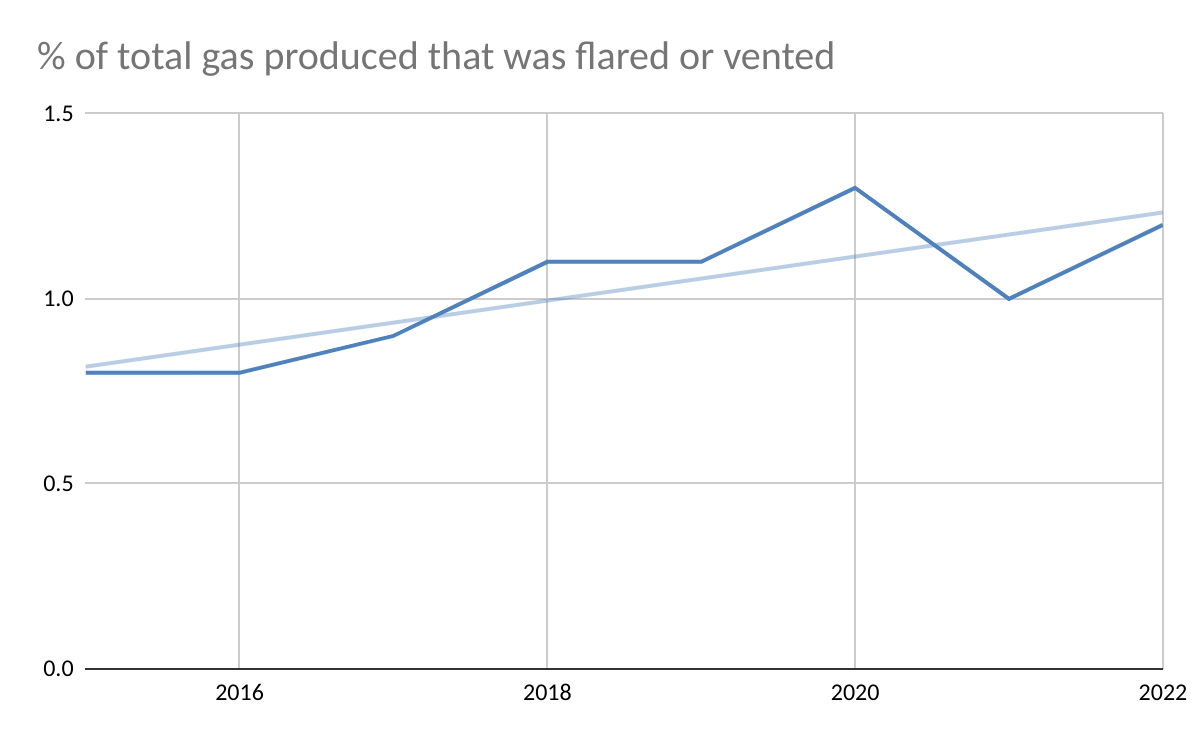
  • Of the 784 bcf produced, 9.6 bcf (1.2%) were either vented or flared (vs. 1.03% in 2021). With the exception of 2020 (1.3%), this is the highest % of gas flared/vented from 2015-2022.
  • The % of gas produced that is flared or vented is trending upward (first chart below).
  • Both the gas flaring and venting volumes were higher in 2022 (vs. 2021) despite lower gas production.
  • Assuming oil-well gas (OWG) production of 600 bcf (final 2022 volume not yet available), approximately 1.4% (8.6/600) of the OWG was flared or vented.
  • 2022 OWG flaring volume increased by 18% vs. 2022 despite nearly identical total oil production
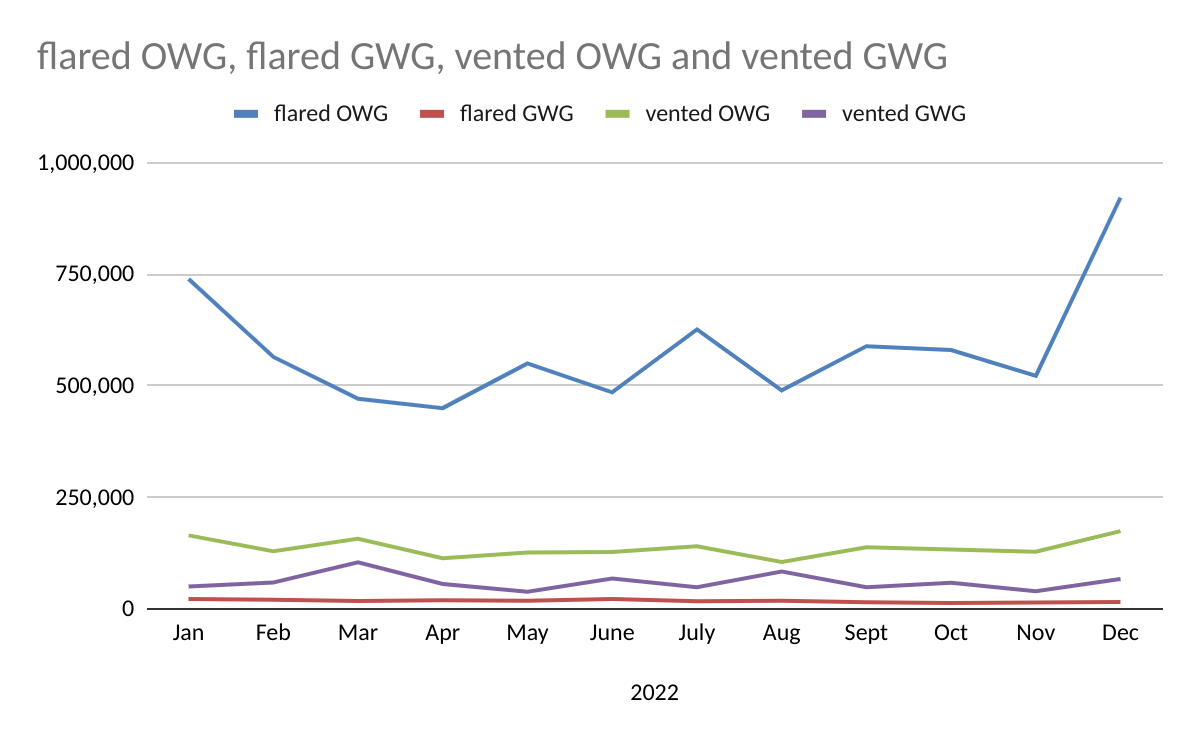
  • A very large increase in OWG flaring in December skewed the 2022 data (921 million cu ft vs 522 million in November, see 2nd chart below). OWG vented and gas-well gas (GWG) vented also spiked in December (third chart). Were these spikes associated with production startups, major compressor issues, administrative/accounting corrections, or other issues?
  • Although total venting increased by 407 million cu ft (21%) in 2023 vs. 2022, the overall venting trend is still favorable (last chart).
  • The previously noted inconsistencies in flaring data sets remain a concern.
  • Kudos to ONRR for posting the flaring/venting data.
  • More regulator/industry transparency on flaring episodes is needed, particularly in light of the PNAS paper and the June 2022 Inspector General Report.

related:

Read Full Post »

A big step forward:

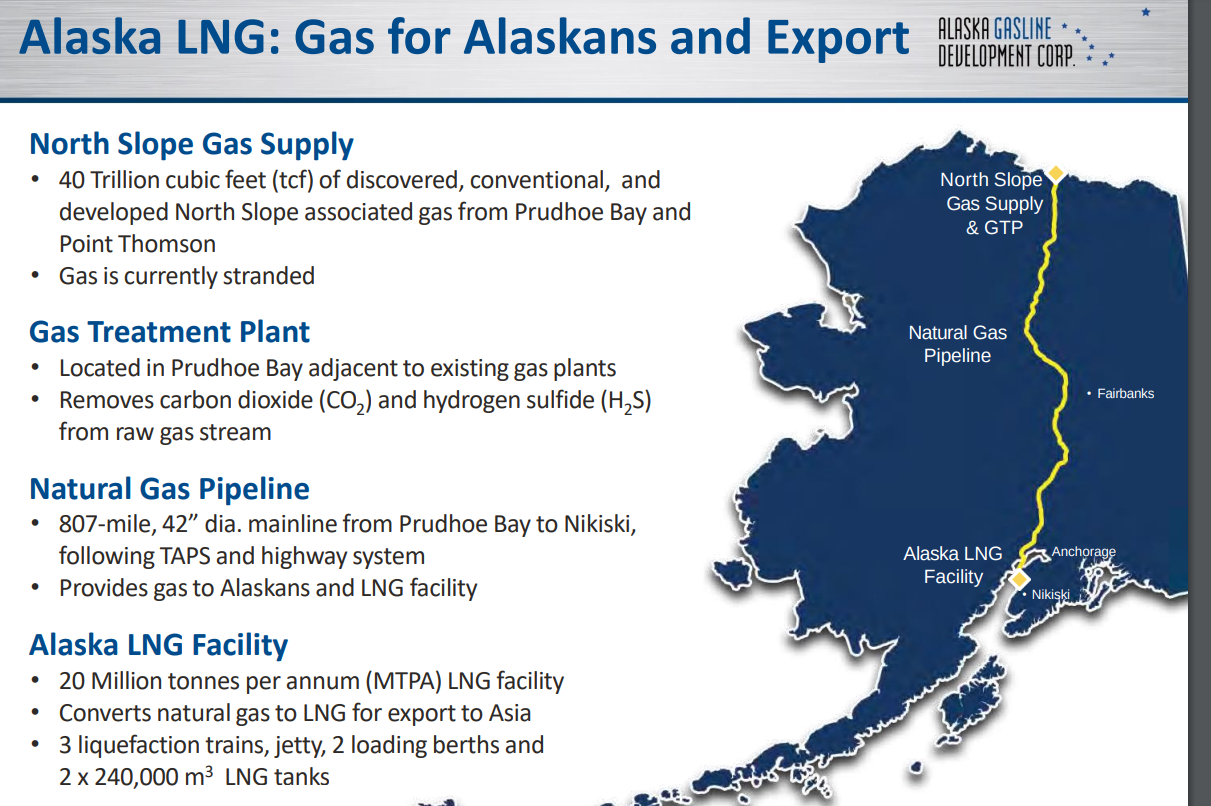
The Department of Energy approved Alaska Gasline Development Corp’s (AGDC) exports of LNG from the project to countries with which the United States does not have a free trade agreement.

Backers of the roughly $39 billion project hope it will be operational by 2030 if it gets investments and all required permits. The LNG would be exported mainly to countries in Asia.

Reuters

53 years of history in 93 seconds:

The basics:

Alaska LNG

Read Full Post »

Yesterday, Lars Herbst attended the EIA’s Annual Energy Outlook presentation. The slides are attached.

Below is a custom chart from the EIA data tables. While EIA predicts growth in renewable generating capacity, US oil and gas production are nonetheless projected to increase slightly through 2050.

Read Full Post »

I do not recall any other such incidents.

Victoria Nuland’s glee over the Nord Stream damage (video clip below) is particularly galling to those responsible for offshore production, worker safety, and environmental protection. Does she realize that the Gulf of Mexico has more than 13,000 miles of active offshore pipeline that could be similarly targeted, and that the US has 2.6 million miles of onshore pipelines?

Whether or not the US was involved in the Nord Stream sabotage, Ms. Nuland’s schadenfreude is disturbing given the economic and security implications of the attack.

Read Full Post »

Offshore gas has important environmental advantages, particularly nonassociated gas-well gas (GWG). While the GoM production chart (below) is not pretty, there are signs that gas production may have bottomed and is slowly rising. This is largely due to growth in oil-well gas (OWG) associated with deepwater oil production.

A successful offshore program requires a mix of strategies, and it is encouraging that companies are still pursuing natural gas on the GoM shelf. The second chart (below), based on BOEM data, shows 2022 YTD (probably through Oct.) GWG production for the 11 companies that (1) produced more GWG than OWG and (2) produced more than 1 BCF of GWG.

Interestingly, 100% of the gas produced by Contango, Samchully, and Helis in 2022 was from gas wells. Contrast this with bp, the third largest GoM gas producer. None of bp’s gas production was from gas wells.

One has to wonder about the extent to which deepwater gas reservoirs are being stranded due to the less favorable economics. Preventing such resource losses was once an important regulatory consideration given the conservation mandate in the OCS Lands Act and the importance of maximizing the public benefit. However, current policy, as expressed in the proposed 5 year leasing plan, is to phase out offshore production rather than sustain it. This is difficult to reconcile.

Read Full Post »

Advice from Lars Herbst, distinguished offshore energy leader: “Help the Energy Crisis – Drink more Jack Daniels”

Tennessee Twist:TC Energy’s $29.3 million investment in a RNG (renewable natural gas) production facility near the Jack Daniel’s Distillery will see the Canadian operator producing RNG with a carbon-intensity score that is 50% lower than traditional natural gas, saving up to 16,000 tonnes of CO2e per year, according to the company.

β€œThis investment is our first in the production of renewable natural gas,” said Corey Hessen, TC Energy executive vice president and president, power & Energy solutions. β€œThe production of RNG onsite at the Jack Daniel’s Distillery offers TC Energy one more opportunity to meet the challenge of growing energy needs and reducing emissions while providing customers with access to an affordable, reliable, source of energy.”

JPT

It’s a great country! πŸ˜€

Read Full Post »

NASA has identified 50+ super-emitters of methane including sites in Turkmenistan (image below) that emit an estimated 111,000 pounds per hour.

Β 

By comparison, vented Gulf of Mexico methane emissions in 2021 totaled 1953 mmcf. This converts to 82 million pounds at atmospheric pressure and 60Β°F. The identified Turkmenistan sources would thus release the amount of methane in a month that all Gulf of Mexico facilities vent in a year (2021).

East of Hazar, Turkmenistan, a port city on the Caspian Sea, 12 plumes of methane stream westward. The plumes were detected by NASA’s Earth Surface Mineral Dust Source Investigation mission and some of them stretch for more than 20 miles (32 kilometers).

Read Full Post »

ONRR mandatory production reporting data are being sorted to assess GoM flaring and venting trends. This will help resolve inconsistencies previously identified. In the meantime, the table below summarizes the 2021 data. 1.03% of the gas produced that year was flared or vented. 0.25% of the gas production was vented.

Interestingly, more gas-well gas was vented than flared. This is presumably because older shelf facilities without flare booms still produce 25% of the gas (versus only 7% of the oil), mostly from gas wells. More to follow.

gas
production
flared (%)vented (%)flared &
vented (%)
OWG582,2045919 (1.01)1405 (0.24)7324 (1.26)
GWG209,779311 (0.15)548 (0.26)859 (0.41)
total 791,9836230 (0.79)1953 (0.25)8183 (1.03)
OWG=oil well gas; GWG=gas well gas; all volumes are in MMCF

Read Full Post »

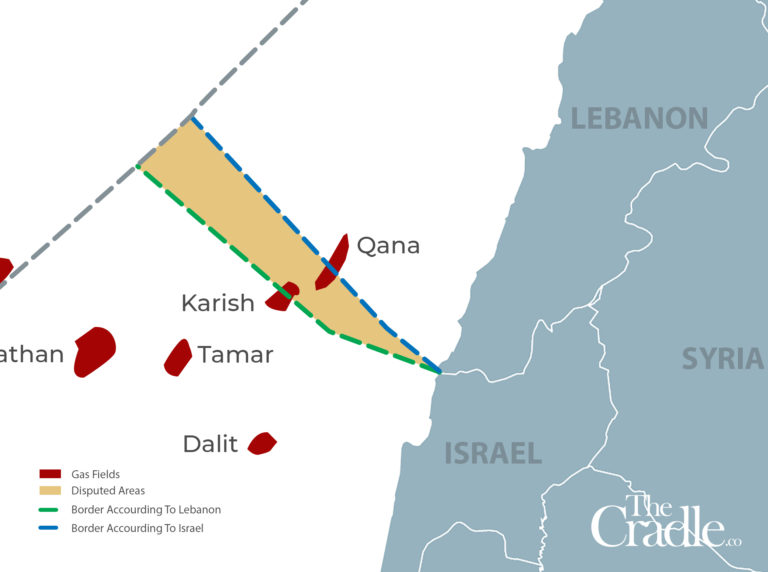
In a world where diplomacy seems to be lacking, it’s nice to learn that Israel and Lebanon have reached an agreement on their maritime boundary, and that both countries are satisfied. Based on press reports, it appears that the Qana gas field will fall under the control of Lebanon and that Israel will control the Karish field. Good for Lebanon, good for Israel, and good for energy!

Read Full Post »

« Newer Posts - Older Posts »