Some northeast states and their public utilities may be in a bit of a bind. Either they accept higher electric rates and the likely public backlash, or they deviate from their staunch anti-gas, anti-nuclear orthodoxy. Similarly, oil companies that have invested heavily in offshore wind may find that they are not just less profitable, but (even) less popular.
Something here does not remotely add up. If New York state succeeds by 2030 in closing its natural gas plants — the plants that account for 60% of the State’s generation capacity — that would bring our total installed capacity down from 37.5 GW to as little as 15 GW. But we need almost 60 GW to meet projected demand. And that’s 60 GW that can be called on any time as needed to meet peak usage. The 9 GW of projected offshore wind turbines wouldn’t make much of a dent even if they operated all the time and could be dispatched to meet peak demand, which they can’t. Instead, they will operate only about a third of the time, and at their own whim. At best they will provide about 3 GW on average, when what we need for this full electrification project is more like 45 GW of dispatchable power to add to our existing hydro and nuclear.
Offshore platforms: In some regions, there is a push to power platforms with renewable energy transported by electric cable. Currently, most platforms are efficiently powered by gas turbines which satisfy energy needs even when demand spikes during well operations like tripping out of the hole. The extent to which renewables can reliably support platform operations during these and other operations, when power interruptions are unacceptable from a safety standpoint, is a risk that must be assessed prior to committing to alternative energy sources.
The environmental benefits of powering platforms with renewable energy also have not been clearly documented. In most cases, offshore platforms produce sufficient gas to support their power demands. Should platforms be powered by imported electricity, gas that is not used for platform operations would presumably be marketed for consumption elsewhere or reinjected.
If the gas is marketed and consumed elsewhere, there is essentially no net (global) CO2 emissions reduction benefit. Gas that is reinjected is wasted unless there is an enhanced oil recovery benefit. So, the net environmental benefit from importing electric power seems questionable, and the operational risks could be significant.
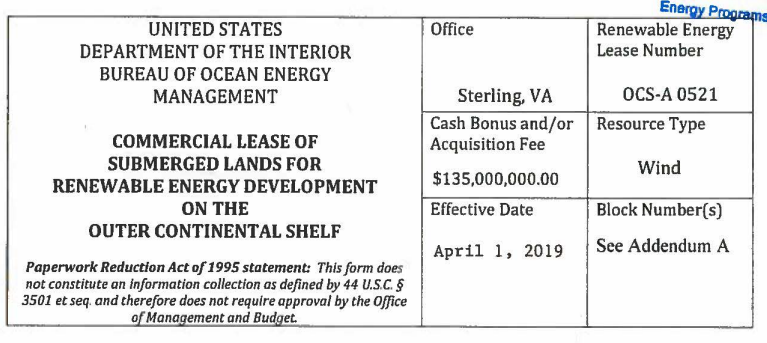
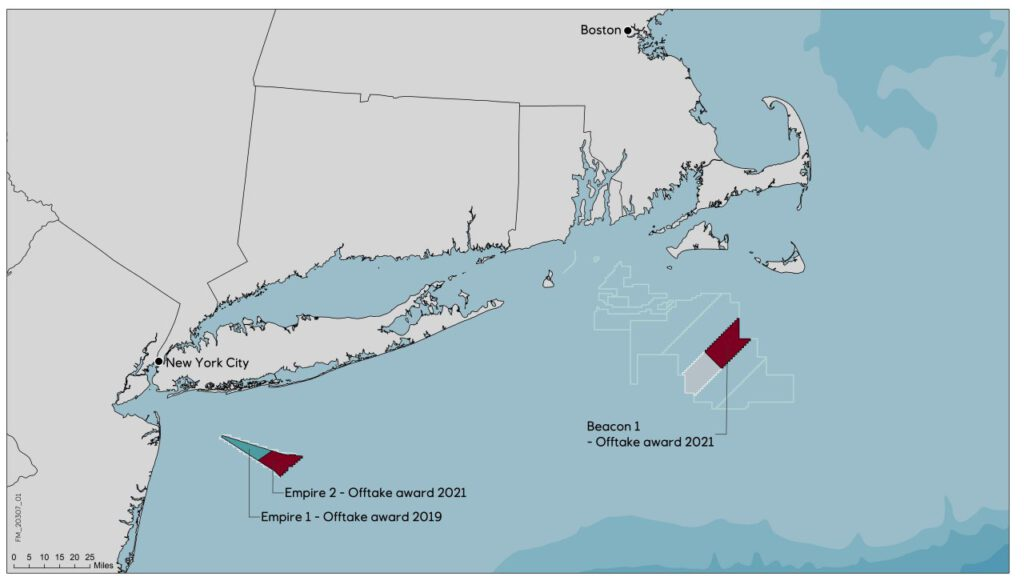
According to the New York State Energy Research and Development Authority, this would result in an average 54% price hike across their portfolio. The strike prices would rise from $118.38 to $159.64/MWh for Empire Wind 1, from $107.50 to $177.84/MWh for Empire Wind 2, and from $118.00 to $190.82/MWh for Beacon Wind.
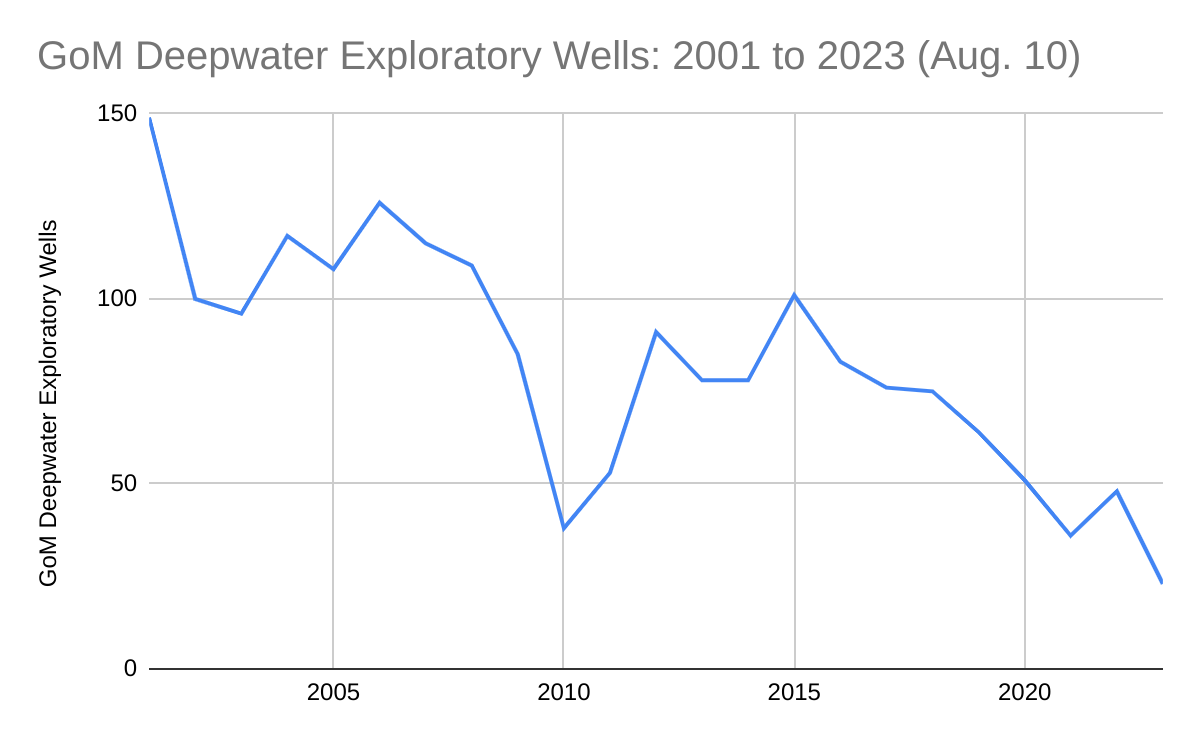
Record low exploratory drilling: 2023 will be the third consecutive year with fewer than 50 deepwater exploratory well starts. The only other year this century with <50 deepwater exploratory well starts was 2010 when there was a post-Macondo drilling moratorium.
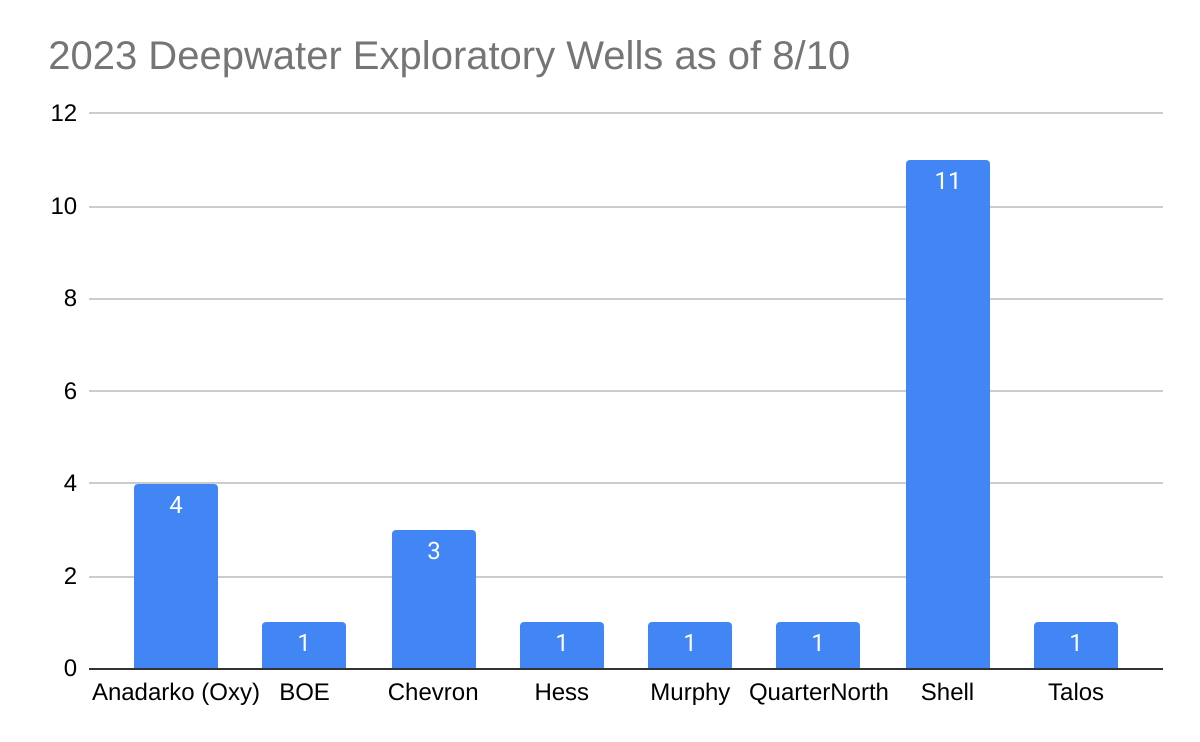
Low participation: Only 8 companies have started deepwater exploratory wells in 2023 YTD. Anadarko, Chevron, and Shell drilled 78% of the wells, with Shell alone accounting for 48%. Compare these numbers with 2001, when 24 companies drilled 149 deepwater exploratory wells.
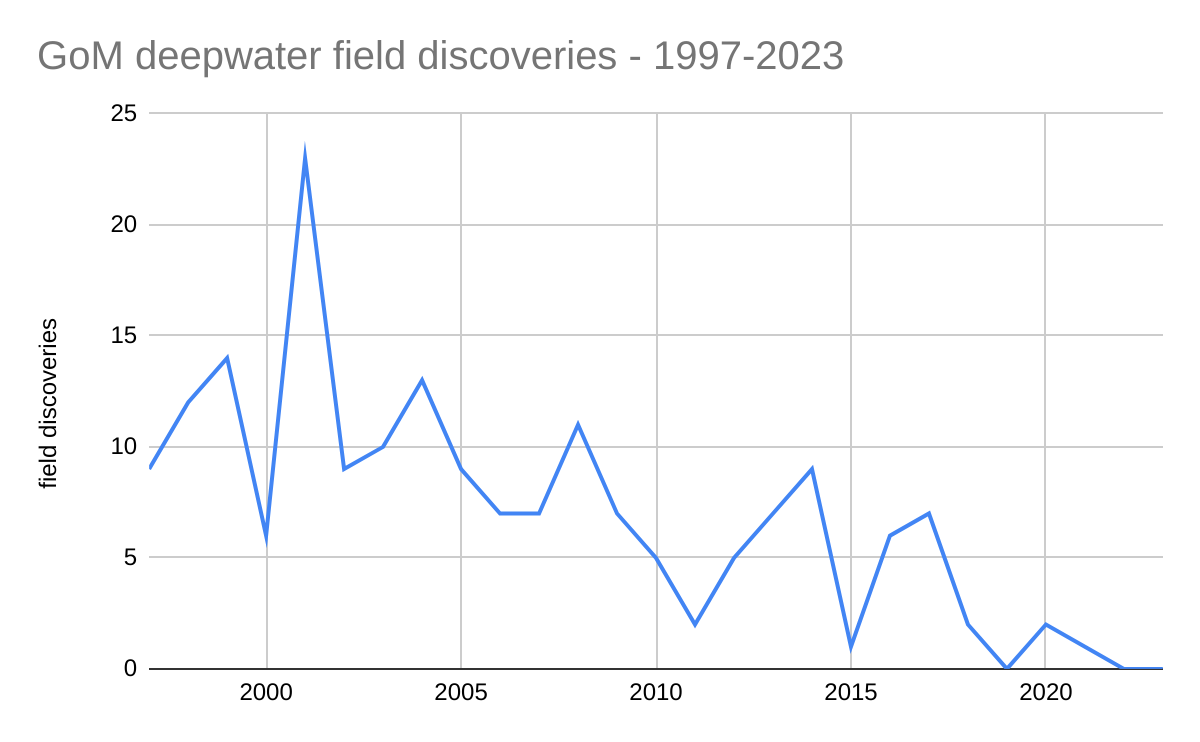
Absence of new field discoveries: Per BOEM’s database, no deepwater fields have been discovered since March 2021 and there were only 3 discoveries in the past 5 years (see chart below)
Leasing and regulatory uncertainty: When will the 5 year leasing plan be finalized and how much will leasing be restricted? What will be the effect of the expanded Rice’s whale area on deepwater operations? To what extent is this expansion justified? What other legal and regulatory threats are on the horizon?
Unrealistic expectations regarding the “energy transition:” In a stunning introductory statement, the Proposed 5 Year Leasing Plan expressed concerns that new leases would produce too much oil and gas for too long. OPEC+ must love the way the US sanctions its own energy production, most notably the oil and gas resources of the OCS. More than 96% of the OCS is off-limits to oil and gas leasing, and the 5 year plan proposed to constrain leasing in the only areas that remain. The favored offshore wind program was intended to be a complement to, not a replacement for, the oil and gas program. Wind energy is limited by intermittency, space preemption, navigation, and wildlife protection concerns.
Some companies have visions of the GoM as a carbon dumping hub: The largest US oil company, which hasn’t drilled a well in the GoM in nearly 4 years and operates just one production platform, seeks praise and profit by sequestering CO2 beneath the Gulf while maximizing oil production elsewhere. How will this sustain economically and strategically important GoM oil and gas production?
Savvy marketing? Looking for mandates and incentives? Taxation opportunity?
Burps are the top source of methane emissions from cattle. Semex, the genetics company that sold Loewith the semen, said adoption of the low-methane trait could reduce methane emissions from Canada’s dairy herd by 1.5% annually, and up to 20%-30% by 2050.
The Canadian government currently offers no incentives for low-methane cattle breeding, but the agriculture department said in an email that Ottawa is working to introduce offset credits for reducing methane through better manure management.
New Zealand will begin taxing farmers for methane from cattle in 2025.
Juha Nousiainen, senior vice-president at Valio, a Finnish dairy, warned that breeding cattle to burp less methane could create digestive problems. Methane is produced by microbes in the cow’s gut as it digests fibre, not by the animal itself, he said.
We have our own genetically engineered livestock offshore. 😀
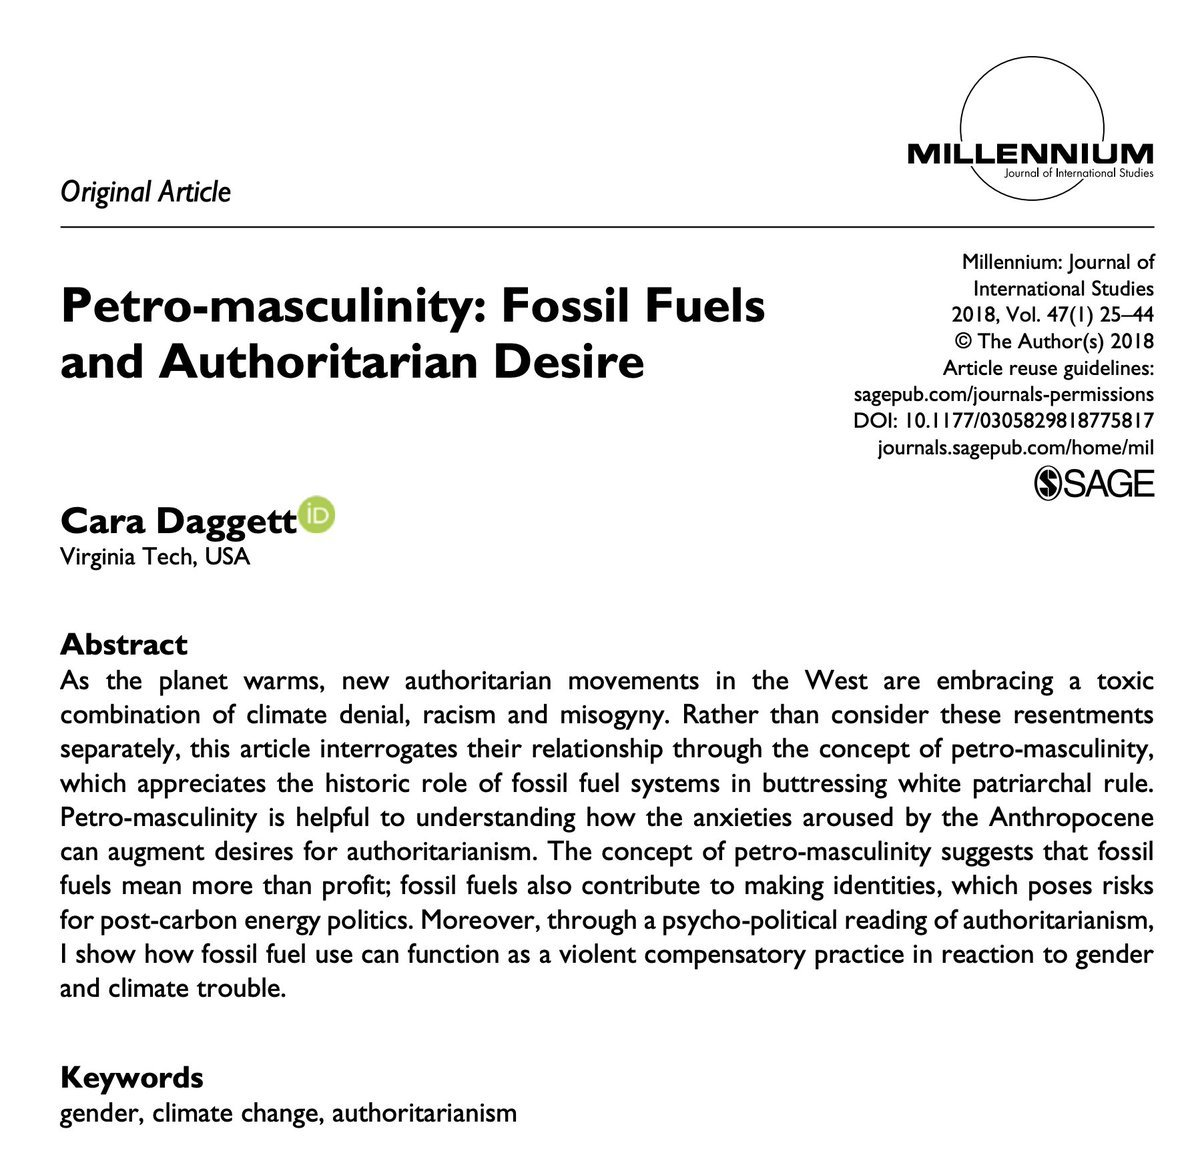
The paper is short on facts and long on dogma and political rhetoric, but is not entirely without merit. The author acknowledges, albeit in a backhanded manner, the massive social benefits that fossil fuels have provided (quote below). Would our economy have been strong enough to support academic pursuits such as hers were it not for fossil fuels and “petro-masculine” ingenuity and labor?
“Fossil fuels built the modern world. There remains an appreciation for fossil fuels – or, at least, for the high energy consumption they provided – as a catalyst of mass liberal democracy. This is evident in ecomodernist calls for a good Anthropocene that would decouple the benefits of fossil fuels from the fuels themselves. After all, while industrialisation wreaks planetary destruction, its spread was coterminous with humanist victories like the abolition of slavery, increased literacy rates, gender equality and poverty reduction. Dipesh Chakrabarty notes that this cannot be a coincidence, and that ‘the mansion of modern freedoms stands on an ever-expanding base of fossil-fuel use. Most of our freedoms so far have been energy-intensive.“
The latest World Bank data tell us that significant gas flaring issues persist. Worldwide, 138,549 million m3 of gas were flared in 2022. This equates to a massive 4 tcf, the equivalent of the reserves in a major gas field and more than 5 times the total gas production in the Gulf of Mexico in 2022.
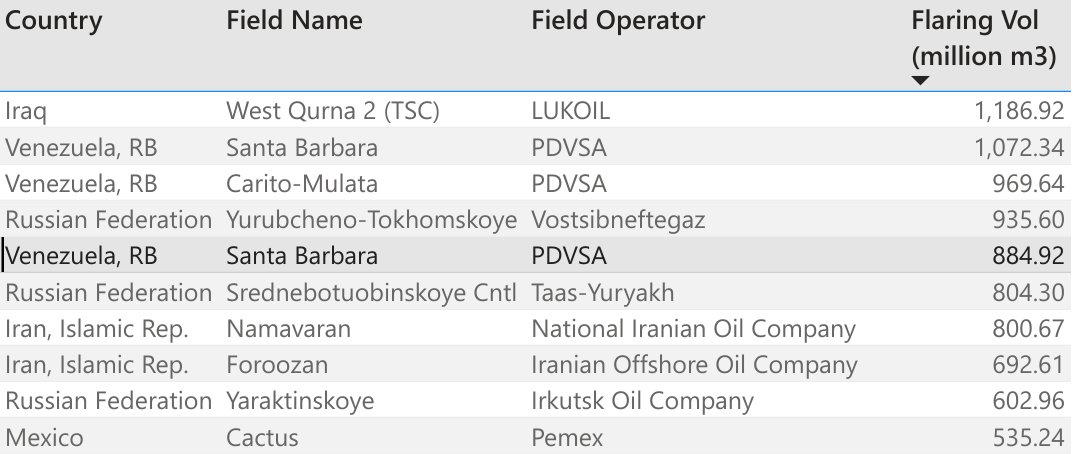
The top ten “flarers” are listed below. Each of these fields flared from 19 to 42 bcf. For comparison, the top ten GoM gas producers in 2022 produced 10 to 57 bcf, so single fields are flaring more than GoM companies are producing in total. Assuming for discussion purposes a gas-oil ratio of 1000 cu ft/bbl, all of the gas associated with 19 million to 42 million barrels of oil production was wasted from each field.
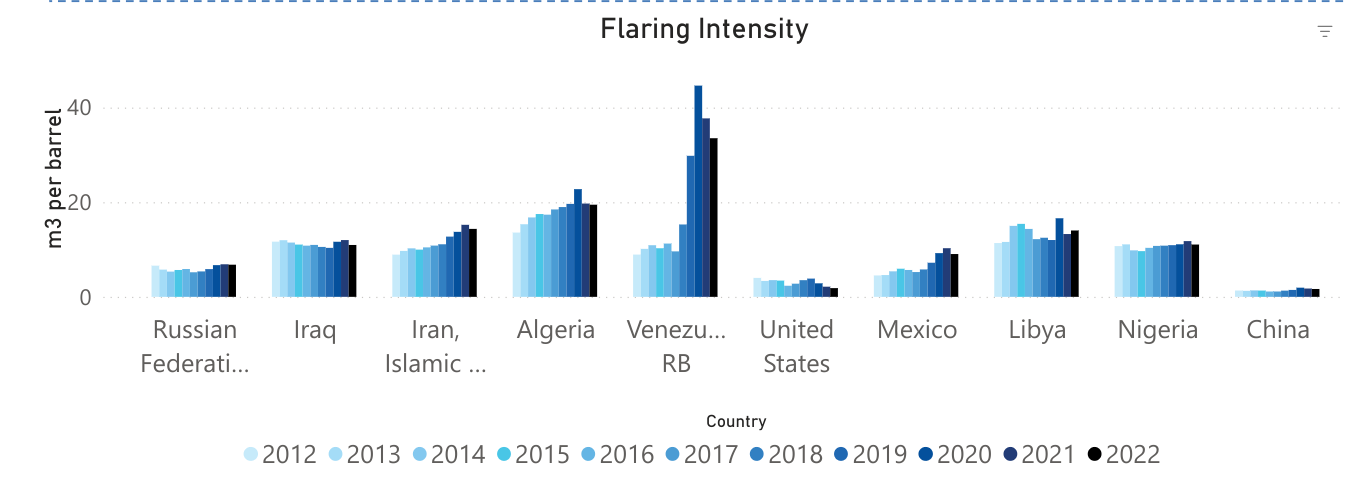
Posted below are the World Bank’s flaring intensity data (m3 of gas flared per bbl of oil produced) for the 10 countries with the highest flaring volumes. Venezuela’s flaring intensity rose to 44.6 m3/bbl in 2020, before declining moderately the following 2 years. 44.6 m3/bbl equates to 1575 cu ft/bbl. This gas flaring to oil production ratio implies that a very high percentage of Venezuela’s associated gas production was flared.
Here in North America, we have flaring issues of our own. Mexico’s Cactus Field is a top ten flarer (first table above) with 534.5 million m3 flared in 2022. The World Bank also lists 6 Permian Basin fields with >50 million m3 of gas flared in 2022.
Zeroing in on the US/Canada offshore sectors, fields with >1 million m3 of gas flared (2022) are listed below. Four of the top 7 are offshore Alaska and Newfoundland where the gas cannot currently be marketed and reinjection, field use, and flaring are the only options. Can production from these fields be better managed to reduce flaring volumes?
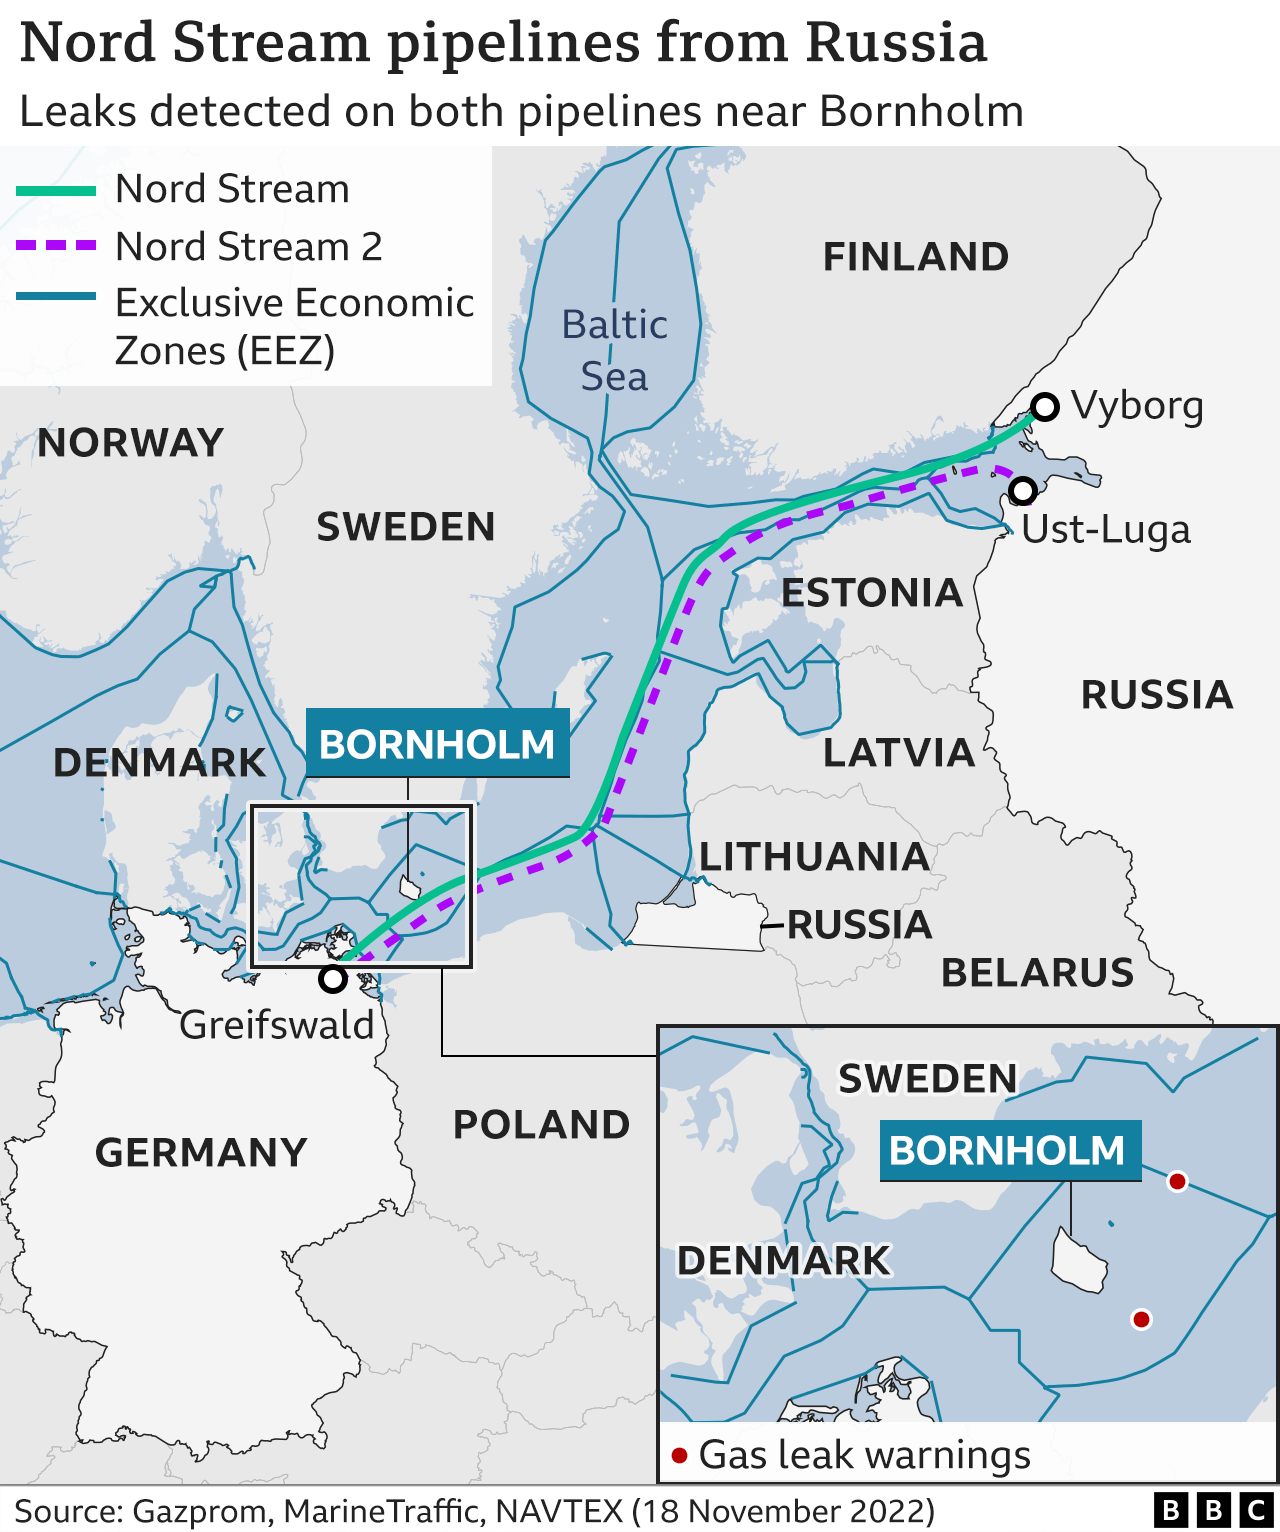
So at this time, some theories on the culprits appear to have dropped out. Those that are still in play include various versions of the Ukrainian rental yacht narrative and the Hersh account. Hopefully, the responsible parties will be identified, but given the political stakes, this is becoming increasingly unlikely.
This CBC story, which includes excellent video interviews, was brought to my attention by Newfoundlander Howard Pike, an engineer and offshore safety leader.
We know a lot about Rigs-to-Reefs, and the importance of active and reefed platforms in providing the habitat, shelter, and food that is necessary to increase biodiversity and productivity. However, the carbon reduction potential of artificial reefs has received little attention.
The linked CBC story is particularly interesting in that it includes interviews with artificial reef researchers who are assessing the carbon capture aspects. To date the results are encouraging:
As for the impact on climate change, the researchers say they have found some evidence that an artificial reef could hold more carbon compared to a natural reef.
The NOIA/ICF report is favorable from a Gulf of Mexico perspective, but 2 general caveats should be highlighted:
“The estimation of the production related GHG for various crude oils and condensates is a complex process that is hindered by lack of public, up-to-date, and high-quality data.“
“There is considerable controversy regarding certain critical data including quantity of gas flared, operational flare efficiencies, and the volumes of methane releases along oil and gas supply chains.”
Comments:
More work is needed to better determine cold venting volumes:
Table 7, p. 13, of the NOIA/ICF report indicates venting (methane) emissions of 71,200 metric tons/year for GoM operations. That number is aligned with the 2017 GOADS data (70,488 tons per Table 6-11, p. 112).
The recent PNAS report found that much more gas is being vented: 410,000 – 810,000 tons annually. If the PNAS findings are accurate, venting is being significantly underestimated and/or under-reported.
Per ICF, lower flaring and venting volumes are the main reason for the GoM’s lower GHG emission intensity, so data accuracy is important. The difference between the government data and the PNAS findings (see table below) should be carefully assessed.
The NOIA/ICF report did not distinguish between GoM deepwater and shelf emissions.
The PNAS report indicates much higher methane emissions intensity on the shelf, as do most subjective assessments.
Future studies should provide separate GHG intensity data for shelf and deepwater facilities.
All production cannot be from the lowest emission intensity sources. The objective should be to minimize emissions from each source, not to eliminate production.GoM shelf operations have other advantages, most notably the production of nonassociated natural gas.