Feeds:
Posts
Comments

5.62% of the oil and 9.68% of the gas remain shut-in.

BSEE data as of 12:30 p.m. ET on the specified date. Peak figures highlighted. The 9/17 report was BSEE’s final update.

date9/109/119/129/139/149/159/169/17
oil s.i.(BOPD)
% of total
412,070
23.55
674,833 
38.56
730,472
41.74
732,316
41.85
522,233
29.84
338,690
19.35
213,204
12.18
101,778
5.62
gas s.i.(MMCFD)
% of total
494
25.56
904
48.77
991.7
53.32
973.2
52.3
755
40.6
514.8
27.64
298
16.02
180
9.68
platform evacs
% of total
130
35
171
46
169
45.55
144
31.81
52
14
37
10
24
6.47
16
4.31
rig evacs
% of total
2
40
3
60
3
60
2
40
0
0
0
0
00
DP rigs moved
% of total
3
15
4
20
2
10
2
10
2
10
2
10
00
Federally funded decommissioning in the Matagorda Island area of the Gulf of Mexico. Not a success story.

I’m not typically aligned with the sponsors of the attached “Plug Offshore Wells Act,” but the call for transparency is understandable given that taxpayer funds are, for the first time, being used to decommission offshore platforms in the Matagorda Island area of the Gulf of Mexico, massive liabilities associated with the Cox bankruptcy loom, and the Hogan and Houchin saga drags on without resolution.

The bill would require an annual report on well, platform, and pipeline decommissioning including applications, deadlines, and enforcement actions. BSEE does have a good facility infrastructure page for the GoM, but much of the information called for in H.R. 9168 is not publicly available.

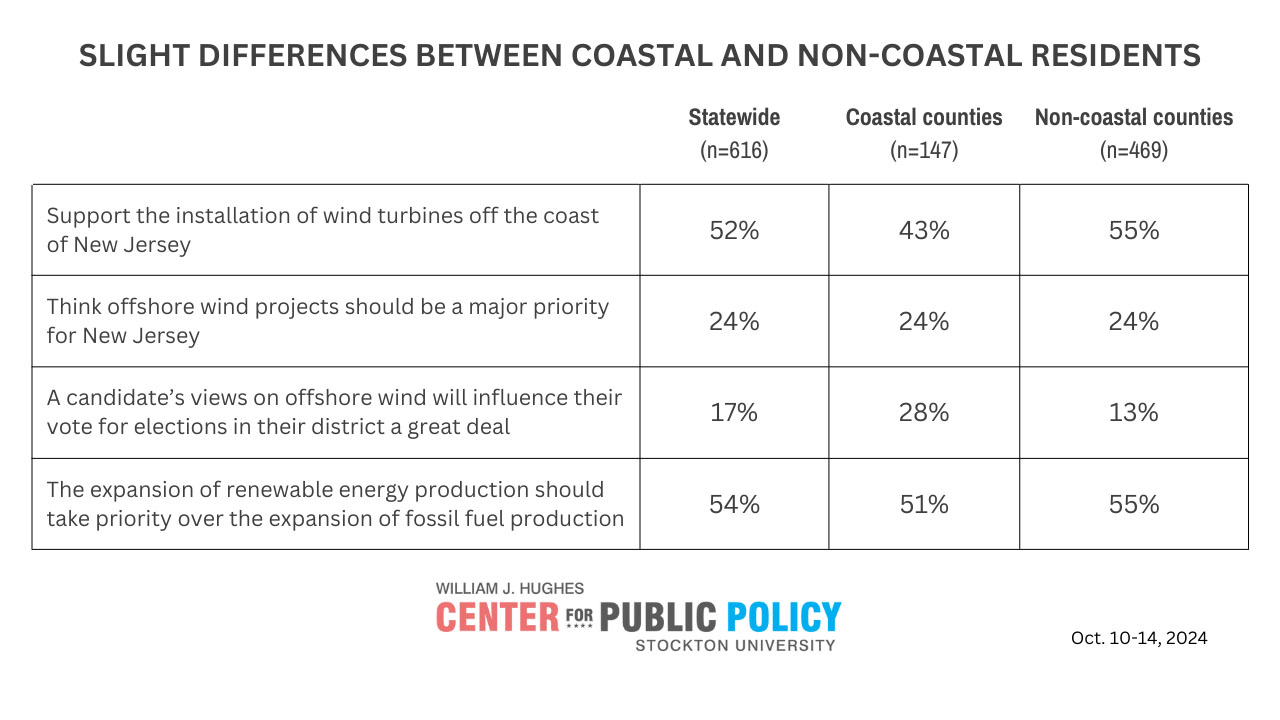
Improved oversight of decommissioning requirements for offshore wind projects should also be considered in light of the precedent setting waiver granted to Vineyard Wind and BOEM’s “modernization rule” that relaxes financial assurance requirements for wind development.

BSEE data as of 12:30 p.m. ET on the specified date. Peak figures highlighted.

date9/109/119/129/139/149/159/16
oil s.i.(BOPD)
% of total
412,070
23.55
674,833 
38.56
730,472
41.74
732,316
41.85
522,233
29.84
338,690
19.35
213,204
12.18
gas s.i.(MMCFD)
% of total
494
25.56
904
48.77
991.7
53.32
973.2
52.3
755
40.6
514.8
27.64
298
16.02
platform evacs
% of total
130
35
171
46
169
45.55
144
31.81
52
14
37
10
24
6.47
rig evacs
% of total
2
40
3
60
3
60
2
40
0
0
0
0
0
DP rigs moved
% of total
3
15
4
20
2
10
2
10
2
10
2
10
0

We have been closely watching Exxon’s high potential Persephone well in Newfounland’s Orphan Basin. Unfortunately, Exxon has announced that the well failed to discover commercial hydrocarbons.

While exploration technology has improved significantly, the success rate for wildcat exploratory wells is still only about 30%. According to Rystad, only eight of the 27 high-impact wells drilled in 2023 resulted in commercial discoveries.

In baseball terms, the smaller independents are typically singles hitters, drilling development wells and gleaning reserves from established fields. The majors tend to be home run hitters. They swing hard and often miss, but when they hit, the rewards are great!

The search for deepwater elephants will continue.

JPT

BSEE data as of 12:30 p.m. ET on the specified date.

date9/109/119/129/139/149/15
oil s.i.(BOPD)
% of total
412,070
23.55
674,833 
38.56
730,472
41.74
732,316
41.85
522,233
29.84
338,690
19.35
gas s.i.(MMCFD)
% of total
494
25.56
904
48.77
991.68
53.32
973.2
52.3
755
40.6
514.8
27.64
platform evacs
% of total
130
35
171
46
169
45.55
144
31.81
52
14
37
10
rig evacs
% of total
2
40
3
60
3
60
2
40
0
0
0
0
DP rigs moved
% of total
3
15
4
20
2
10
2
10
2
10
2
10

BSEE data as of 12:30 p.m. ET on the specified date.

date9/109/119/129/139/14
oil shut-in (BOPD)
% of total
412,070
23.55
674,833 
38.56
730,472
41.74
732,316
41.85
522,233
29.84
gas s.i. (MMCFD)
% of total
494
25.56
904
48.77
991.68
53.32
973.2
52.3
755
40.6
platforms evacuated
% of total
130
35
171
46
169
45.55
144
31.81
52
14%
rigs evacuated
% of total
2
40
3
60
3
60
2
40
0
0
DP rigs moved
% of total
3
15
4
20
2
10
2
10
2
10

Slippery slope …

… when you seek to restrict speech because you don’t like the speaker or disagree with the message.

A Toronto politician wants to ban “misleading fossil fuel ads” on public transit. The pictured ad presents a straightforward message that is reasonable for an organization like Canada Action to convey. Opposing views are well represented in government and the media.

BSEE data as of 12:30 p.m. ET on the specified date.

date9/109/119/129/13
oil shut-in (BOPD)
% of total
412,070
23.55
674,833 
38.56
730,472
41.74
732,316
41.85
gas s.i. (MMCFD)
% of total
494
25.56
904
48.77
991.68
53.32
973.2
52.3
platforms evac.
% of total
130
35
171
46
169
45.55
144
31.81
rigs evacuated
% of total
2
40
3
60
3
60
2
40
DP rigs moved
% of total
3
15
4
20
2
10
2
10

As previously posted, Santa Barbara County reached an agreement with current SYU operator Sable Offshore that will allow the installation of pipeline shutdown valves. Given that the valves are required by the State Fire Marshall, the County was not likely to win this dispute. The County wisely decided that the financial risks were too high:

If we continued to fight this out in court, [Sable] likely would have sought to recover lost revenue from the pipeline not being in operation,” said Supervisor Steve Lavagnino. “That could amount to millions of dollars the County would be on the hook for.”

The Environmental Defense Center and others are calling for the County to retract their agreement with Sable and hold a public hearing on the matter. That appears to be unlikely.

Remaining hurdles for Sable include approval by the State Fire Marshall after the valves are installed and operational, State Lands Commission approval of lease assignments from Exxon to Sable, and approval of the oil spill contingency plan by the State Dept. of Fish and Wildlife.

Sable believes they can resume production this year. That seems unlikely, but a 2025 restart is now a distinct possibility.

BSEE data for the past 3 days are tabulated below. Data are as of 12:30 p.m. ET on the specified date. Barring offshore or downstream infrastructure damage, production should begin to resume over the next few days.

Prior to the shale boom, when our national production was lower and the OCS accounted for a larger share, these numbers would have had a more significant effect on oil and gas prices. That is not the case today with only a 2.4% rise in WTI prices.

date9/109/119/12
oil shut-in (BOPD)
% of total
412,070
23.55
674,833 
38.56
730,472
41.74
gas s.i. (MMCFD)
% of total
494
25.56
904
48.77
991.68
53.32
platforms evac.
% of total
130
35
171
46
169
45.55
rigs evacuated
% of total
2
40
3
60
3
60
DP rigs moved
% of total
3
15
4
20
2
10