Feeds:
Posts
Comments

Archive for the ‘gas’ Category

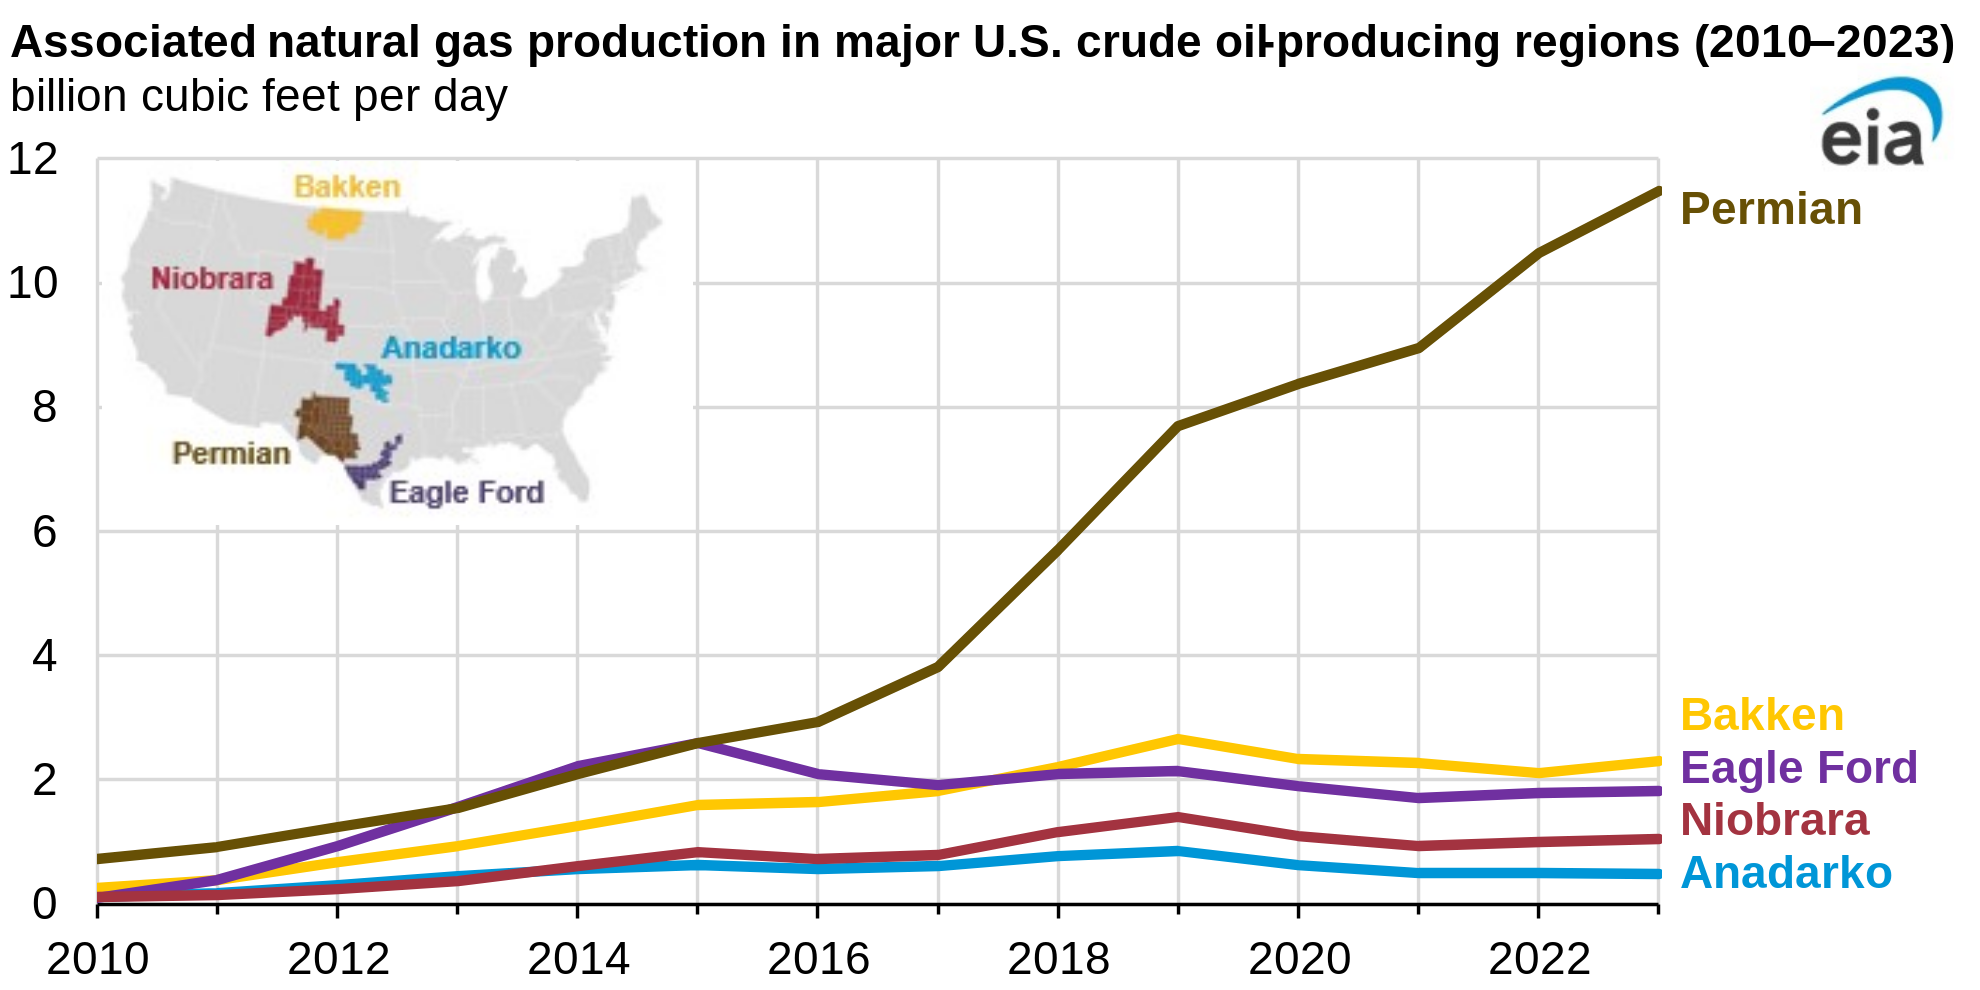
The EIA reports an 8% increase in 2023 US associated gas production as crude oil production rose to record levels.  The Permian Basin, the dominant US crude oil producer, is unsurprisingly the leading associated gas producer.

EIA’s analysis inexplicably ignores the Gulf of Mexico OCS. The Gulf produced an average of 1.64 bcf/d of casinghead (associated) gas in 2023, ranking the GoM just behind the Eagle Ford and significantly above the Niobrara and Anadarko regions (see chart above). It’s also noteworthy that most production from the regions on the EIA chart is from private land, and is not constrained by 5 year leasing plans and other restrictive Federal policies.

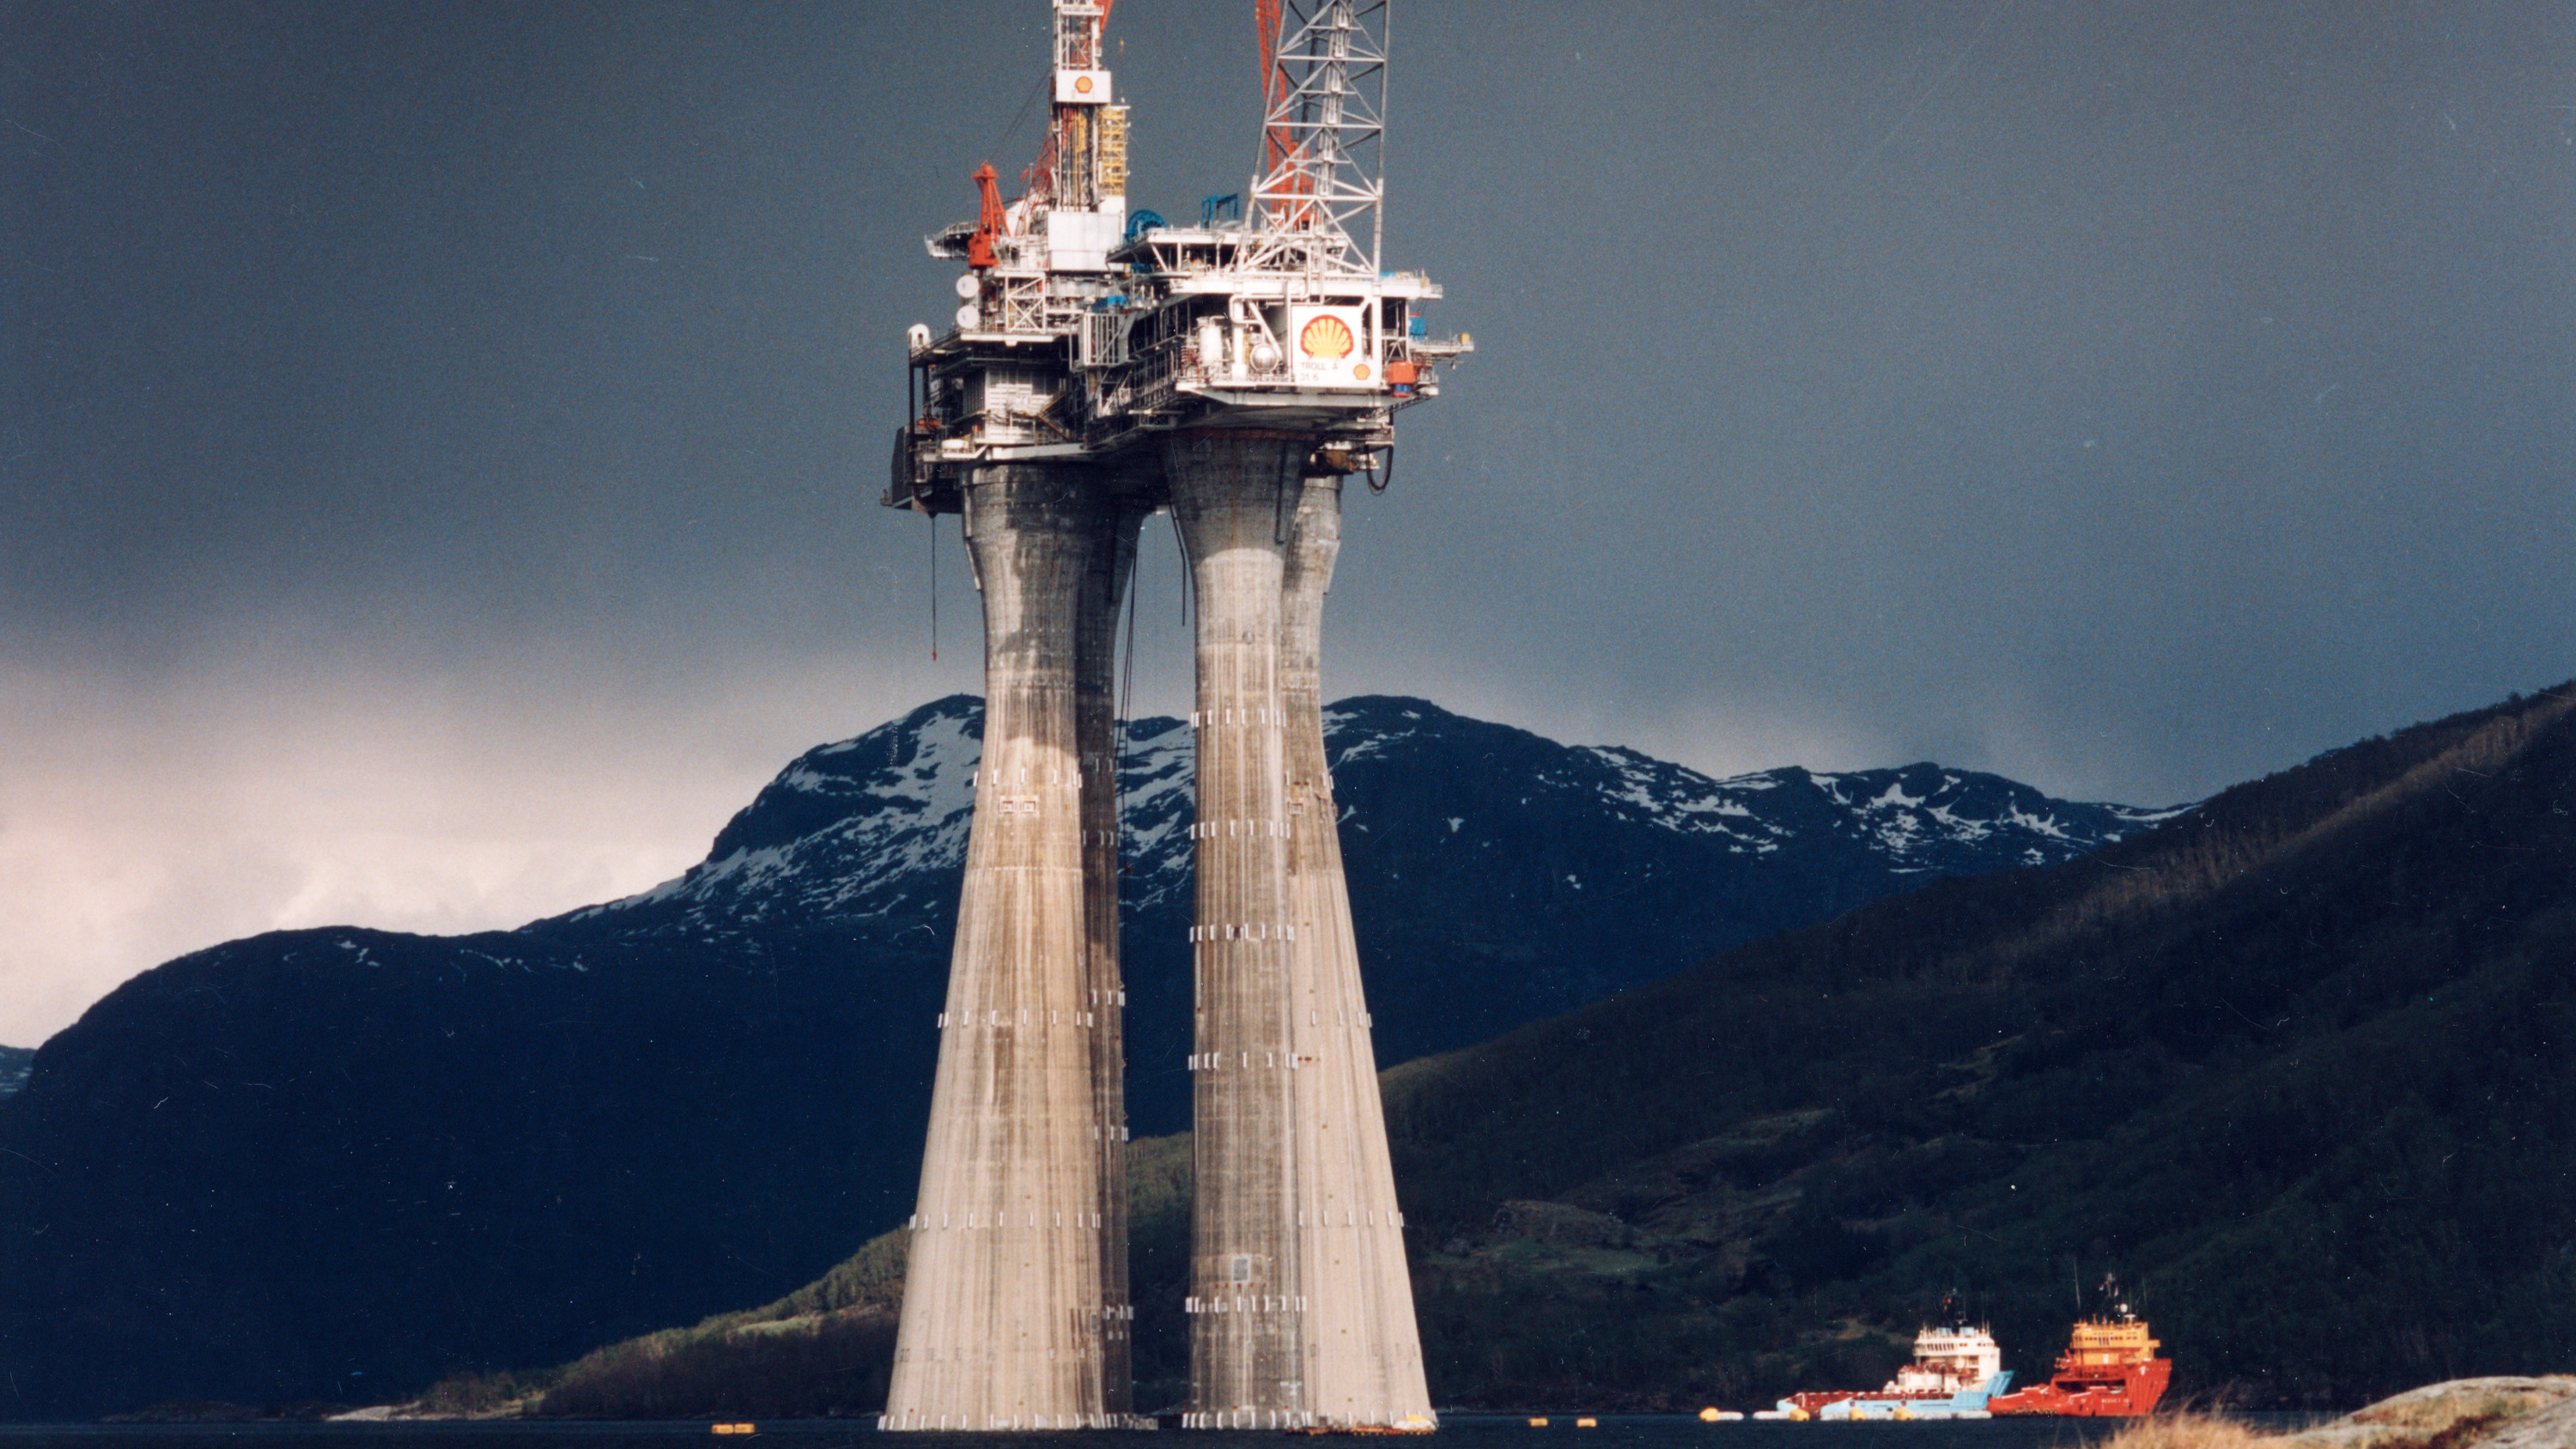
80% of GoM gas production is from deepwater leases. The % of associated gas produced on deepwater leases is even higher. The 2 leading GoM gas producers, Shell and bp, only operate deepwater leases. The % of their 2023 gas production that was associated gas was 93% for Shell and 100% for bp.

Read Full Post »

Offshore gas has important environmental advantages, particularly nonassociated gas-well gas (GWG). While the GoM production chart (below) is not pretty, there are signs that gas production may have bottomed and is slowly rising. This is largely due to growth in oil-well gas (OWG) associated with deepwater oil production.

A successful offshore program requires a mix of strategies, and it is encouraging that companies are still pursuing natural gas on the GoM shelf. The second chart (below), based on BOEM data, shows 2022 YTD (probably through Oct.) GWG production for the 11 companies that (1) produced more GWG than OWG and (2) produced more than 1 BCF of GWG.

Interestingly, 100% of the gas produced by Contango, Samchully, and Helis in 2022 was from gas wells. Contrast this with bp, the third largest GoM gas producer. None of bp’s gas production was from gas wells.

One has to wonder about the extent to which deepwater gas reservoirs are being stranded due to the less favorable economics. Preventing such resource losses was once an important regulatory consideration given the conservation mandate in the OCS Lands Act and the importance of maximizing the public benefit. However, current policy, as expressed in the proposed 5 year leasing plan, is to phase out offshore production rather than sustain it. This is difficult to reconcile.

Read Full Post »

Further, per the ONRR data:

Oil-Well Gas
Produced
(BCF)
Gas-Well Gas
Produced
(BCF)
total gas
produced
(BCF)
total gas flared
or vented
(BCF)
% flared
or vented
2015588.4719.41307.810.30.8
2016631.7589.11220.89.70.8
2017637.3441.21078.59.90.9
2018623.1370.1993.210.61.1
2019670.2364.11034.311.71.1
2020581.4224.9806.310.41.3
2021582.2209.5791.78.21

Read Full Post »

Gulf of Mexico flaring and venting data have been sorted for the years 2015-2021. The reporting of these data is mandatory and strictly enforced, so these ONRR numbers should be accurate.

Biggest surprise: The biggest surprise is that there were no big surprises in the data. The % of gas flared and vented were generally consistent with expectations based on familiarity with historical data.

Biggest disappointment: the continued sharp decline in nonassociated (gas-well) gas production. GoM gas well gas production exceeded 4 tcf annually in the 1990s and was still above one tcf ten years ago. Since then, GWG production has declined by 80%. Nonassociated offshore natural gas has important environmental advantages, so the decline in production should be a major concern to policy makers

Encouraging sign: The % of oil-well gas vented has ticked down over the past 2 years which is encouraging from a GHG standpoint. This is presumably because most associated gas is produced on modern deepwater facilities equipped with flare booms. An astute politician would be rushing to take credit for this achievement.😀

Unfavorable ratio: Although the volumes are low (<1 Bcf combined in 2021), more gas-well gas was vented each year than flared. This is presumably because older shelf facilities without flare booms still produce much of the natural gas.

Abbreviations:

  • ONRR: Office of Natural Resources Revenue
  • GoM: Federal waters of the Gulf of Mexico
  • OWGP: oil-well gas production
  • GWGP: gas-well gas production
  • OWGF: oil-well gas flared
  • OWGV: oil-well gas vented
  • GWGF: gas-well gas flared
  • GWGV: gas-well gas vented

Read Full Post »

NASA has identified 50+ super-emitters of methane including sites in Turkmenistan (image below) that emit an estimated 111,000 pounds per hour.


By comparison, vented Gulf of Mexico methane emissions in 2021 totaled 1953 mmcf. This converts to 82 million pounds at atmospheric pressure and 60°F. The identified Turkmenistan sources would thus release the amount of methane in a month that all Gulf of Mexico facilities vent in a year (2021).

East of Hazar, Turkmenistan, a port city on the Caspian Sea, 12 plumes of methane stream westward. The plumes were detected by NASA’s Earth Surface Mineral Dust Source Investigation mission and some of them stretch for more than 20 miles (32 kilometers).

Read Full Post »

ONRR mandatory production reporting data are being sorted to assess GoM flaring and venting trends. This will help resolve inconsistencies previously identified. In the meantime, the table below summarizes the 2021 data. 1.03% of the gas produced that year was flared or vented. 0.25% of the gas production was vented.

Interestingly, more gas-well gas was vented than flared. This is presumably because older shelf facilities without flare booms still produce 25% of the gas (versus only 7% of the oil), mostly from gas wells. More to follow.

gas
production
flared (%)vented (%)flared &
vented (%)
OWG582,2045919 (1.01)1405 (0.24)7324 (1.26)
GWG209,779311 (0.15)548 (0.26)859 (0.41)
total 791,9836230 (0.79)1953 (0.25)8183 (1.03)
OWG=oil well gas; GWG=gas well gas; all volumes are in MMCF

Read Full Post »

Kudos to ONRR for posting complete flaring and venting data for all oil and gas operations on US Federal and Indian lands. These data, which distinguish between oil-well gas and gas-well gas, are included in the large “Production Disposition by Month” file that can be downloaded here.

The data should give us a good read on flaring and venting trends and help resolve the inconsistencies previously identified.

Read Full Post »

Elements Newsletter

Where would we, and the world, be today without the shale gas revolution? 12.5 years after posting about this amazing success story, I’m still waiting for the national celebration!

For a reminder about the environmental advantages of natural gas in general, and nonassociated offshore gas in particular, see this post.

Read Full Post »

towing the Troll platform, 1995

Good article from our friends at the Petroleum Safety Authority of Norway. When old guys reminisce, people need to listen 😉

“Reagan feared that the world, and especially Europe, would become too dependent on Soviet gas, and saw Troll as an opportunity to create greater independence.”

“Lerøen sees parallels to the current situation, with Russia’s invasion of Ukraine, and the importance Norwegian gas has for the EU, which wants to become independent of Russian gas.” 

Read Full Post »

Leviathan platform, offshore Israel

Gas reserves in the Eastern Mediterranean Basin are enormous:

Now the U.S. Geological Survey estimates that as much as 122 trillion cubic feet of gas and 1.7 billion barrels of oil lie in the eastern Mediterranean basin. That amount of gas is equivalent to about 76 years of gas consumption in the European Union.

Forbes

Another US energy/foreign policy blunder?

Last January, the US informed Israel, Greece and Cyprus that they no longer supported the proposed EastMed natural-gas pipeline from Israel to Europe citing the need to “(allow) for future exports of electricity produced by renewable energy sources, benefiting nations in the region.”

Jerusalem Post

It’s time to move forward with this strategically important energy project. Chevron is now the main player in the Eastern Mediterranean after their 2020 acquisition of Noble Energy.

Read Full Post »

Older Posts »