Robert “Bobby” Nelson, a beloved father and husband, and a highly respected engineer, died suddenly last Saturday.
Jason Mathews, a Supervisory Petroleum Engineer with the Bureau of Safety and Environmental Enforcement, had this to say about his admired colleague:
“A legacy is not just what you leave for others; it’s the impact of your presence, the influence of your actions, and the memories you create.
Bobby was an exceptional engineer, father, husband and friend who had a lasting impact on many of us. In fact, I would argue Bobby was one of the most impactful engineers in my tenure on developing and transforming younger engineers on how to think critically on complex offshore systems and processes.
Bobby’s legacy in my industry will push on for many years, and we are forever grateful for the time we had with him.”
More from his colleagues:
Bobby dedicated much of his professional life to BSEE, where he served as a Technical Advisor since January 2020, and for the previous seven years as Well Operations Section Chief and Drilling Engineer in the Houma District.
His expertise in well control, drilling engineering, and offshore regulatory compliance was invaluable. He contributed significantly as a subject matter expert and assistant content writer for the BSEE Well Control Rule Revision Team, helping shape post-Deepwater Horizon reforms, and provided technical insights on critical projects ranging from tropical cyclone risk assessments for floating rigs to hydrate pressure coring expeditions and incident investigations.
Bobby’s commitment to safety and environmental stewardship on the Gulf of America’s Outer Continental Shelf left a lasting impact on his colleagues and the industry.
He is survived by his loving wife, Amber, whom he met at BSEE, and their young daughter. In this time of grief, please keep Bobby’s family in your thoughts and prayers.
For 40 years, challenges associated with bankruptcies (or the threat thereof), a divided offshore industry, political pressure, hurricane damage, and unresolved legal issues have hindered initiatives to better protect the public from decommissioning liabilities. Nonetheless, regulators and industry were able to prevent taxpayers from incurring any decommissioning costs. Unfortunately that is no longer the case.
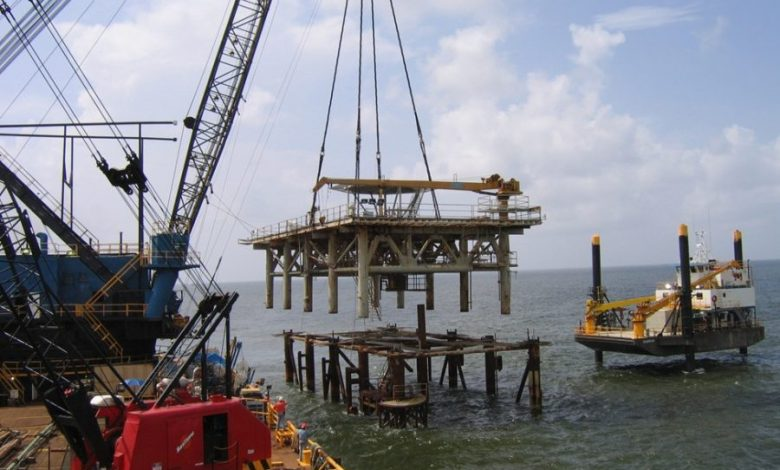
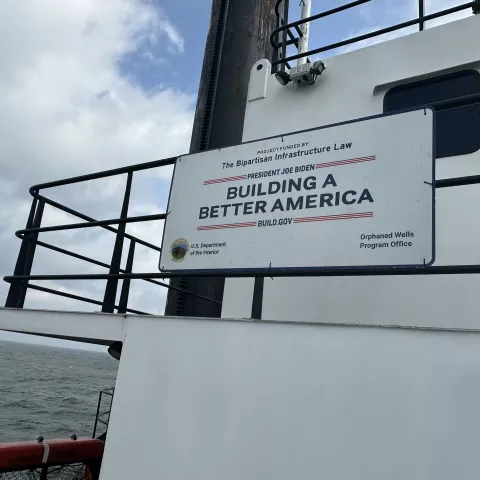
For the first time in history, the govt has funded decommissioning on the OCS (and bragged about it – photo below).
Federally funded decommissioning operation in the Matagorda Area of the Gulf.
BOEM’s proposed revisions to the decommissioning regulations (attached) would facilitate the transfer of aging structures to companies with limited assets, and in some cases, poor or undemonstrated safety records.
The proposal would reduce or eliminate the supplemental financial assurance requirement if a predecessor lessee has a strong credit rating. For that strategy to work, related decommissioning issues must be addressed. and clarifications and boundaries provided to ensure taxpayers are protected from decommissioning liabilities.
Predecessor liability, which is important because it helps prevent companies from assigning leases for the purpose of avoiding decommissioning obligations, was not established in the regulations until much of the OCS infrastructure was already installed. In a final rule that was effective on 8/20/1997,my office (thanks to the perseverance of Gerry Rhodes, John Mirabella, and Dennis Daugherty) codified the joint and several liability principle in 30 CFR 250.110 as follows:
(b) Lessees must plug and abandon all well bores, remove all platforms or other facilities, and clear the ocean of all obstructions to other users. This obligation:
    (1) Accrues to the lessee when the well is drilled, the platform or other facility is installed, or the obstruction is created; and
    (2) Is the joint and several responsibility of all lessees and owners of operating rights under the lease at the time the obligation accrues, and of each future lessee or owner of operating rights, until
the obligation is satisfied under the requirements of this part.
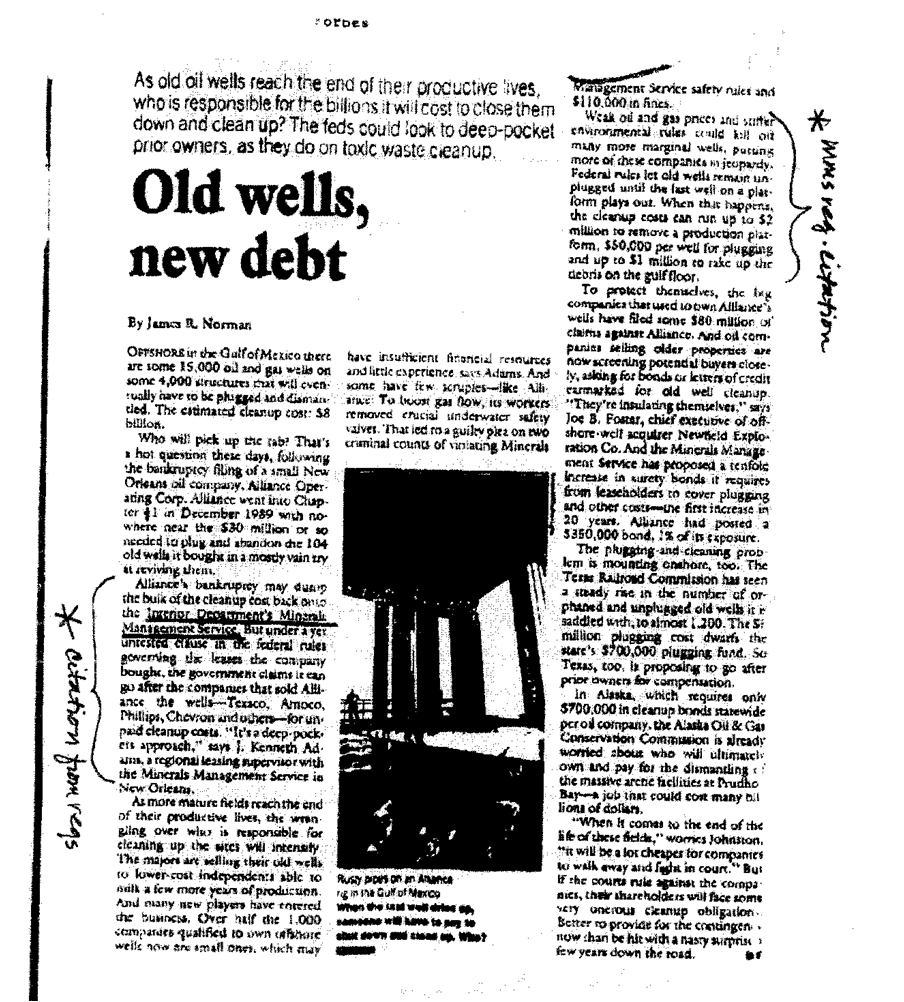
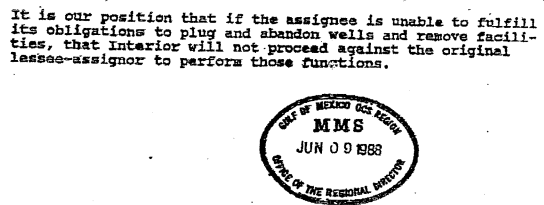
Prior to the that rule, the official policy of the Dept. of the Interior, as expressed in a 1988 letter from the Director of the Minerals Management Service (see excerpt pasted below), was that lease assignors would NOT be held accountable should their successors fail to fulfill their decommissioning responsibilities.
A major unanswered question regarding decommissioning obligations is thus the extent to which predecessor liability applies to leases assigned prior to the 1997 regulation. According to BOEM data, 771 remaining platforms were installed at least 10 years before the rule change, and 504 were installed at least 20 years prior. For assets transferred prior to the rule change, do the predecessors retain liability? BOEM should explain its position on this issue.
Other predecessor liability questions that need to be answered:
Now that the reverse chronological guidance has been scrapped, what will be the process for determining which predecessors will be held responsible?
If the govt doesn’t ensure that the new lessees fulfill their performance obligations (e.g. funding escrow accounts, well plugging, insurance, etc.), are predecessors still liable?
What if the structures were poorly maintained by the new lessees, complicating decommissioning and increasing the costs
Should a predecessor several transfers removed from operating the facilities still be held responsible?
Two examples of what can happen (and has happened):
Example 1: Big AAA Oil assigns a lease to Proud Production, a reputable independent. After years of operations, Proud can no longer profitably produce from the lease. Proud assigns the lease to CCC Oil & Gas, a small and highly efficient operator. After the lease is no longer profitable, even for a company with a low cost structure, CCC assigns the lease to Elmer’s E&P, a sketchy, barely solvent operating company with a poor compliance record. Elmer rather predictably neglects maintenance and declares bankruptcy after a decline in oil prices. Should Big AAA Oil, which had no say in the last 2 transfers in the assignment chain, be financially responsible for decommissioning the facilities?
Example 2: Big AAA Oil assigns a lease to DDD Development Company. Per the terms of the assignment, DDD establishes an Abandonment Escrow Account, as provided for in 30 CFR 556.904. BOEM allows DDD to withdraw funds from the account for purposes not authorized in the regulations. Should Big AAA Oil be liable for decommissioning costs after DDD is no longer solvent? (See “The troubling case of Platforms Hogan and Houchin.”)
For predecessor liability to be fairly and effectively implemented, and survive legal challenges, BOEM should:
Before approving lease assignments, verify that the assignors and assignees have contractually specified, to BOEM’s satisfaction, how the decommissioning of assigned assets will be funded.
Not approve subsequent lease assignments until the predecessor that is being held financially responsible has approved a funding agreement with the new lessees.
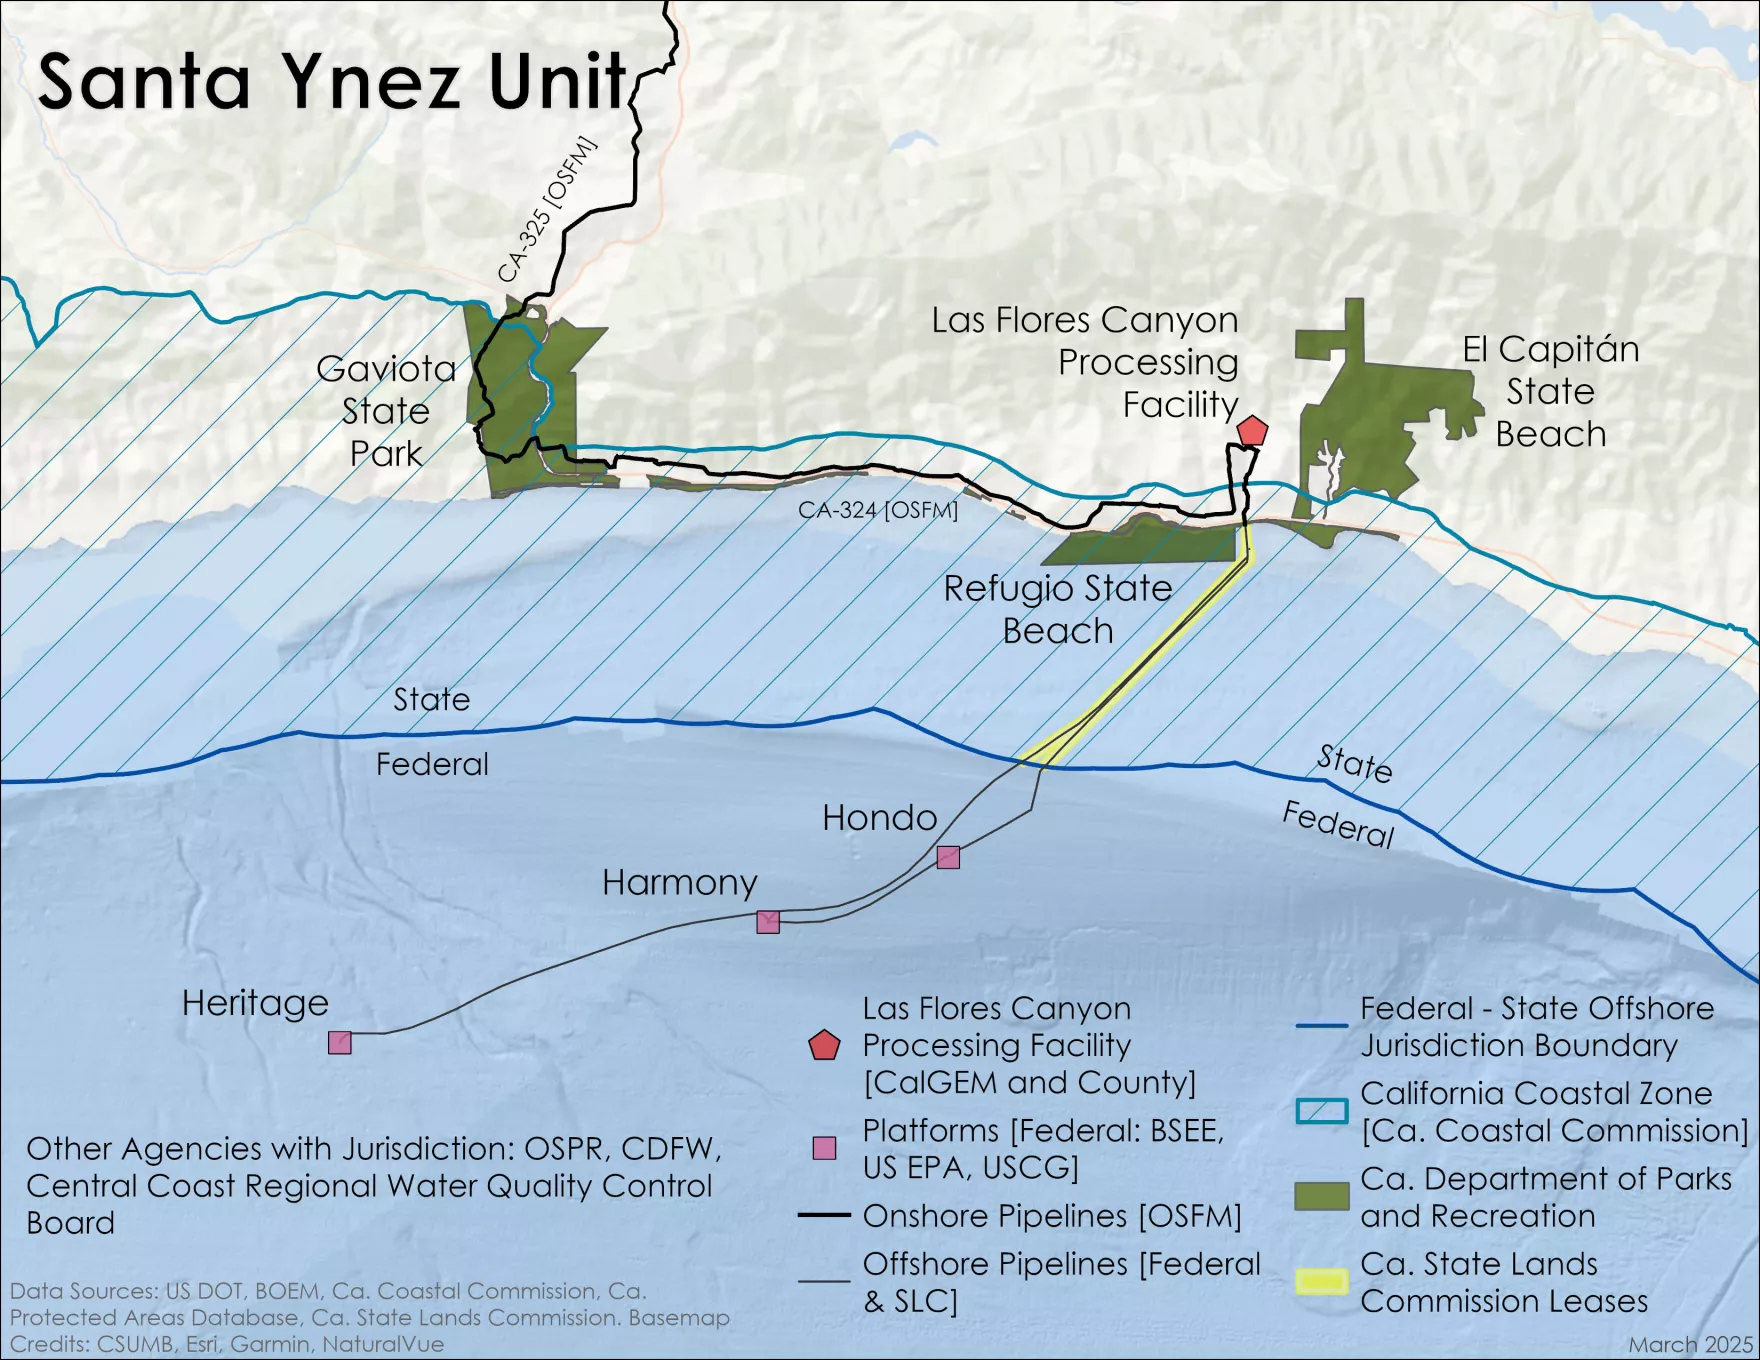
On Monday, Sable got a boost from Judge Wilson, U.S. District Court for the Central District of California. Judge Wilson denied a request by the California Department of Parks and Recreation (and other State agencies) to enjoin Sable Offshore from restarting or continuing the operation of oil pipeline segments withing Gaviota State Park.
Sable got another boost from Chevron, which agreed to buy 20,000 bopd from Sable for its El Segundo refinery.
Not to be denied, the California Attorney General filed the attached lawsuit in the U.S. District Court for the Northern District of California. The AG argues that US Energy Secretary Chris Wright has no authority under the Defense Production Act (DPA) to excuse Sable from compliance with state and federal laws and court orders. The lawsuit alleges that the DPA Order violates the Administrative Procedure Act and infringes on California’s sovereign power under the Tenth Amendment.
The suit also alleges that the Order violates the constitutional Separation of Powers by purporting to override not only state law and a preliminary injunction issued by the Santa Barbara Superior Court, but also a judicial Consent Decree approved by the U.S. District Court for the Central District of California that expressly acknowledged and approved the State’s role in reviewing and approving any planned restart of the onshore pipelines.
The AG asks the Court (p. 33) to issue a judicial declaration that the Wright Order is unconstitutional and/or unlawful because it violates the APA and the U.S. Constitution.
Read the Court filing for full details, and stay tuned. No doubt there will be more swings in momentum going forward.
TotalEnergies commits to invest approximately $1 billion—the value of its renounced offshore wind leases—in oil and natural gas and LNG production in the United States.
Following their new investment, the United States will reimburse the company dollar-for-dollar, up to the amount they paid in lease purchases for offshore wind.
Specifically, TotalEnergies will invest $928MM, in the following projects in 2026:
The development of Train 1 to 4 of Rio Grande LNG plant in Texas;
The development of upstream conventional oil in Gulf of America and of shale gas production.
Following theseTotal investments, the U.S. will terminate the following leases and reimburse the company:
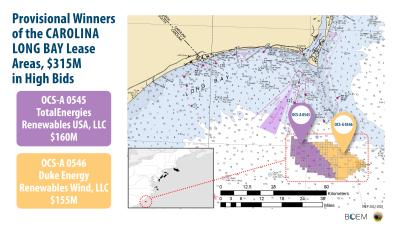
Lease No. OCS-A 0535 (now 0545). The lease is located in Carolina Long Bay area. This lease was fully executed by TotalEnergies Renewables USA, LLC on June 1, 2022, after payment of $133,333,333.
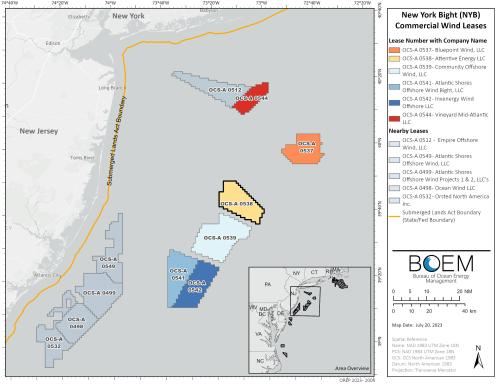
Lease No. OCS-A 0538. The lease is located in the New York Bight area. The lease was fully executed by Attentive Energy, LLC on May 1, 2022, after payment of $795,000,000.
Total pledges not to develop any new offshore wind projects in the United States.
Norway has always been ahead of the pack when it comes to worker accommodations. Gulfaks B (pictured) is a concrete, gravity-based platform installed nearly 40 years ago, but the living quarters and amenities are updated and first class. A Gulfaks B worker provides a tour in the video embedded below.
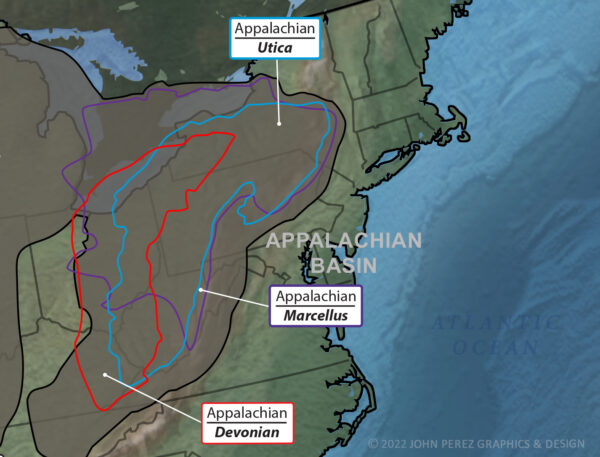
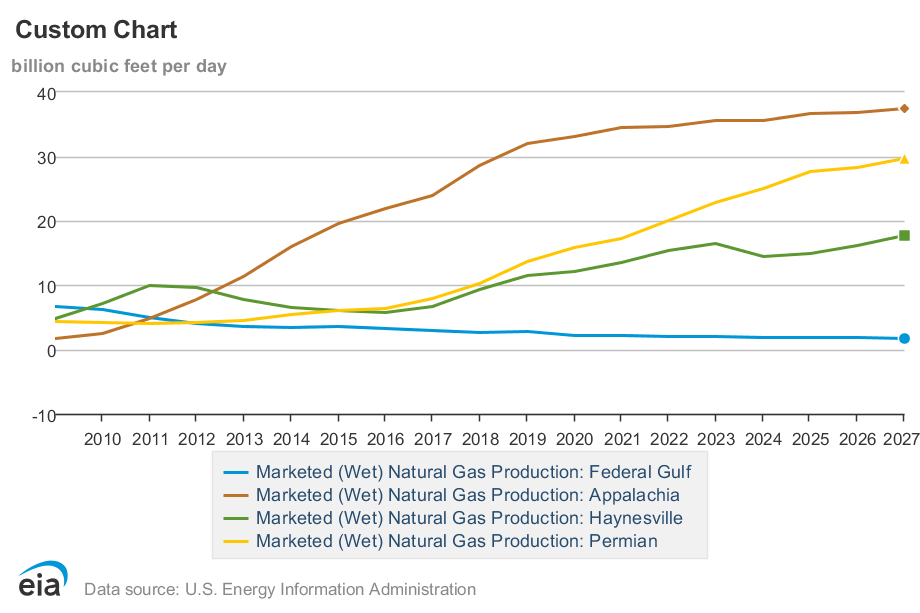
In 2025, more natural gas was produced in the Appalachia region of the Northeast than in any other US region, accounting for 31% of marketed natural gas production. (See the chart below.) Were it not for pipeline capacity limitations, recent growth in Appalachia production would have been greater.
Appalachia production is primarily from the Marcellus and Utica shales in PA, WV, and Ohio.
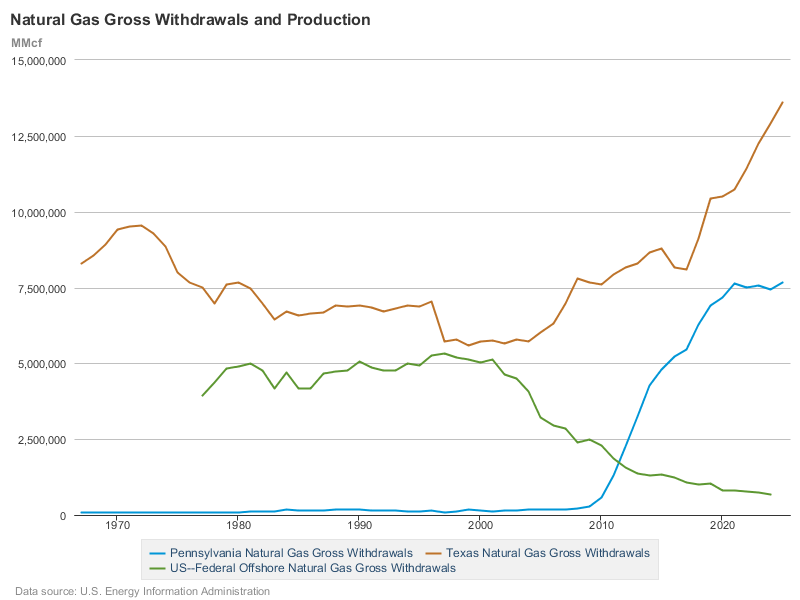
OCS gas production, 80% of which is now associated gas from deepwater oil wells, continues to lag the shale basins. This is a big change from 25 years ago when the OCS produced more gas than any state but Texas. (See the chart below.) Interest in ultradeep (subsurface) OCS shelf gas prospects remains scant despite favorable demand forecasts and technological advances.
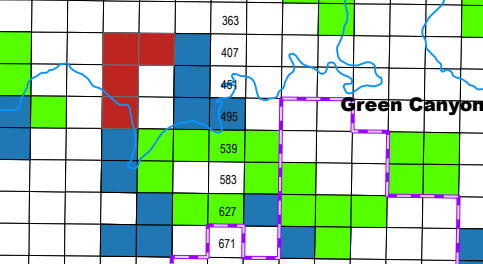
red=blocks receiving bids at BBG2; blue=BBG1 and Sale 261 leases; green=active leases issued prior to Sale 261
Although bidding at Sale BBG2 was rather subdued, Gulf heavyweights BP, Chevron, Shell, and Oxy/Anadarko, along with increasingly important Woodside Energy, competed for the 4 red blocks in the Green Canyon area (map above and table below). These elephant hunters presumably see excellent Paleogene (Wilcox) prospectivity in those blocks.
17 of the sale’s 38 bids (45%) and $32.8 milion of the sale’s $47 million in high bids (70%) were for these 4 blocks. BP’s $21 million bid for GC 404 was by far the sale’s highest bid.
Green Canyon Block No.
No. of bidders
High Bidder
Bid
404
5
BP
$21,009,990
405
2
BP
$885,99
448
5
Chevron
$4,967,067
492
5
Chevron
$5,887,188
At this time, the high costs and technical complexities (e.g. deepwaterand high pressure/high temperature reservoirs) limit Wilcox development to major oil companies and well financed, technically savvy independents. Expect some of the international majors that did not participate in BBG2 to acquire lease interest at a later date, which will again raise questions about the merits of joint bidding restrictions.
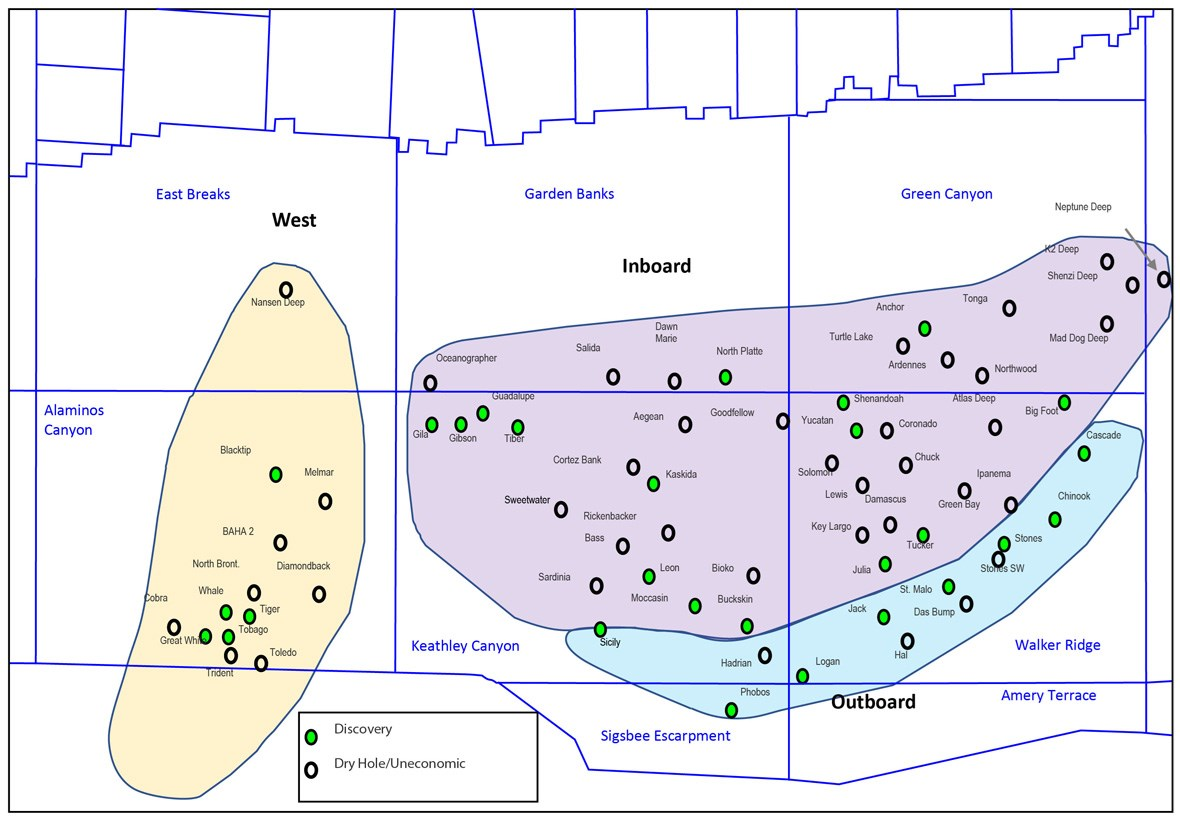
From AAPG graphic-Wilcox trend map. Eastern area can be subdivided into an outboard and inboard trend, with wells in the latter area showing variable thickness due to salt tectonics contemporaneous with deposition (From Zarra et al. 2019’s AAPG Search and Discovery article).
Imbedded below is a good presentation on the Paleogene Wilcox by Dr. Mike Sweet, Univ. of Texas:
Add the unprecedented events of the last two weeks to the long and troubled history of the Santa Ynez Unit dating back to the Offshore Storage & Treatment facility days.There are no parallels in the history of the US OCS program.
To date in March:
3/3/2026: The Dept. of Justice issues an opinion asserting that, under the Defense Production Act of 1950 (DPA), an order issued by the President or his delegee would preempt California laws currently impeding Sable from resuming production and operating the associated pipeline infrastructure.
3/13/2026: Secretary of Energy Chris Wright issues an order to Sable invoking the DPA to immediately prioritize and allocate pipeline transportation services for hydrocarbons from the SYU through the Santa Ynez Pipeline System (SYPS).
3/14/2026: Sable resumes the transportation of Santa Ynez Unit oil through the SYPS from Las Flores Canyon (LFC) to Pentland Station. Prior to resuming hydrocarbon transportation from LFC to Sable’s sales point at Pentland Station, Sable had approximately 540,000 barrels of processed crude oil in storage at LFC, representing more than the line fill volume for the SYPS between LFC and Pentland Station.
3/16/2026: Sable resumes oil production at anticipated rate of 50,000 bopd and expects first sales by April 1, 2026. Production ramp-up is anticipated to proceed with full production resumption at Platforms Harmony and Heritage this month and Platform Hondo in June 2026
(Bloomberg) — The Trump administration on Friday took action to clear the way for oil production off the California coast in a bid to ease the global fuel pressures created by the war with Iran.
The announcement by Energy Secretary Chris Wright follows an executive order signed by President Donald Trump on Friday and directs Sable Offshore Corp., a Houston-based company, to begin restoring operations for the Santa Ynez Unit and Santa Ynez Pipeline System in California.