Feeds:
Posts
Comments

Archive for the ‘Gulf of Mexico’ Category

5.62% of the oil and 9.68% of the gas remain shut-in.

BSEE data as of 12:30 p.m. ET on the specified date. Peak figures highlighted. The 9/17 report was BSEE’s final update.

date9/109/119/129/139/149/159/169/17
oil s.i.(BOPD)
% of total
412,070
23.55
674,833 
38.56
730,472
41.74
732,316
41.85
522,233
29.84
338,690
19.35
213,204
12.18
101,778
5.62
gas s.i.(MMCFD)
% of total
494
25.56
904
48.77
991.7
53.32
973.2
52.3
755
40.6
514.8
27.64
298
16.02
180
9.68
platform evacs
% of total
130
35
171
46
169
45.55
144
31.81
52
14
37
10
24
6.47
16
4.31
rig evacs
% of total
2
40
3
60
3
60
2
40
0
0
0
0
00
DP rigs moved
% of total
3
15
4
20
2
10
2
10
2
10
2
10
00

Read Full Post »

BSEE data as of 12:30 p.m. ET on the specified date. Peak figures highlighted.

date9/109/119/129/139/149/159/16
oil s.i.(BOPD)
% of total
412,070
23.55
674,833 
38.56
730,472
41.74
732,316
41.85
522,233
29.84
338,690
19.35
213,204
12.18
gas s.i.(MMCFD)
% of total
494
25.56
904
48.77
991.7
53.32
973.2
52.3
755
40.6
514.8
27.64
298
16.02
platform evacs
% of total
130
35
171
46
169
45.55
144
31.81
52
14
37
10
24
6.47
rig evacs
% of total
2
40
3
60
3
60
2
40
0
0
0
0
0
DP rigs moved
% of total
3
15
4
20
2
10
2
10
2
10
2
10
0

Read Full Post »

BSEE data as of 12:30 p.m. ET on the specified date.

date9/109/119/129/139/149/15
oil s.i.(BOPD)
% of total
412,070
23.55
674,833 
38.56
730,472
41.74
732,316
41.85
522,233
29.84
338,690
19.35
gas s.i.(MMCFD)
% of total
494
25.56
904
48.77
991.68
53.32
973.2
52.3
755
40.6
514.8
27.64
platform evacs
% of total
130
35
171
46
169
45.55
144
31.81
52
14
37
10
rig evacs
% of total
2
40
3
60
3
60
2
40
0
0
0
0
DP rigs moved
% of total
3
15
4
20
2
10
2
10
2
10
2
10

Read Full Post »

BSEE data as of 12:30 p.m. ET on the specified date.

date9/109/119/129/139/14
oil shut-in (BOPD)
% of total
412,070
23.55
674,833 
38.56
730,472
41.74
732,316
41.85
522,233
29.84
gas s.i. (MMCFD)
% of total
494
25.56
904
48.77
991.68
53.32
973.2
52.3
755
40.6
platforms evacuated
% of total
130
35
171
46
169
45.55
144
31.81
52
14%
rigs evacuated
% of total
2
40
3
60
3
60
2
40
0
0
DP rigs moved
% of total
3
15
4
20
2
10
2
10
2
10

Read Full Post »

BSEE data as of 12:30 p.m. ET on the specified date.

date9/109/119/129/13
oil shut-in (BOPD)
% of total
412,070
23.55
674,833 
38.56
730,472
41.74
732,316
41.85
gas s.i. (MMCFD)
% of total
494
25.56
904
48.77
991.68
53.32
973.2
52.3
platforms evac.
% of total
130
35
171
46
169
45.55
144
31.81
rigs evacuated
% of total
2
40
3
60
3
60
2
40
DP rigs moved
% of total
3
15
4
20
2
10
2
10

Read Full Post »

BSEE data for the past 3 days are tabulated below. Data are as of 12:30 p.m. ET on the specified date. Barring offshore or downstream infrastructure damage, production should begin to resume over the next few days.

Prior to the shale boom, when our national production was lower and the OCS accounted for a larger share, these numbers would have had a more significant effect on oil and gas prices. That is not the case today with only a 2.4% rise in WTI prices.

date9/109/119/12
oil shut-in (BOPD)
% of total
412,070
23.55
674,833 
38.56
730,472
41.74
gas s.i. (MMCFD)
% of total
494
25.56
904
48.77
991.68
53.32
platforms evac.
% of total
130
35
171
46
169
45.55
rigs evacuated
% of total
2
40
3
60
3
60
DP rigs moved
% of total
3
15
4
20
2
10

Read Full Post »

As of 12:30 pm ET on 9/11/2024, nearly 40% of the oil and half of the gas production was shut-in.

Total Shut-in (Percentage of GOM Production)
Oil, BOPD Shut-in674,833 BOPD38.56 %
Gas, MMCFD Shut-in907 MMCFD48.77 %

Evacuations and rig movementstotal% of GOM
Platforms Evacuated17146%
Rigs Evacuated (non DP)360%
DP Rigs Moved-off420%

Read Full Post »

Per BSEE

Total Shut-in (Percentage of GOM Production)
Oil, BOPD Shut-in412,070 BOPD23.55%
Gas, MMCFD Shut-in494 MMCFD25.56%

Evacuations and rig movementstotal% of GOM
Platforms Evacuated13035%
Rigs Evacuated (non DP)240%
DP Rigs Moved-off315%
DP= dynamically positioned

Read Full Post »

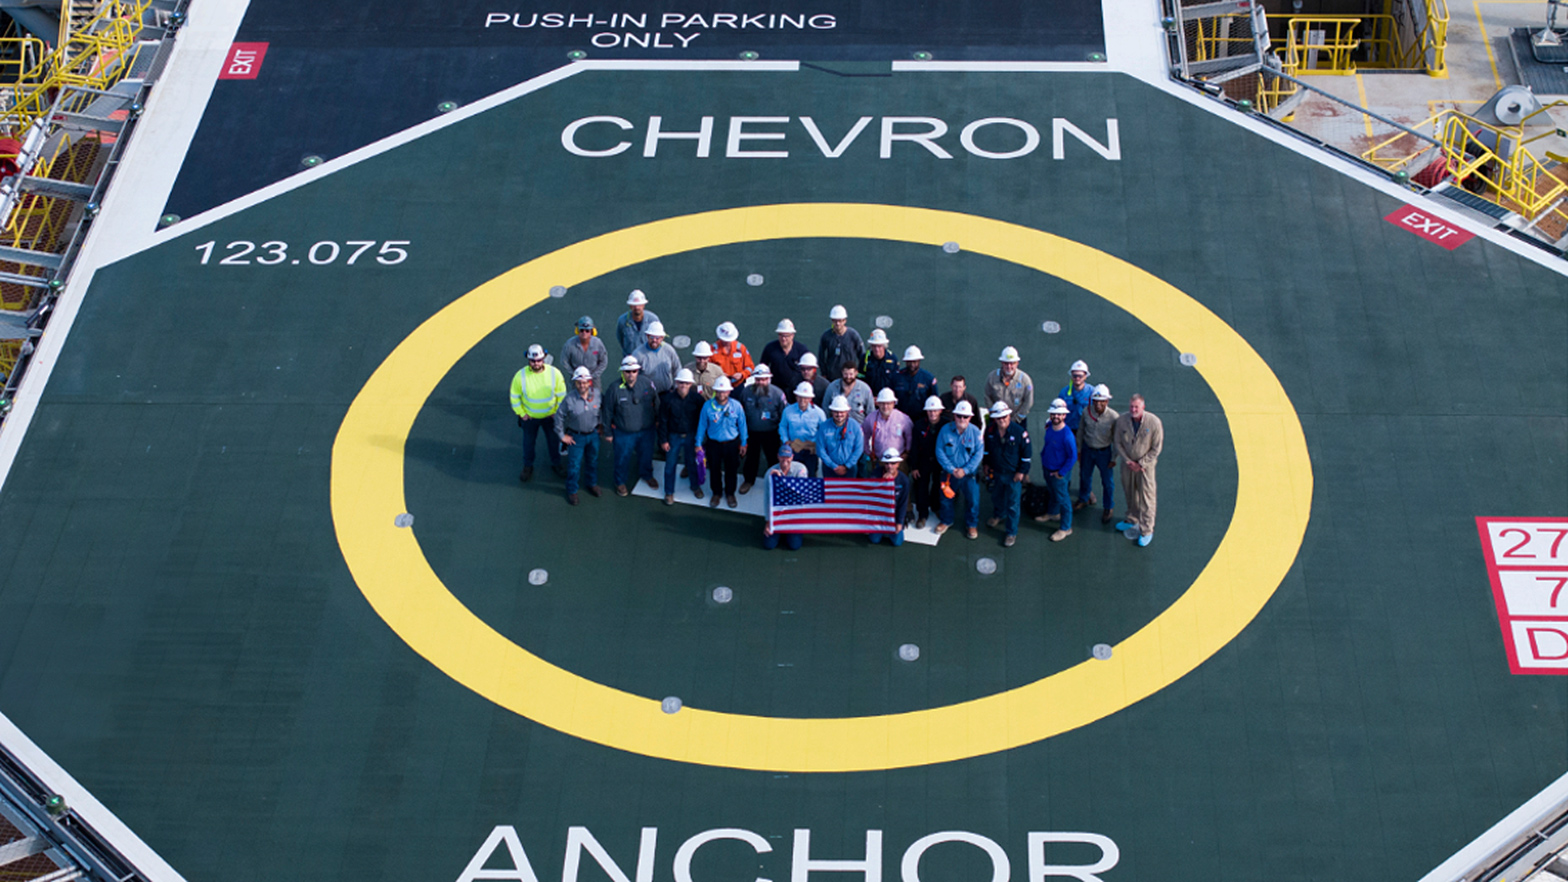
Chevron slide: Advances in seismic imaging help characterize deepwater development opportunities

A new JPT article features comments from BOE contributor Lars Herbst on advances in HPHT technology, control systems, sensors and transmitters, and automation that are facilitating the next era of deepwater development.

Well capping technology, which provides a tertiary well control capability, is an essential element of post-Macondo exploration and development. Lars points to the importance of BSEE’s unannounced drill program to verify that capping stacks can be transported and installed in a timely manner. Chevron expresses pride in leading a team that deployed and installed a capping stack in 6,200 feet of water in a drill monitored by BSEE. During that drill, a remotely operated vehicle (ROV) closed 10 valves to shut in a simulated well.

Exxon’s Jayme Meier aptly characterizes the challenge and excitement of deepwater development:

“You are floating on a surface, and you have to be able to pinpoint exactly where you’re going to land subsea hardware, exactly where you’re going to moor an FPSO and hit target boxes that are a few feet by a few feet, and they’re 6,000 ft below you,” she said. “It is the most exciting thing that I’ve ever been involved in. And it involves technology, technical know-how, and an ability to really plan the base plan and the contingency plan.”

Advances in deepwater technology are indeed impressive, but continuous improvement must always be the objective. In that regard, Lars rightfully emphasizes the importance of sustaining research through the industry’s up and down cycles.

Read Full Post »

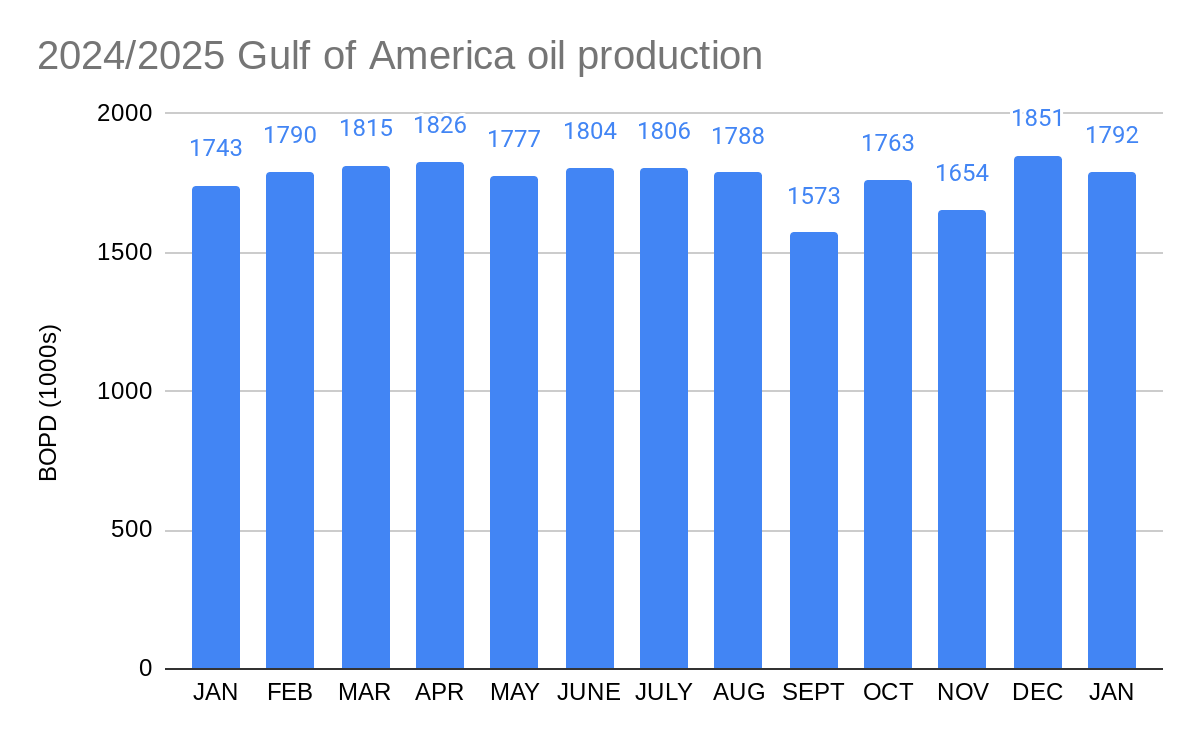
EIA has posted the June 2024 US production data. Gulf of Mexico production was remarkably flat from February through June, with a maximum deviation of only 2.0% (FEB vs. APR) and a deviation of only 0.5% from the beginning of this 5 month period to the end. Looking at the historical EIA data, this is about as stable of a 5 month period as I could find. Presumably, production from the new deepwater facilities is offsetting declines elsewhere as anticipated.

Unfortunately, the production growth forecasted by BOEM is not being realized. BOEM’s 2024 production forecast of 2.013 million bopd will likely be more than 200,000 bopd too high. Their forecast of >2 million bopd through 2027 is increasingly doubtful.  These production forecasts contributed to (or were an excuse for) unprecedented leasing policies intended to prevent production from rising too high for too long.

Per ONRR data, the Gulf of Mexico continued to be the top oil producer for Federal lands in 2023. An additional 72.7 million bbls were produced on Native American lands. New Mexico, which has experienced significant Permian basin production growth, ranked second. The Texas Permian was the dominant US oil producer, but that production is almost exclusively on private lands (a big factor in the Permian success story).

Location (Federal lands)2023 production (bbls)
Gulf of Mexico680,548,975
New Mexico409,987,014
Wyoming47,232,043
North Dakota43,225,104
Other33,635,796

Read Full Post »

« Newer Posts - Older Posts »