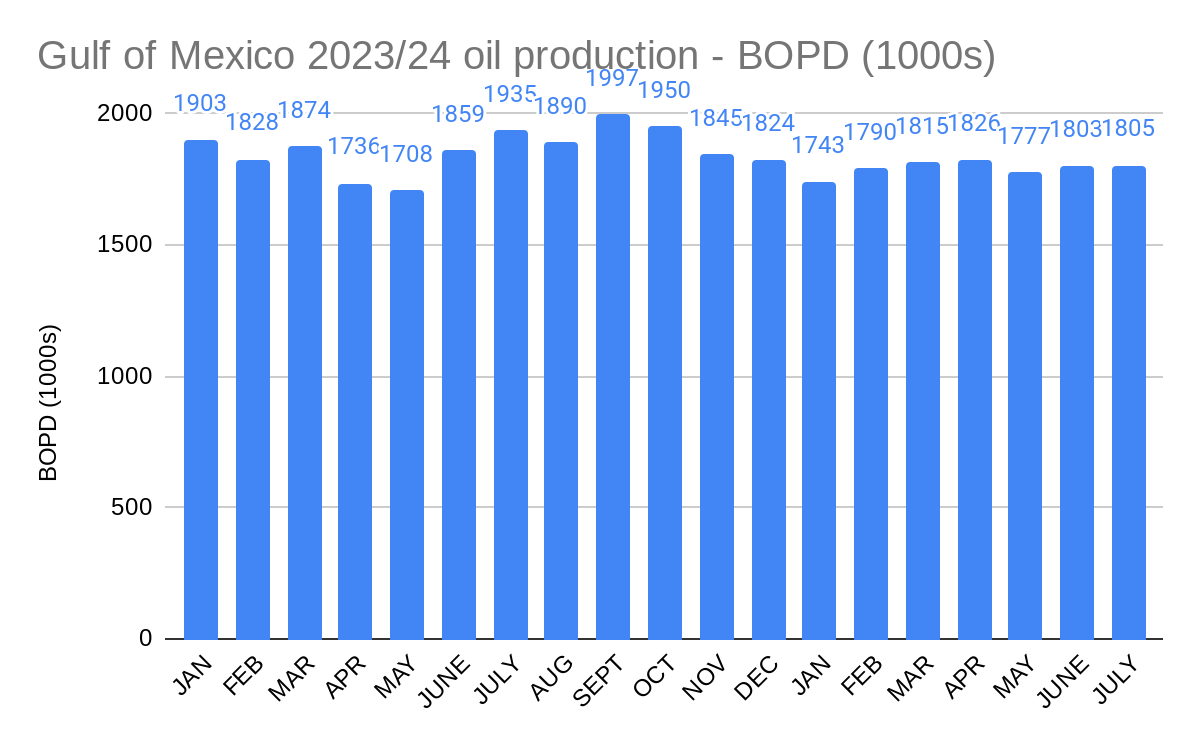
The stability in Gulf of Mexico oil production rates, as noted when the data for June were released, continued into July. Oil production once again remained remarkably consistent at 1.8 million bopd.
Average daily production was within 1.4% of 1.8 million bopd for each month from February to July. As previously observed, this is as stable as production has been for any 6 month period in the past 10 years.I’m not sure this observation is terribly significant, but it’s interesting nonetheless. 😀
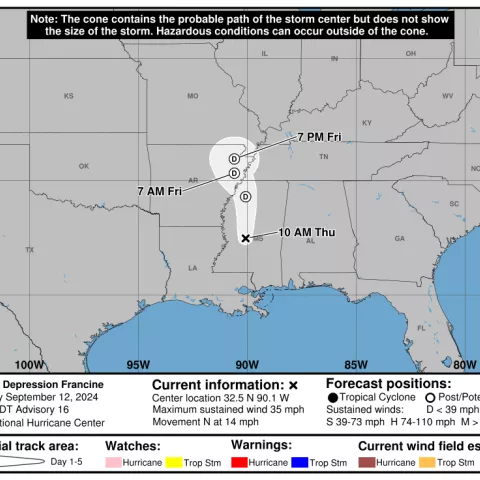
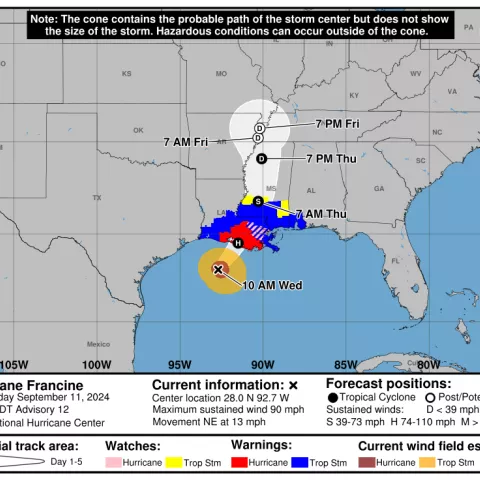
If the streak didn’t end in August, it most certainly did in September given the shut-ins for Hurricanes Francine and Helene.
Update: BSEE reports that as of 9/29/2024, essentially all production had been restored.
As of 9/28, 210,000 BOPD remained shut-in with only 4 platforms still evacuated. Presumably, production had not resumed (or had only partially resumed) on some high rate deepwater platforms.
BSEE shut-in, evacuation, and relocation data in the table below are as of 12:30 p.m. ET on the specified date.
The previously discussed sale of Cox assets in 6 GoM fields to W&T was completed in January for $72 million, $16.5 million less than the proposed price. W&T, an established GoM operator, believes they can increase the pre-bankruptcy production (8300 boepd) through workovers, recompletions, and facility repairs.
The extent to which W&T is assuming decommissioning liability for the Cox assets is unclear to this observer. Decommissioning information from W&T’s SEC filing is pasted at the end of this post.
In February, Cox won court approval to sell “about a dozen oil fields to Natural Resources Worldwide LLC for about $20 million following a bankruptcy court auction.” This sale is more concerning given that the purchaser has no operating history in the GoM, and scant information about the company can be found online. Perhaps they are affiliated with Natural Resources Partners L.P., an energy investment firm which “owns mineral interests and other rights that are leased to companies engaged in the extraction of minerals,” but “does not mine, drill, or produce minerals, has no operations, and conducts business solely in an office environment.”
Per BOEM data, Cox filed requests to assign a number of leases to Natural Resources Worldwide (NRW) in May, but those requests have yet to be approved. Hopefully, BOEM is taking a hard look at these requests and their obligations following the court auction. Decommissioning liabilities should be their number one concern. (Note: NRW was just listed as the operator of the former Cox platform at EI 361, so presumably at least some of those assignments have now been approved.)
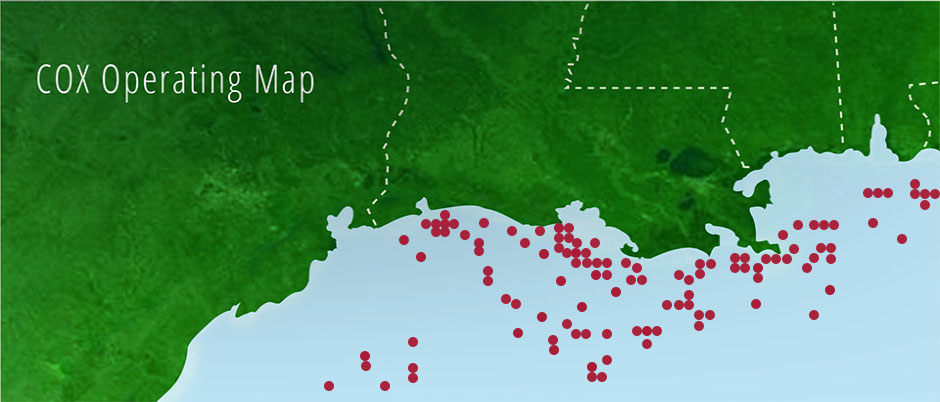
According to BOEM’s platform data base, Cox and affiliates Energy XXI and EPL still operate 243 platforms, down from 435 in June 2023. Also per the data base, the Cox companies have not removed any platforms during 2023 or 2024 YTD, so the reduction in platforms is presumably the result of the W&T transaction. Most of the remaining Cox platforms are old – 16 of their 77 major platforms were installed in the 1950s!
Meanwhile, Cox and affiliates continue to be the GoM violations leader by far with 549 incidents of non-compliance (INCs) in 2024 YTD, 45% of the GoM total for all operators. No other company has more than 100 INCs (although Whitney Oil and Gas has a disappointing 93 INCs, including 33 facility shut-ins on only 65 inspections!)
operator
platforms/ major platforms
warning INCs
component shut-in INCs
facility shut-in INCs
Cox
209/69
407
44
4
Energy XXI
19/7
73
1
2
EPL
5/1
16
1
1
Total Cox
233/77
496
46
7
Total GoM
1519/736
831
317
68
INCs are for 2024 as of 9/17/2024. A major platform has at least 6 well completions or more than 2 pieces of production equipment.
The Company may be subject to retained liabilities with respect to certain divested property interests by operation of law. Certain counterparties in past divestiture transactions or third parties in existing leases that have filed for bankruptcy protection or undergone associated reorganizations may not be able to perform required abandonment obligations. Due to operation of law, the Company may be required to assume decommissioning obligations for those interests. The Company may be held jointly and severally liable for the decommissioning of various facilities and related wells. The Company no longer owns these assets, nor are they related to current operations.
During the three months ended March 31, 2024, the Company incurred $2.6 million in costs related to these decommissioning obligations and reassessed the existing decommissioning obligations, recording an additional $5.3 million. As of March 31, 2024, the remaining loss contingency recorded related to the anticipated decommissioning obligations was $20.8 million.
Although it is reasonably possible that the Company could receive state or federal decommissioning orders in the future or be notified of defaulting third parties in existing leases, the Company cannot predict with certainty, if, how or when such orders or notices will be resolved or estimate a possible loss or range of loss that may result from such orders. However, the Company could incur judgments, enter into settlements or revise the Company’s opinion regarding the outcome of certain notices or matters, and such developments could have a material adverse effect on the Company’s results of operations in the period in which the amounts are accrued and the Company’s cash flows in the period in which the amounts are paid. To the extent that the Company does incur costs associated with these properties in future periods, the Company intends to seek contribution from other parties that owned an interest in the facilities.
BSEE data for the past 3 days are tabulated below. Data are as of 12:30 p.m. ET on the specified date. Barring offshore or downstream infrastructure damage, production should begin to resume over the next few days.
Prior to the shale boom, when our national production was lower and the OCS accounted for a larger share, these numbers would have had a more significant effect on oil and gas prices. That is not the case today with only a 2.4% rise in WTI prices.