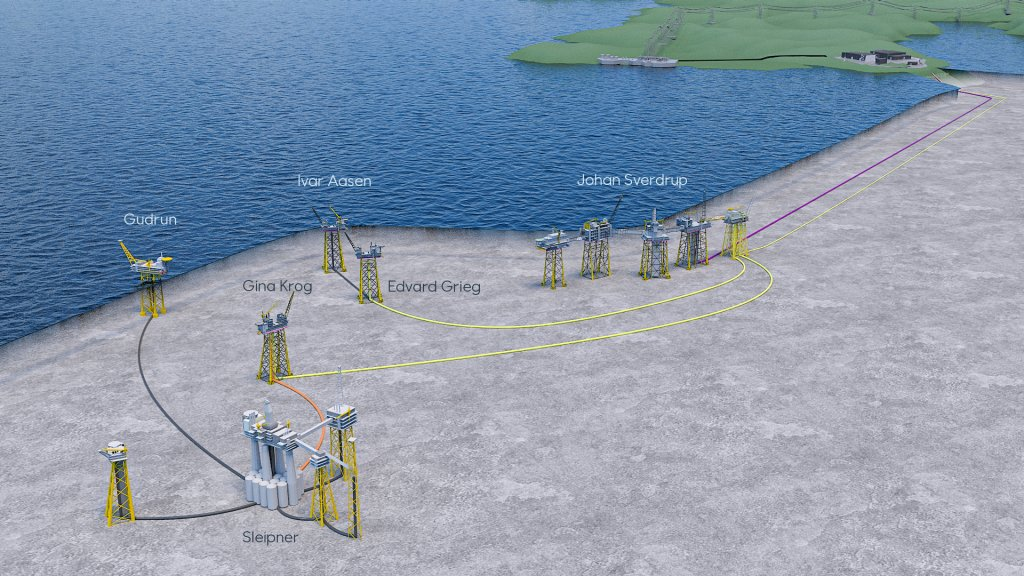
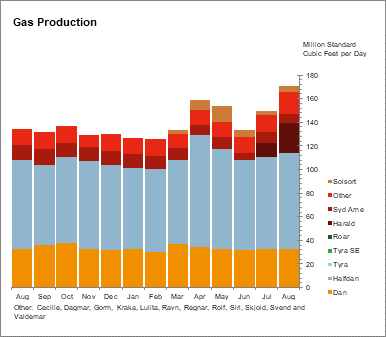
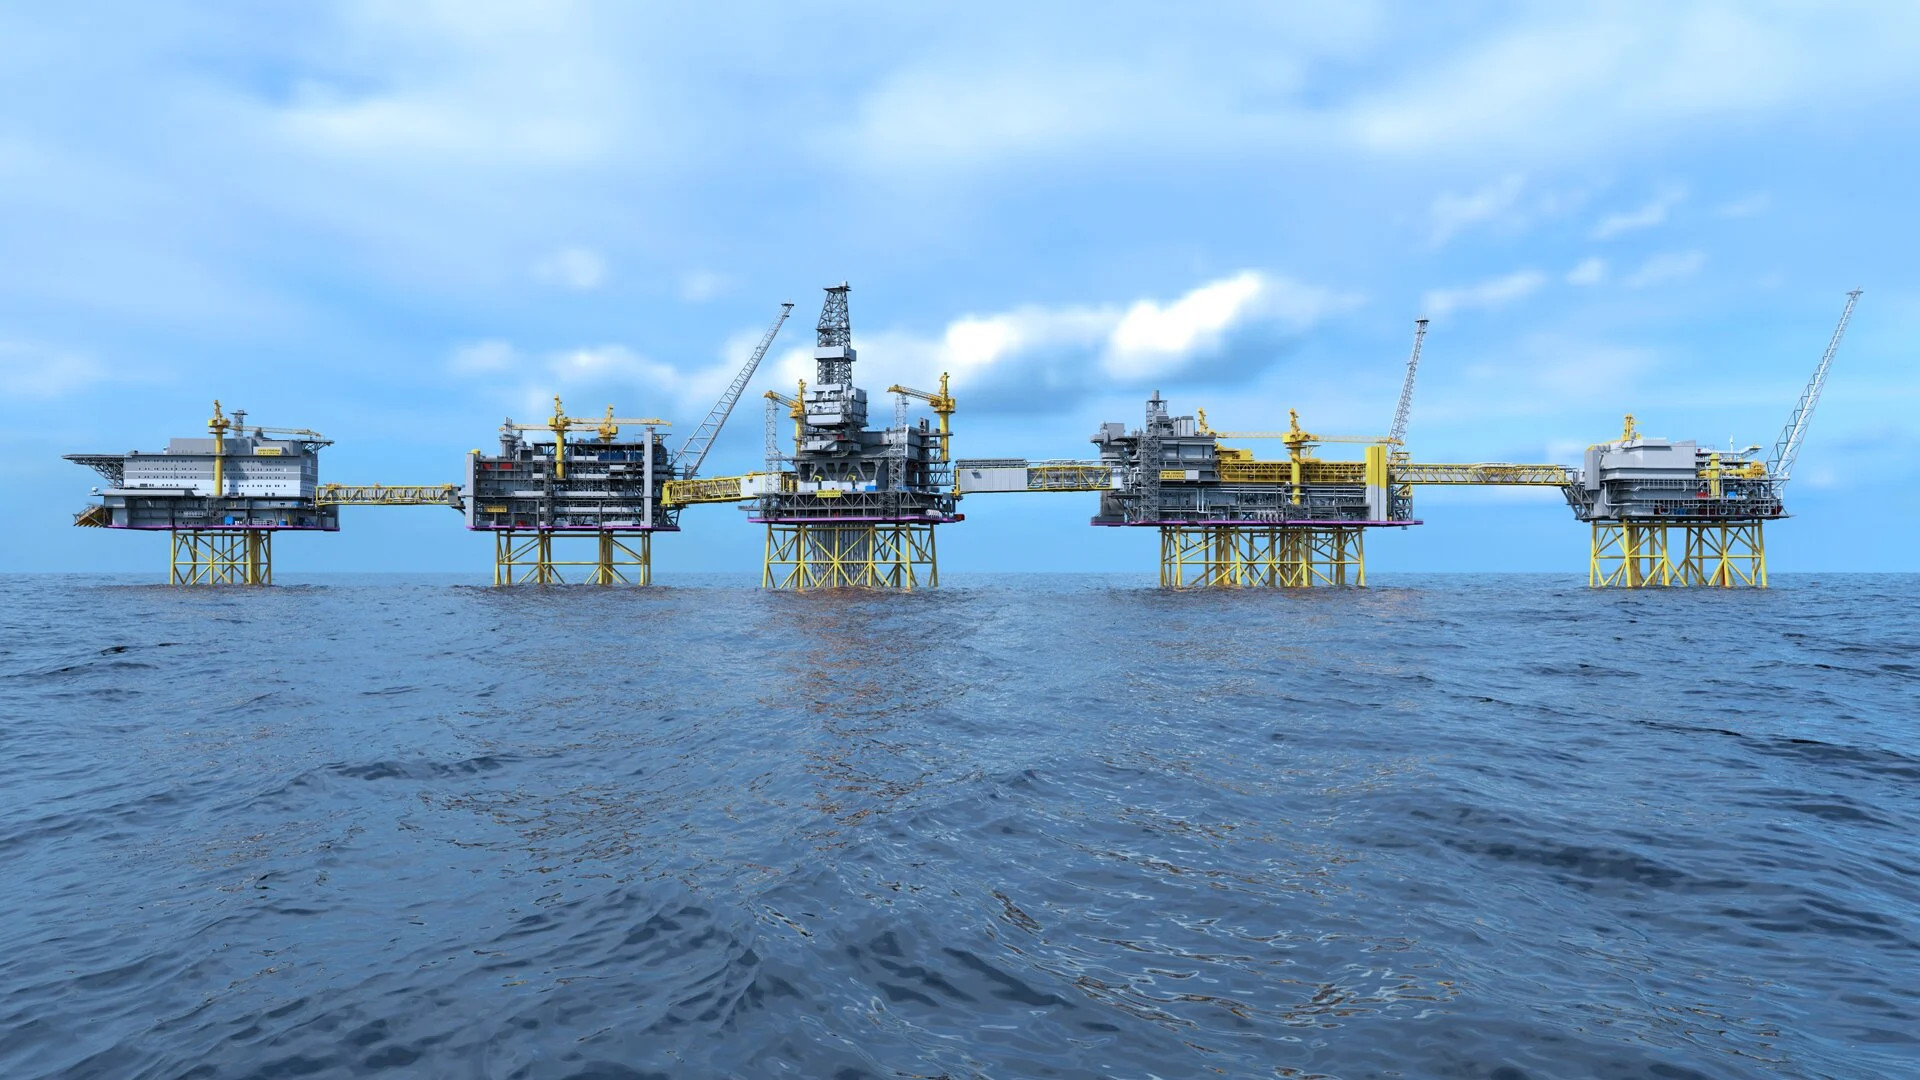
199 oil and gas leases were wrongfully acquired at Sales 257, 259, and 261 with the intent of developing these leases for carbon disposal purposes. Repsol was the sole bidder at Sale 261 for 36 nearshore Texas tracts in the Mustang Island and Matagorda Island areas (red blocks at the western end of the map above). Exxon acquired 163 nearshore Texas tracts (blue in map above) at Sales 257 (94) and 259 (69).
Despite false starts by Exxon and Repsol (see above summary), no carbon sequestration (disposal) leases may be issued or developed until implementing regulations have been promulgated. In that regard, no news is good news for those who are less than enamored with CO2 disposal in the Gulf of Mexico.
The implementing regulations will be controversial. Most operating companies prioritize GoM production over GoM disposal. Most environmental organizations are strongly opposed to CO2 disposal schemes that sustain fossil fuel production and benefit fossil fuel producers. Taxpayers are leery of subsidizing these projects and absorbing increased costs for energy and consumer goods.
The Administration is, of course, well aware of this opposition and will not be publishing implementing regulations prior to the election. The next Administration, regardless of the election outcome, will no doubt take a hard look at these issues before proposing regulations.
The few oil and gas producers that are rather cynically hoping to cash in on CO2 disposal in the GoM will therefore have to wait, perhaps for a long time.
While the Orsted acquisition does not appear to have been directed by the Norwegian government, the State’s 2/3 ownership of the company no doubt influences renewable energy targets and broader corporate strategy.
The initial market reaction to the Orsted purchase was negative (see chart below). On a day when most oil companies’ share prices rose in response to the jump in oil prices, Equinor shares opened sharply lower.
Given the absence of industry and government data on wind turbine incidents, Scotland Against Spin (SAS) has done yeoman’s work in filling the void. SAS gathers information from press reports and official releases. A PDF of the latest SAS update summary is attached. You can view their complete incident compilation (318 pages) here. Kudos to SAS for their diligence.
As good as their work has been, SAS acknowledges that their information is far from complete and may only represent the tip of the wind turbine incident iceberg. Per SAS:
In 2011, RenewableUK confirmed that there had been 1500 wind turbine incidents in the UK alone in the previous 5 years.
In July 2019, EnergyVoice reported a total of 81 cases where workers had been injured on UK windfarms since 2014. The SAS table includes only 15 of these incidents (<19%).
In February 2021, the industry publication Wind Power Engineering and Development admitted to 865 offshore accidents during 2019. SAS captured only 4 (<0.5%).
A 13 August 2018 publication by Power Technology reported 737 incidents from UK offshore windfarms during 2016 alone, with the majority occurring during operations rather than development. 44% of medical emergencies were turbine related. In comparison, only 4 UK offshore incidents are listed in the SAS data – equivalent to 0.5%.
Lars Herbst had previously reported, based on the Wind Power article cited above, that “with an estimated 700,000 blades in operation globally, there are, on average, 3,800incidents of blade failure each year.” Lars noted that the annual blade failure rate of about 0.5% translates to 1.5% of all operating wind turbines experiencing a blade failure every year, a remarkably high failure frequency.
“This marks a turning point in the clean energy transition. After many decades of advocacy, research, policymaking, and finally construction, America’s offshore wind industry has gone from a dream to reality,” said Governor Maura Healey. “Across Massachusetts, in 30,000 homes and businesses, when you turn on the light, you will now be using clean, affordable energy. This will make the air we breathe safer and healthier, save customers money, and bring us one step closer to achieving net-zero emissions.”
Some of us are long-time observers of North Sea operations. Others like JL Daeschler are pioneers who were involved with North Sea exploration and development from the outset. It’s sad to see what is happening to the UK offshore industry.
And for what purpose? Virtue signaling by politicians? Pandering to the international climate cartel? Shutting down North Sea production will have no measurable effect on our climate.
Now that the entire U.S. Atlantic and Pacific, and nearly all of offshore Alaska, are closed to oil and gas leasing, the goal of some is to shut down the Gulf of Mexico. That intent is clear in the 5 year leasing plan that provides for a maximum of 3 sales, the fewest of any 5 year plan in the history of the US offshore program. This is really a 5 year moratorium, not a 5 year leasing plan.
As noted in the post below, GoM production is 1.8 million bopd. BOEM’s reasonable forecast of >2 million bopd through 2027 will not be achieved because of policy decisions, not resource limitations or technical capabilities.
And shame on those who are attributing Hurricane Helene’s destruction to GHG emissions. This is uninformed opportunism at its worst.
This video shows the real cost of Ed Miliband’s plans to shut down the North Sea.
200,000 workers left stranded, billions in tax revenue lost, and clean energy investment deterred.
Note: I have attached a PDF for those who want to download the charts and table.I have also added a “flaring and venting” category for easy access to these posts.
Minimizing flaring and venting is important from both environmental and resource conservation standpoints.Flaring and venting volumes are also good indicators of how well production systems are designed, managed, and maintained.
The best performance indicators are the percentages of produced gas that are flared and vented both for oil-well gas (OWG, also known as associated gas or casinghead gas) and gas-well gas (GWG or non-associated gas).
I compile monthly flaring and venting volumes for the Gulf of Mexico using data submitted to the Office of Natural Resources Revenue (ONRR). Reporting these data is mandatory and strictly enforced. Violators are subject to civil and criminal penalties.
In assessing performance trends, it’s important to segment venting and flaring volumes for both OWG and GWG production. Venting produced gas (mostly methane) is a more significant environmental concern from both air quality and greenhouse gas (GHG) perspectives. Reductions in methane emissions are a priority for regulators and leading operators.
Flaring and venting data for 2019-2023 are summarized in the charts and table below. All volumes are in millions of cubic feet (MMCF). For the last chart (% of total gas production vented), I added ONRR data for 2015-2018 to provide a longer term perspective on overall venting performance.
Observations:
OWG venting has declined significantly both in terms of the total volume and % flared. Most OWG is now produced at modern deepwater platforms equipped with efficient flare stacks. Venting from these facilities is minimal. A performance target of <0.2% for OWG venting should therefore be achievable.
GWG venting volumes have declined sharply. However, given the parallel decline in GWG production, the % of GWG vented has actually increased. Most gas wells are on older shelf platforms where flare booms cannot be safely and economically added. Nonetheless, it’s disappointing that the % of GWG vented increased to > 0.3% in both 2022 and 2023.
OWG flaring has remained relatively constant both in terms of the volume and % flared. Given that most OWG is produced at deepwater facilities, reduction of the flaring % to <1.0 should be achievable.
The % of the total gas flared or vented has remained relatively constant at >1.0%. Again, a target of <1.0% should be achievable.
In the table, the figures in blue are particularly encouraging and the figures in red are the most disappointing.
Overall, the numbers are good, but continuous improvement should be the objective. Reductions in GWG venting and OWG flaring should be prioritized.
As previously discussed, flaring/venting performance could be better assessed if information on large flaring/venting episodes was made publicly available. Explanations are needed for spikes in monthly ONRR flaring/venting volumes. Are these spikes associated with production startups, tropical storm restarts, major compressor issues, administrative/accounting corrections, or something else?
2019
2020
2021
2022
2023
OWG flared
7727
7385
5919
6987
6342
OWG vented
2578
1984
1405
1638
1230
OWG produced
670,699
582,254
582,824
581,235
598,005
% OWG flared
1.15
1.27
1.02
1.20
1.06
% OWG vented
0.38
0.34
0.24
0.28
0.21
GWG flared
405
432
311
213
212
GWG vented
958
578
548
722
468
GWG produced
364,082
224,808
209,558
203,342
152,400
%GWG flared
0.11
0.19
0.15
0.10
0.14
%GWG vented
0.26
0.26
0.26
0.36
0.31
total flared and vented
11668
10233
8183
9559
8252
total gas production
1,034,782
807,062
792,382
784,577
750,405
% flared or vented
1.13
1.27
1.03
1.22
1.10
total vented
3536
2416
1953
2360
1698
% vented
0.34
0.30
0.25
0.30
0.22
total flared
8132
7817
6230
7200
6554
% flared
0.79
0.97
0.79
0.92
0.87
OWG=oil well gas; GWG=gas well gas; all volumes are in MMCF
2024 will be the first year since 1958 without a single OCS oil and gas lease sale. There would not have been a sale in 2023 either were it not for a legislative mandate. The only 2022 lease sale was a micro-sale in the Cook Inlet that resulted in only a single bid. So, at the end of 2024 three years will have elapsed with only one meaningful sale, and that sale was mandated by Congress.
The current plan is for these de facto sanctions on US offshore production to continue. The Dept. of the Interior’s 5 year leasing plan includes a maximum of 3 sales, by far the fewest sales in any 5 year plan in OCS program history.
Meanwhile, the sanctions on Venezuelan production were further eased with the understanding that the Maduro regime would hold fair elections. To the surprise of no one, the evidence strongly suggests that those elections were not fair. Nonetheless, the sanctions on production have not been reimposed.
Apparently, the climate activists who have imposed their will on the OCS oil and gas program have less influence over our policy toward Venezuela. Or perhaps the production (and consumption) of Venezuelan oil is cleaner and greener (🙃 sarcasm intended!)
JL Daeschler reports that there has been no wind for the past 4 days at his home in Scotland, and his wind gauge is droopy. (See his sketch below and read the fine print 😉)
Rendering of Ocean City MD morning view per US Wind project plansubmitted to BOEMOcean City NJ offshore wind protest
To those of us from Philly, Ocean City is in New Jersey. To those living in the DMV, Ocean City is in Maryland. These popular beach resorts have distinct personalities, but both are heavily dependent on tourism. They are also aligned against offshore wind development.
On Aug. 5, Ocean City MD Mayor Rick Meehan said the town has hired a law firm, and will join several local co-plaintiffs in suing BOEM if it issues a federal permit to US Wind to construct the US Wind project offshore Maryland. Exactly one month later (9/5/2024), BOEM approved the project. (The 2 US Wind leases have been consolidated, and the project is now known as the Maryland Offshore Wind project).
Halting Atlantic wind projects has been a difficult proposition for local governments, tribes, and grass roots environmental groups given that the wind industry, State and Federal govt, and the large environmental NGOs have been firmly aligned against them. Indeed, the Federal govt considers wind developers to be their partners.
Disputes between State and local governments regarding offshore wind policy are becoming increasingly strident. Such disconnects are not common for offshore oil and gas given that State and local govts are typically aligned either for or against.
The growing level of discord is neither in the best interest of wind developers nor their opponents. Unfortunately, election year politics probably stand in the way of a pause in wind leasing that would facilitate open and unpressured collaboration with coastal residents, power customers, tribes, and fishing organizations on the best path forward.