Feeds:
Posts
Comments

Posts Tagged ‘Gulf of America’

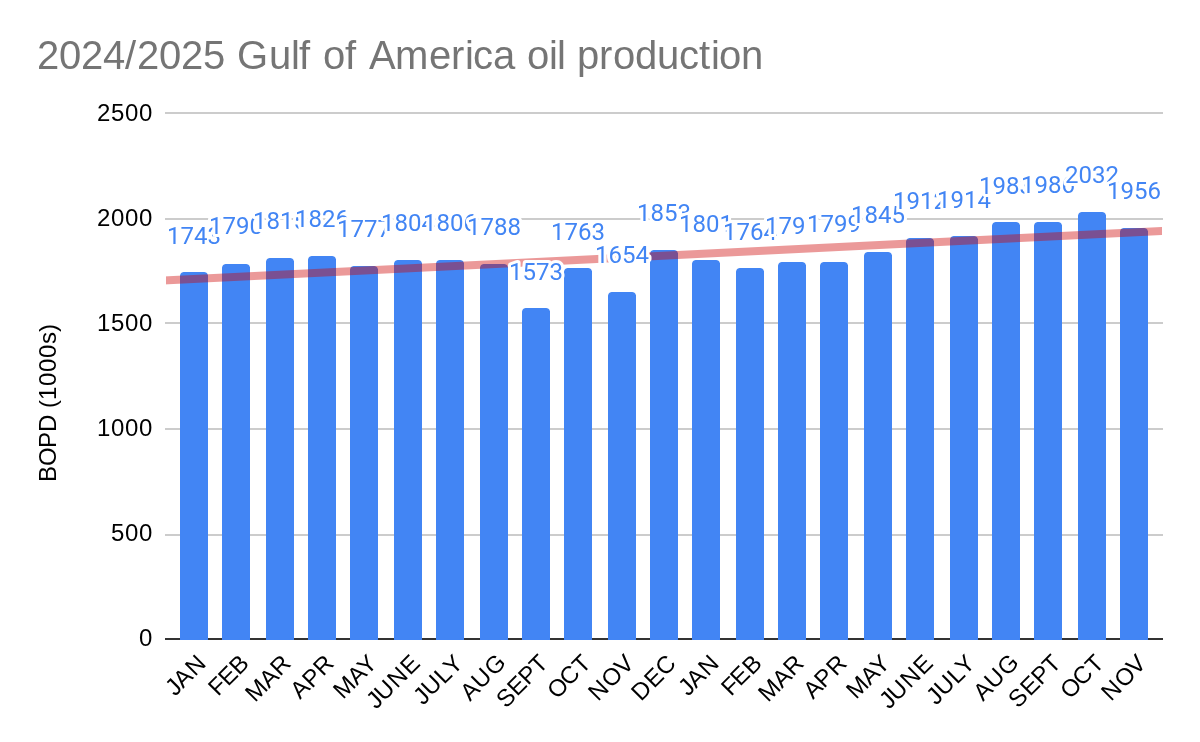
The EIA has revised Gulf of America oil production slightly downward for Nov. and Dec. such that we now have an absolute dead heat between 2025 and 2019. Production for both years averaged exactly 1.898 million bbls/day.

Because of the ~6 month lag in obtaining verified OCS production data from the Office of Natural Resources Revenue (ONRR), the monthly EIA reports are based on ONRR’s more timely sales of production data. The final sales and production numbers are typically very close. For the 2019 record OCS production year, both the EIA and ONRR report identical Gulf production of 1.898 million bopd.

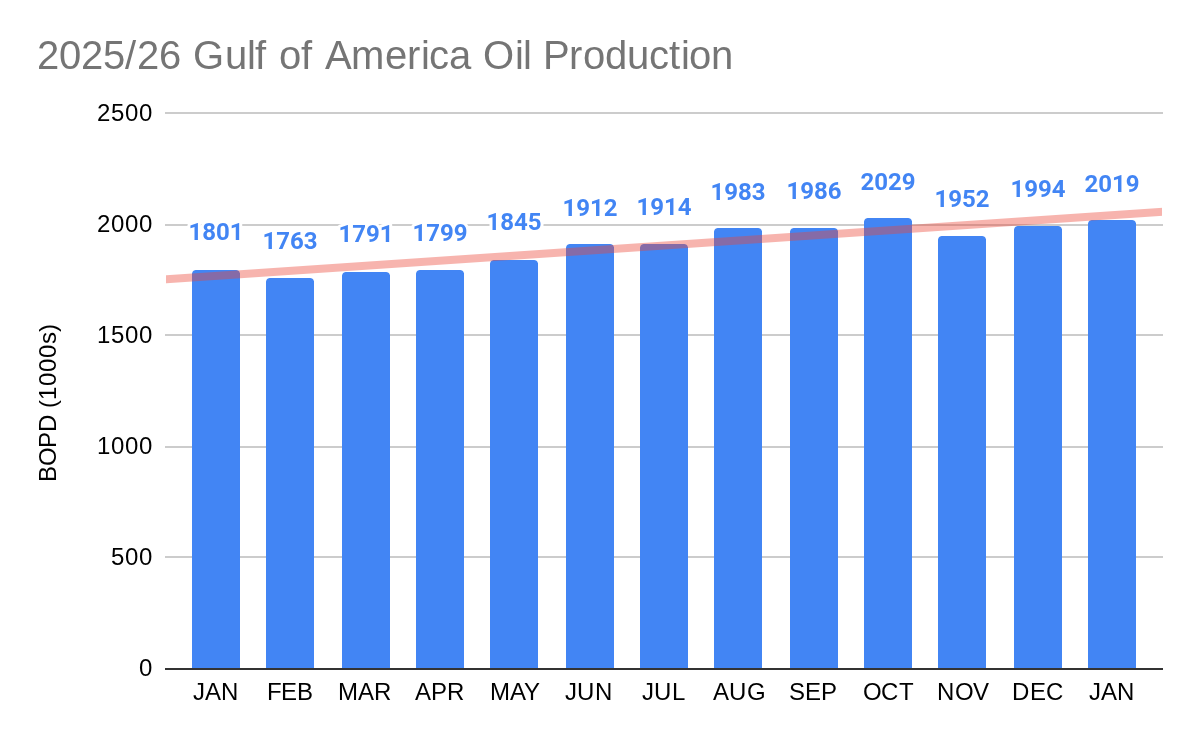
Meanwhile, 2026 Gulf production (chart below) is off to a strong start – 2.019 million bopd in January. This is the third highest monthly oil production in the history of Gulf operations.

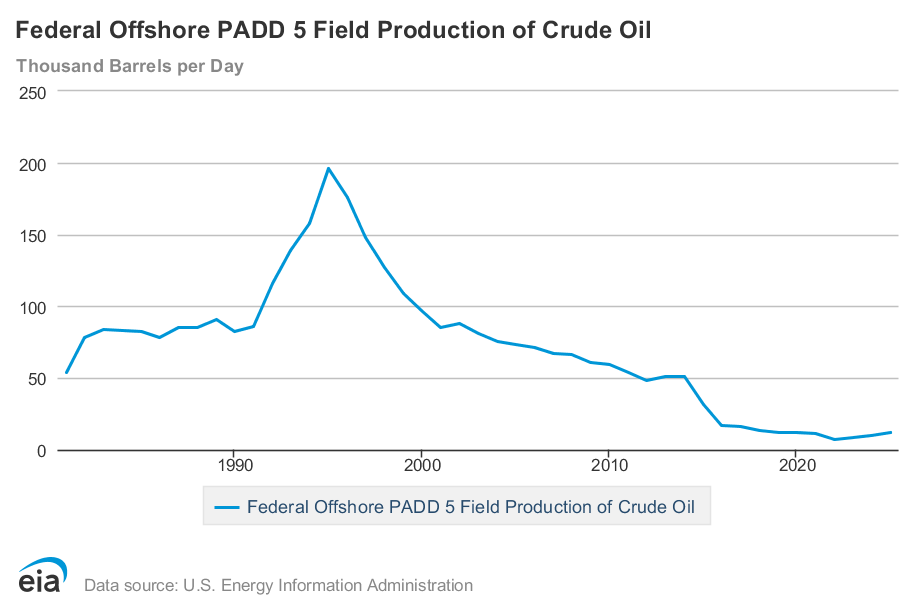
Finally, California OCS oil production, which has been hobbling along at ~10,000 bopd (2nd chart) will see a massive increase of up to 500% should Santa Ynez Unit production continue.

Read Full Post »

Companies seeking to acquire OCS leases are not only competing with each other, they are also competing with BOEM’s tract evaluations. In that regard, the bidders fared well at Sale BBG1. Only 3 of the 181 high bids were rejected by BOEM. and those rejections appear to be warranted.

The rejected bids were significantly below both BOEM’s Mean of the Range-of-Value and Lower Bound Confidence Interval for these single bid tracts (table below).

Block No.Companyno. of bidsbidMROVLBCI
EW 921LLOG1$505,777$2,900,000$2,200,000
MC 587KUSA1$700,000 $3,300,000$2,200,000
MC 588LLOG1$613,008$6,100,000$4,600,000
MROV=Mean of the Range-of-Value; LBCI=Lower Bound Confidence Interval; KUSA=Karoon (Australia) Energy USA; EW=Ewing Bank; MC=Mississippi Canyon

LLOG submitted 9 other high bids (alone or with partners) that were accepted. KUSA did not submit any other bids. We’ll see if the rejected bids for these blocks are exceeded in future sales.

Nine other high bids (table below) were less than the MROV, but all were greater than the LBCI. Those bidders “beat the house,” acquiring leases for <MROV. In that regard, Equinor led the pack with no rejections even though 3 of their 7 bids were below MROV. Similarly, 2 of Beacon’s 4 bids were <MROV, with no rejections.

Block No.Companyno. of bidsbidMROVLBCI
GC 345Beacon1$5,302,358$5,400,000$4,200,000
GC 346Beacon1$1,102,358$1,500,000$900,000
GC 547Equinor1$3,200,067$4,500,000$2,600,000
GC 549Equinor1$899,967$1,500,000$576,000
AT 64LLOG1$7,997,018$8,300,000$6,700.000
KC 386Oxy2$3,000,505$3,500,000$2,800,000
KC 429Oxy1$600,505$910,000$470,000
KC 431Woodside1$904,547$1,200,000$840,000
WR 56Equinor1$904,547$1,200,000$576,000
MROV=Mean of the Range-of-Value; LBCI=Lower Bound Confidence Interval; AT=Atwater Valley, GC=Green Canyon, KC=Keathley Canyon, WR=Walker Ridge

Perhaps most interesting were the blocks that were highly valued by industry, but not by BOEM. Each of these blocks (table below) received multiple bids and high bids >$10 million. Conversely, BOEM valued the blocks at only $576,000, which (per the terms of the sale) equates to the minimum acceptable bid of $100/acre.

Block No.high bidderhigh bidother bidsMROV
GC 845Beacon$11,802,358LLOG: $613,008$576,000
KC 25Chevron$18,592,086BP: $11,507,770
Shell: $753,029
$576,000
WR 443Woodside$15,204,547Chevron $1,596,189$576,000
WR444Woodside$12,204,547BP: $4,593,770
Chevron $1,482,378
$576,000
MROV=Mean of the Range-of-Value; LBCI=Lower Bound Confidence Interval; GC=Green Canyon, KC=Keathley Canyon, WR=Walker Ridge


All of this demonstrates yet again that:

  • the govt is leasing exploration and development opportunities, not confirmed resources,
  • commercial discoveries are far from certain,
  • informed assessments differ (I.e. great minds, and their computers, don’t always think alike 😀),
  • corporate priorities differ, and
  • exploration strategies evolve.

Superstition, tactic, AI, coded or subliminal message? 😉

  • All 58 BP bids end with 770. Examples: $1,707,770 and $807,770. (At Sale BBG2, all 5 BP bids ended with 990.)
  • All 18 Shell bids ended with 029. (At Sale BBG2, all 6 Shell bids ended with 240.)
  • 13 of 15 Anadarko bids ended with 505, the other 2 ended with 101.
  • All 9 Woodside bids ended with 547.
  • All 3 Eni bids ended with 001.
  • All 4 Arena bids ended with 912.
  • All 12 Talos bids ended with 986.
  • All 3 Beacon bids ended with 358.

Read Full Post »

The ESA, which was enacted with good intentions, has perhaps been most effective in blocking, delaying, or complicating energy development. In the Gulf of America, the primary species in recent ESA battles has been the Rice’s whale.

While this blog was focused on the Santa Ynez Unit drama, a major ESA policy maneuver for the Gulf of America was in the works.

A provision of the ESA authorizes an Endangered Species Committee, known to critics as the “God Squad,” to grant exemptions to ESA requirements. The Committee is comprised of the Secretary of the Interior (chair), the Secretary of Agriculture, the Secretary of the Army, the Chairman of the Council of Economic Advisors, the Administrator of the Environmental Protection Agency, and the Administrator of the National Oceanic and Atmospheric Administration.

Yesterday, the Committee met (notice attached) and agreed to exempt Gulf oil and gas operations from the Endangered Species Act.

Knowing the swings in the political pendulum, provisions for reversing this decision warrant attention. The applicable language from the statute is pasted below:

16 U.S. Code § 1536 (h)(2)

(B) An exemption shall be permanent under subparagraph (A) unless

(i) the Secretary finds, based on the best scientific and commercial data available, that such exemption would result in the extinction of a species that was not the subject of consultation under subsection (a)(2) or was not identified in any biological assessment conducted under subsection (c), and

(ii) the Committee determines within 60 days after the date of the Secretary’s finding that the exemption should not be permanent.

So, barring legislation, the exemption would seem to be difficult to overturn.

Earthjustice is vowing to “go to court to stop this illegal order.”

Read Full Post »

Although no one was expecting a barnburner only 3 months after the previous sale, BBG2 was historically weak for a Gulf-wide sale. The table below compares BBG2 with the previous 4 Gulf sales, none of which were particularly impressive.

However, the sale was not without highlights. There was some spirited bidding for tracts in the Green Canyon area. BP’s bid was the highest of 5 for GC Block 404. BP bid $21 million for the block, 45% of the high bids sum for the entire sale. The BP bid was also $20 million higher than the next highest bid for that tract (ouch!).

Also interesting was Chevron edging Shell $5,887,188.00 to $5,501,240.00 to acquire GC Block 492.

Sale No.257259261BBG1BBG2
date11/17/20213/29/202312/20/202312/10/20253/11/2026
companies
participating
3332263013
total bids22332842316121938
tracts receiving bids21432442275118125
sum of all bids
$millions
198.5309.8441.9371.969.9
sum of high bids
($millions)
101.7263.8382.2279.447.0
highest bid
company
block
$10,001,252
Anadarko
AC 259
$15,911,947
Chevron
KC 96
$25,500,085
Anadarko
MC 389
$18,592,086
Chevron
KC 25
$21,009,990
bp
GC 404
most high bids
company
sum ($millions)
46
bp
29.0
75
Chevron
108.0
65
Shell
69.0
50
bp
61.0
6
Anadarko (Oxy)
4.0
sum of high bids ($millions)
company
47.1
Chevron
108
Chevron
88.3
Hess
61.0
bp
22.6
bp
most high bids by independent14-DG Expl.13-Beacon
13-Red Willow
22-Red Willow14-Murphy5-LLOG
1excludes 36 leases improperly acquired for carbon disposal purposes; 2excludes 69 leases improperly acquired for carbon disposal purposes; 3excludes 94 leases improperly acquired for carbon disposal purposes

For historical comparison purposes, Gulf Sale 206 drew $3.7 billion ($5.6 billion in today’s dollars) in 2008. Twenty-siz sales between 1972 and 2013 garnered more than $1 billion in high bids.

Sale stats

Read Full Post »

Tracts receiving bids in Sale BBG1

To date,BOEM has deemed 96 of the 181 BBG1 high bids to be acceptable. No high bids have been rejected. Although the sale was “beautiful but not big,” the bids were relatively strong on a per acre basis. The number of rejected bids may thus be quite low.

No bids were accepted during BBG1’s Phase 1 review. This means that none of the tracts receiving bids were determined to be nonviable as was the case for the 199 tracts that were improperly acquired for carbon disposal purposes in Sales 257, 259, and 261. (Unsurprisingly, neither of the acquiring companies has submitted an exploration plan for any of these CCS leases. The leases will likely expire without activity. Much to the dismay of the large and diverse group of opponents, the carbon disposal industry is focusing on onshore locations along the Gulf Coast.)

Meanwhile, a Cook Inlet lease sale is scheduled for March 4, and another Gulf of America sale will be held on March 11. Despite attractive terms, don’t expect either to be a banner “red jacket” lease sale. (See the John Rankin recognition below.)

More information on BOEM’s bid evaluation process.

Read Full Post »

Was 2025 the Gulf’s highest ever production year? We’ll find out in 3 weeks when EIA posts the December 2025 data.

November production dipped a bit putting the production record in doubt. December production had to average 1.993 million bopd to match 2019.

There are also typically small revisions for the prior two months, which could affect the outcome. It will be a nail-biter! 😉

Top 3 oil production years for Federal waters in the Gulf:

Top 3 Yearsave. daily production (1000’s of barrels)
20191898
2025 (through November)1889
20231864

Read Full Post »

The 2025 Gulf of America Safety Compliance Leaders are ranked below according to the number of incidents of non-compliance (INCs) per facility inspection. To be ranked, a company must:

  • operate at least 2 production platforms
  • have drilled at least 2 wells during the year
  • average <1 INC for every 5 facility inspections (0.20 INCs/facility inspection). This is a higher standard (fewer INCs) than in previous years.
  • average <1 INC for every 10 inspections (0.1 INCs/inspection). Note that each facility inspection may include multiple types of inspections (e.g. production, pipeline, pollution, Coast Guard, site security, etc). In 2025, there were on average 3.2 inspections for every facility inspection.
operatorWCSIFSItotal INCsfacility inspINCs/
fac insp
inspINCs/
insp
Shell381122310.055570.02
Chevron1080182600.077720.02
Oxy26191330.073250.03
BP820101220.083040.03
Murphy6208700.111770.05
Cantium574161210.134880.03
Gulf-wide 202581544584134431790.42102180.13
Gulf-wide 2024957398109146431330.47106640.14
Notes: Numbers are from published BSEE data; INC=incident of non-compliance; W=warning INC; CSI=component shut-in INC; FSI=facility shut-in INC; INCs/fac insp= INCs issued per facility inspection; each facility-inspection may include multiple types of inspections (e.g. production, pipeline, pollution, Coast Guard, site security, etc), in 2025, there were on average 3.2 inspections for every facility inspection

Criteria: This ranking is based solely on BSEE’s published compliance data. The absence of timely public information on safety incidents (e.g. injuries, fires, pollution, gas releases, property damage) precludes inclusion of these data. Although Panel Investigations are conducted for fatalities, serious injuries, and significant pollution events, the last panel report was for an incident on 3/25/2022, and no information is available for any ongoing investigations. BSEE District offices investigate the more significant incidents that don’t qualify for panel investigations. These District Investigation reports are more timely, but some are not issued within 90 days of the incident. The District reports will be reviewed later in the year. Note that there were no occupational fatalities in 2025.

Observations:

  • The overall inspection and INC results for 2025 were similar to those for 2024.
  • The top companies performed better in 2025 than in 2024. In 2024, only 2 companies had INC/facility inspection ratios of <0.10 and only 3 had ratios <0.15. In 2025, all 6 of the performance leaders had ratios <0.15.
  • All 6 of these top companies were also on the 2024 top performers list.
  • Shell’s total INCs and INCs/facility inspection decreased by 73% and 78% respectively vs. 2024
  • Cantium, which operates 85 shallow water platforms, has demonstrated that a shelf operator can be an outstanding safety performer. Cantium’s total INCs and INCs/facility inspection decreased by 50% vs. 2024
  • Should fewer inspections be conducted at facilities that have such low INC rates? On the one hand, fewer inspections would reduce regulatory costs and transportation risks. On the other hand, there are benefits from BSEE inspection visits besides compliance enforcement. These include direct communication with offshore workers (including contractors) regarding regulatory policies and safety practices, witnessing safety tests, evaluating new technology, and assessing management system implementation and corporate culture at the facility level.
  • Absent specific details on the violations, no attempt was made to weight the INCs. Although shut-in INCs are generally considered to be more significant than warnings, that is not always the case. For example, a component shut-in INC for a safety device that is marginally out of tolerance and is corrected on the spot may be less serious than a warning that is indicative of structural deterioration, poor maintenance, or organizational shortcomings.

Not meeting one of the activity level requirements, but nonetheless noteworthy, were the compliance records of LLOG and BOE Exploration & Production (younger than and unrelated to the BOE blog 😀). See their impressive results below:

operatorWCSIFSItotal INCsfacility inspINCs/
fac insp
inspINCs/
insp
BOE0011330.03780.01
LLOG1113290.10780.04

Read Full Post »

Shell topped the list followed by Chevron, Oxy/Anadarko, bp, Murphy, and Cantium.

Details and observations will be posted tomorrow.

Read Full Post »

Excellent AAPG article

“We have not been finding enough new fields.” That’s William DeMis, president of Richelle Court, LLC, who said that, in addition to not finding enough, we keep erecting new ways to export what we’re not finding.

The way, he said, to avert the coming shortage is for people to find new sources of gas outside of Haynesville field, which for years, considering its proximity to the Gulf Coast, and the petrochemical plants of Southwest Louisiana, as well as pipelines, made it a swing producer for natural gas.

“But I can tell you from bitter experience over the last three years that finding people to fund greenfield exploration is darn near impossible. There is scant capital to drill natural gas wildcats in the U.S.” said DeMis.

Reiterating that it’s time for another look at ultradeep shelf gas in the Gulf. Should BOEM consider royalty incentives?

Read Full Post »

October 2025 Gulf of America oil production was the 2nd highest in history. As a result, the November data are much anticipated. Those data have been delayed from the scheduled date of 1/29/2026 until 2/6/2026. See the EIA advisory below

Petroleum Supply Monthly (PSM) data for November 2025 are scheduled for release on Friday, February 6, 2026.

The U.S. Census Bureau will release trade data (both imports and exports) for November 2025 on Thursday, January 29, 2026. As a result, we will delay release of PSM data for November 2025 from the original scheduled release date of January 30, 2026, until Friday, February 6, 2026. The delayed PSM release will allow us time to incorporate export data for November 2025.

Read Full Post »

Older Posts »