Feeds:
Posts
Comments

Archive for the ‘Gulf of Mexico’ Category

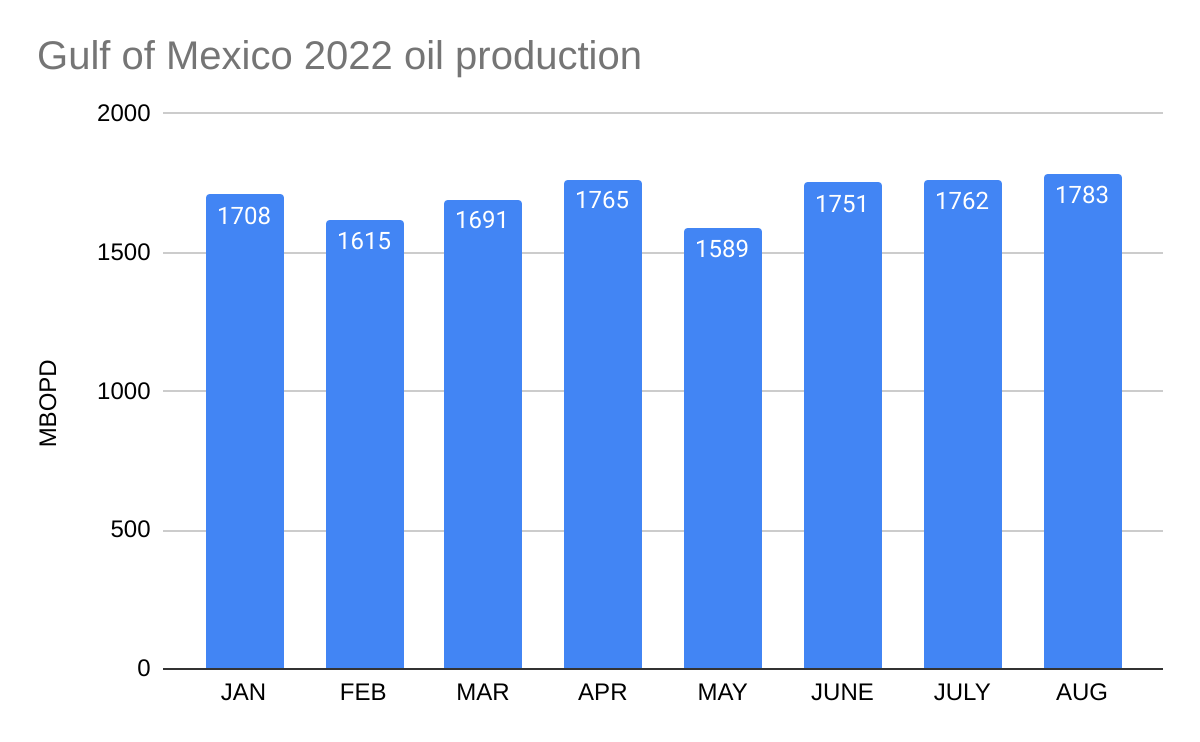
Using the World Bank’s worldwide flaring data and ONRR flaring and venting data for the GoM, I compared GoM flaring intensity for 2021 with that of the World Bank’s top ten flaring nations. This is just one example of why US offshore production is a preferred and vital component of our energy mix.

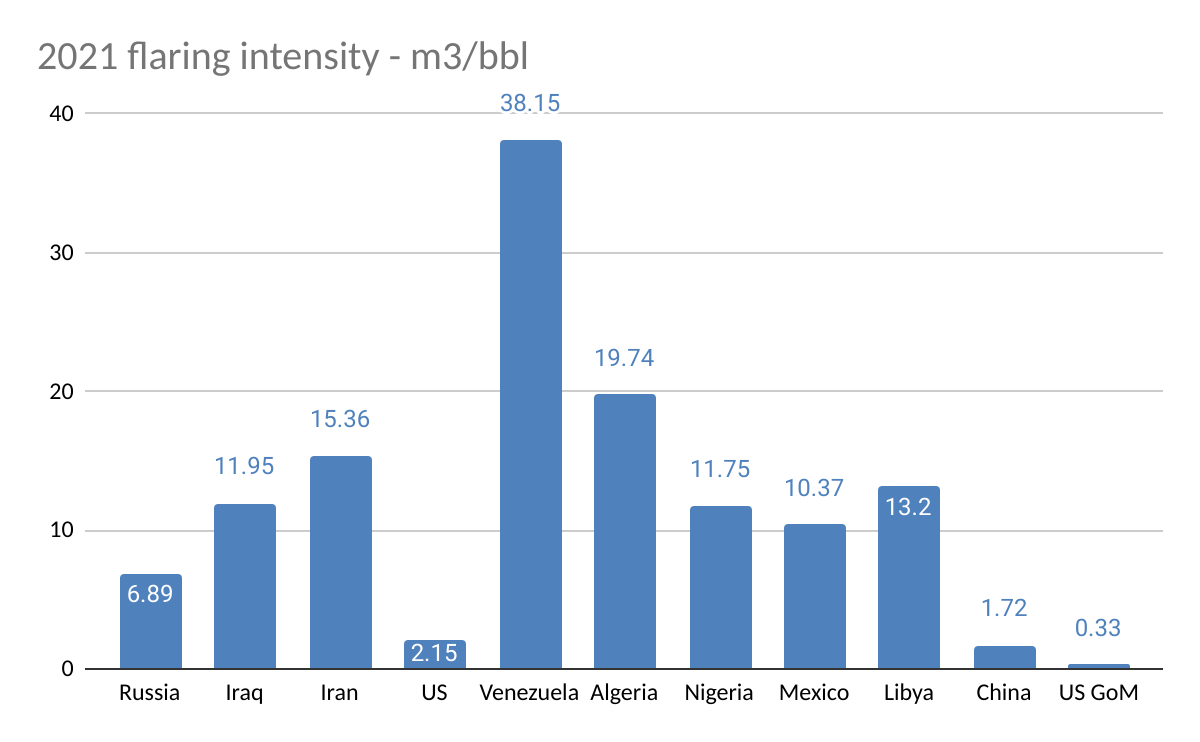
Further discussion: Kudos to the World Bank for their use of satellite data to estimate flaring volumes worldwide. Their primary performance indicator is flaring intensity (volume flared per bbl of oil produced). Absent better worldwide reporting regimes, satellite data are essential. However, there are issues with the World Bank’s system that merit further consideration:

  • Satellites miss some flares and vented gas (a more significant GHG concern) is not detected
  • A prior review of Gulf of Mexico data indicated that the World Bank flaring estimates are low.
  • The flaring intensity indicator penalizes higher gas-oil ratio (GOR) wells. Production upsets of the same duration yield higher flaring intensity scores at higher GOR facilities.
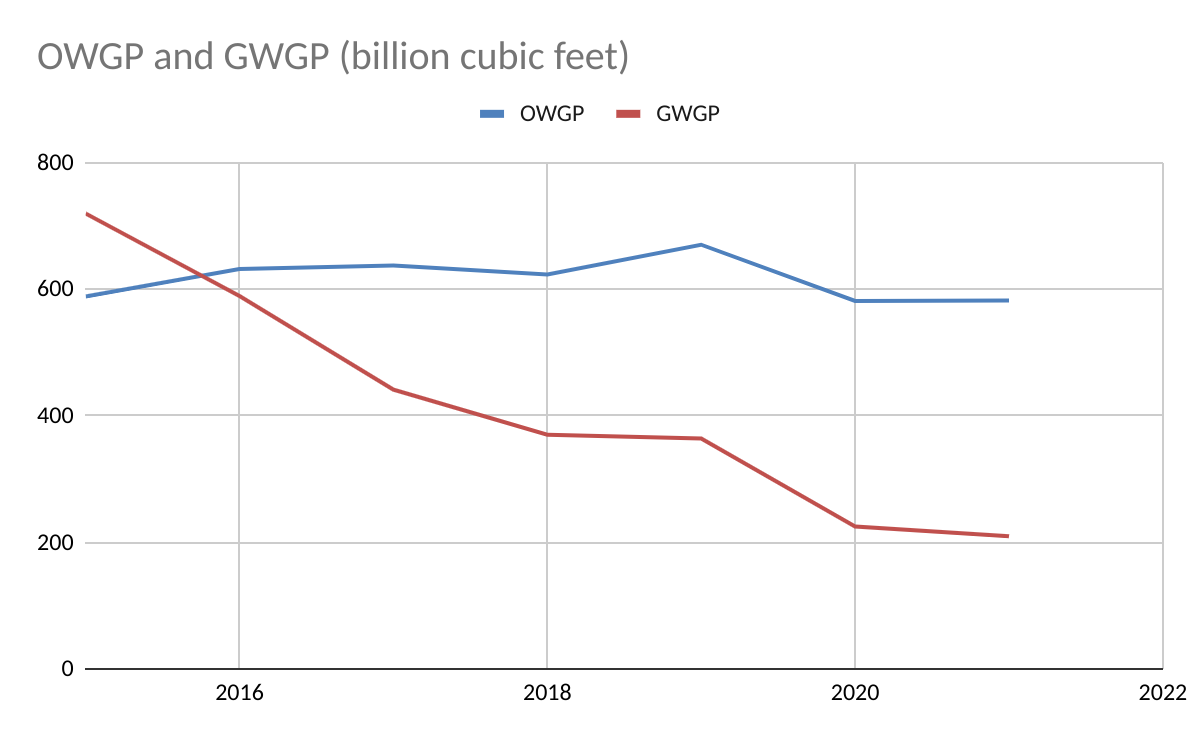
  • Associated gas is an environmentally favorable energy source that should not be discouraged. Most Gulf of Mexico gas production is now from oil wells. Efficient collection and utilization is the key.
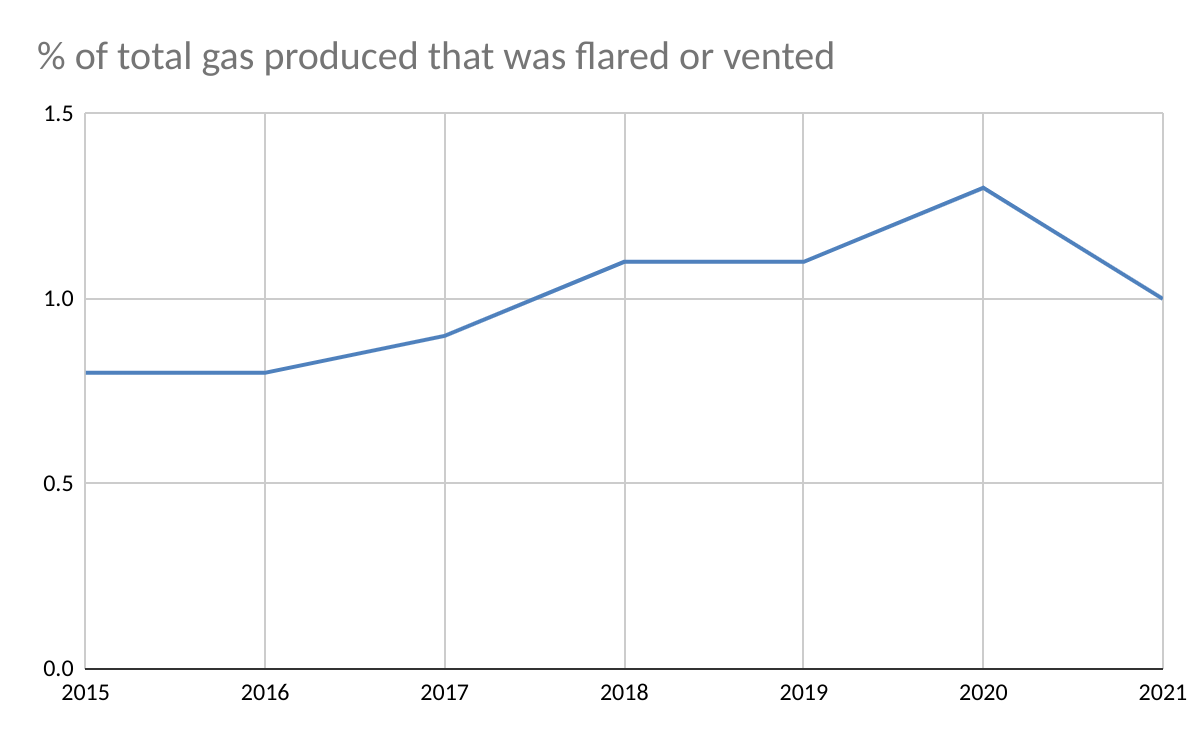
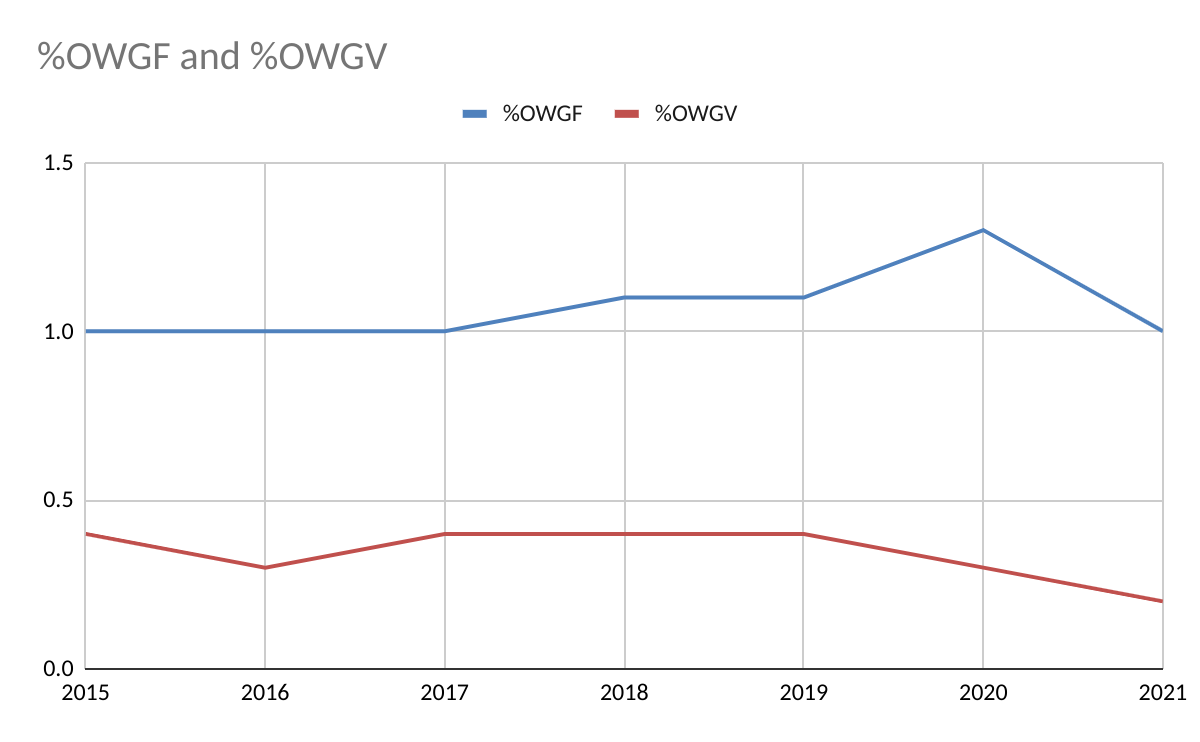
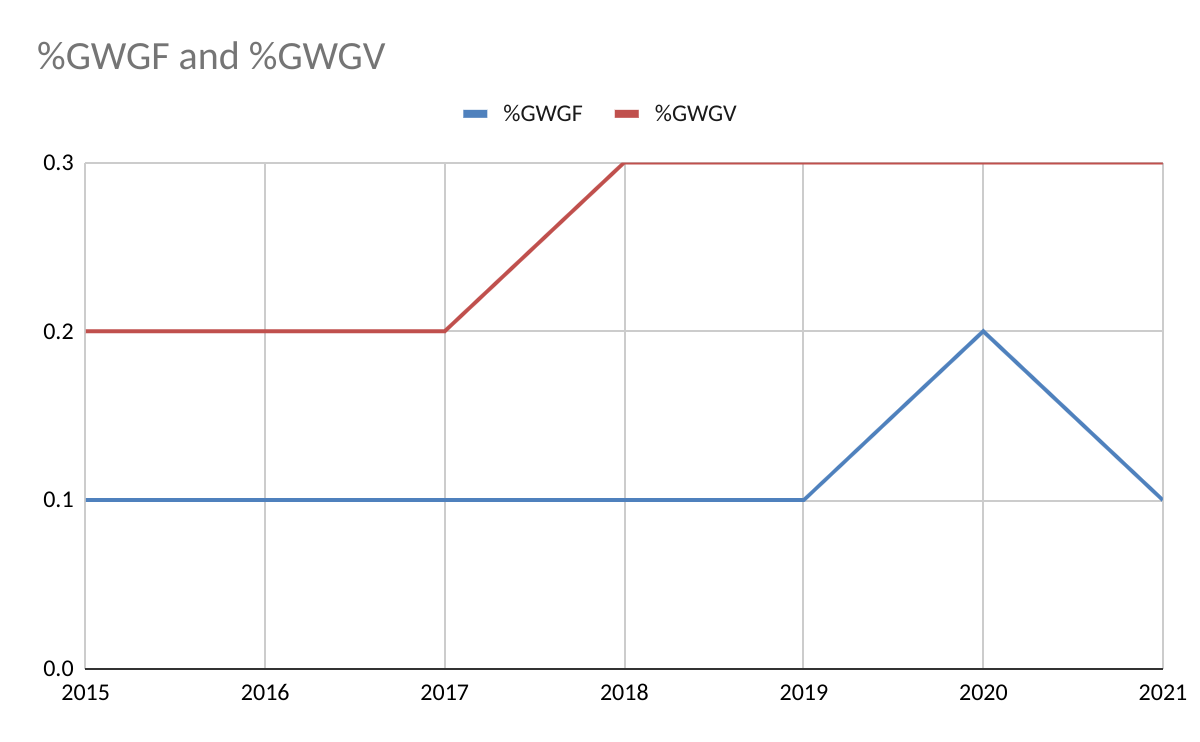
  • There will always be some production upsets that result in flaring. The objective should be to minimize the % of oil-well and gas-well gas that is flared, irrespective of the amount of oil production. See the recent GoM summary data posted here and here.

Read Full Post »

BSEE’s temporary abandonment/decommissioning solicitation has been posted. Some details:

  • 14 wells to be decommissioned
  • 1 well to be checked to confirm temporary abandonment
  • Well depths: 2359′ to 11934′
  • Water depths: 70′ to 477′
  • 11 gas wells, 3 oil wells
  • Well completion dates: 2006-2008
  • Last production: 2010-2013 (Presumably, the short productive life of these wells either contributed to or was because of the lessees’ bankruptcies.)
  • $25,000😀 minimum to $100,000,000 maximum contract guarantee

If I was an offshore contractor, I wouldn’t touch this work without:

  1. Ironclad liability protection after the work is completed and inspected. A contractor should not inherit the perpetual liability that the lessees knowingly and willfully accepted when they purchased the leases and conducted operations; nor is the contractor responsible for the failure of industry and government to establish a financial assurance framework that protects the taxpayer from such liabilities.
  2. Protection against likely cost overruns related to the uncertain downhole condition of the wells.

Previous posts on this matter:

Taxpayer funded decommissioning – troubling precedent for the US offshore program

NOT a shining moment for the offshore industry

Read Full Post »

Further, per the ONRR data:

Oil-Well Gas
Produced
(BCF)
Gas-Well Gas
Produced
(BCF)
total gas
produced
(BCF)
total gas flared
or vented
(BCF)
% flared
or vented
2015588.4719.41307.810.30.8
2016631.7589.11220.89.70.8
2017637.3441.21078.59.90.9
2018623.1370.1993.210.61.1
2019670.2364.11034.311.71.1
2020581.4224.9806.310.41.3
2021582.2209.5791.78.21

Read Full Post »

Gulf of Mexico flaring and venting data have been sorted for the years 2015-2021. The reporting of these data is mandatory and strictly enforced, so these ONRR numbers should be accurate.

Biggest surprise: The biggest surprise is that there were no big surprises in the data. The % of gas flared and vented were generally consistent with expectations based on familiarity with historical data.

Biggest disappointment: the continued sharp decline in nonassociated (gas-well) gas production. GoM gas well gas production exceeded 4 tcf annually in the 1990s and was still above one tcf ten years ago. Since then, GWG production has declined by 80%. Nonassociated offshore natural gas has important environmental advantages, so the decline in production should be a major concern to policy makers

Encouraging sign: The % of oil-well gas vented has ticked down over the past 2 years which is encouraging from a GHG standpoint. This is presumably because most associated gas is produced on modern deepwater facilities equipped with flare booms. An astute politician would be rushing to take credit for this achievement.😀

Unfavorable ratio: Although the volumes are low (<1 Bcf combined in 2021), more gas-well gas was vented each year than flared. This is presumably because older shelf facilities without flare booms still produce much of the natural gas.

Abbreviations:

  • ONRR: Office of Natural Resources Revenue
  • GoM: Federal waters of the Gulf of Mexico
  • OWGP: oil-well gas production
  • GWGP: gas-well gas production
  • OWGF: oil-well gas flared
  • OWGV: oil-well gas vented
  • GWGF: gas-well gas flared
  • GWGV: gas-well gas vented

Read Full Post »

BOEM’s 2022 production forecast, which was just published in July, was 1.9 million BOPD, and will likely be a full 10% too high for the year. One has to assume that the staff work was completed well before the document was actually published. Of greater concern, BOEM’s longer term production forecast, along with unrealistic expectations for the “transition,” were used to justify a subminimal 5 year leasing plan with the fewest sales in history.

Read Full Post »

NASA has identified 50+ super-emitters of methane including sites in Turkmenistan (image below) that emit an estimated 111,000 pounds per hour.


By comparison, vented Gulf of Mexico methane emissions in 2021 totaled 1953 mmcf. This converts to 82 million pounds at atmospheric pressure and 60°F. The identified Turkmenistan sources would thus release the amount of methane in a month that all Gulf of Mexico facilities vent in a year (2021).

East of Hazar, Turkmenistan, a port city on the Caspian Sea, 12 plumes of methane stream westward. The plumes were detected by NASA’s Earth Surface Mineral Dust Source Investigation mission and some of them stretch for more than 20 miles (32 kilometers).

Read Full Post »

ONRR mandatory production reporting data are being sorted to assess GoM flaring and venting trends. This will help resolve inconsistencies previously identified. In the meantime, the table below summarizes the 2021 data. 1.03% of the gas produced that year was flared or vented. 0.25% of the gas production was vented.

Interestingly, more gas-well gas was vented than flared. This is presumably because older shelf facilities without flare booms still produce 25% of the gas (versus only 7% of the oil), mostly from gas wells. More to follow.

gas
production
flared (%)vented (%)flared &
vented (%)
OWG582,2045919 (1.01)1405 (0.24)7324 (1.26)
GWG209,779311 (0.15)548 (0.26)859 (0.41)
total 791,9836230 (0.79)1953 (0.25)8183 (1.03)
OWG=oil well gas; GWG=gas well gas; all volumes are in MMCF

Read Full Post »

Offshore

Per BOEM’s leasing data base, all 94 of the Sale 257 “carbon sequestration leases” (blue) were issued with an effective date of 10/1/2022. However, Sale 257 was an oil and gas sale, and the leases do not convey carbon sequestration rights. Each lease will expire in 5 years absent oil and gas production or ongoing drilling operations.

These oil and gas leases may not be repurposed for sequestration or other purposes unless an alternate use RUE is issued competitively in accordance with 30 CFR § 585.1007.

So what’s next for these 94 leases, 31% of the entire sale?

Read Full Post »

Kudos to ONRR for posting complete flaring and venting data for all oil and gas operations on US Federal and Indian lands. These data, which distinguish between oil-well gas and gas-well gas, are included in the large “Production Disposition by Month” file that can be downloaded here.

The data should give us a good read on flaring and venting trends and help resolve the inconsistencies previously identified.

Read Full Post »

Where is the leadership? Offshore decommissioning costs should never fall on the taxpayer. See the attached notice (excerpt below) and a previous post on this topic.

BSEE intends to execute a multi-award IDIQ Quantity Contract inclusive of a Base Year and Four (4) Option Years; however, the government reserves the right to award the IDIQ contract to a single firm. Time & Material, Labor Hour, and/or firm-fixed price task orders will be awarded for Decommissioning Services necessary to take nine (9) orphaned facilities, located in the OCS of the Gulf of Mexico, to the point of Temporary Abandonment (TA). The estimated decommissioning cost for temporary abandonment is $10,000,000 to $20,000,000.

Read Full Post »

« Newer Posts - Older Posts »