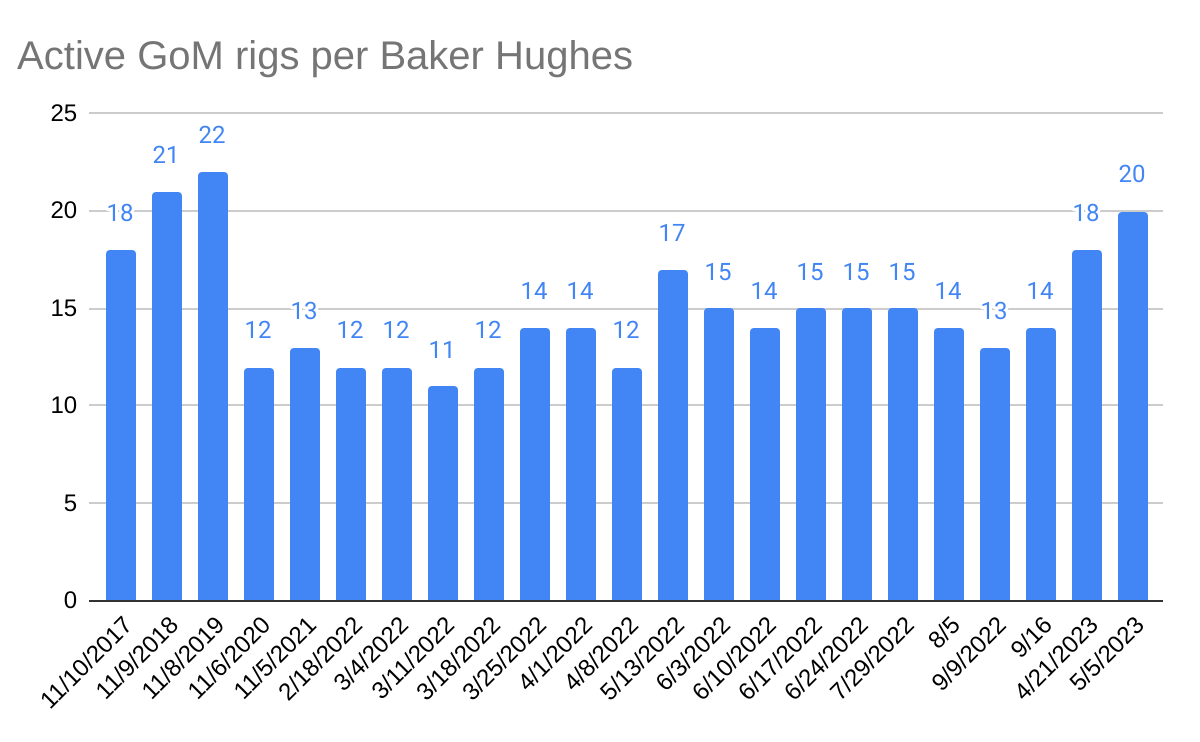
The Gulf rig count is up to 20, the highest since 2019, as the total US rig count falls by 7 to 748.
Posted in drilling, Gulf of Mexico, Offshore Energy - General, tagged Baker Hughes rig count, drilling, Gulf of Mexico on May 8, 2023| Leave a Comment »
The Gulf rig count is up to 20, the highest since 2019, as the total US rig count falls by 7 to 748.
Posted in energy policy, Gulf of Mexico, Offshore Energy - General, Regulation, tagged Coast Guard, floating production units, OOC, SCOTUS, vessel definition on May 8, 2023| Leave a Comment »
Dr. Malcolm Sharples, a leading marine engineer and offshore safety advocate, brought this Supreme Court’s decision and the resulting regulatory confusion to my attention.
It turns out that the SOCTUS decision about this houseboat…..
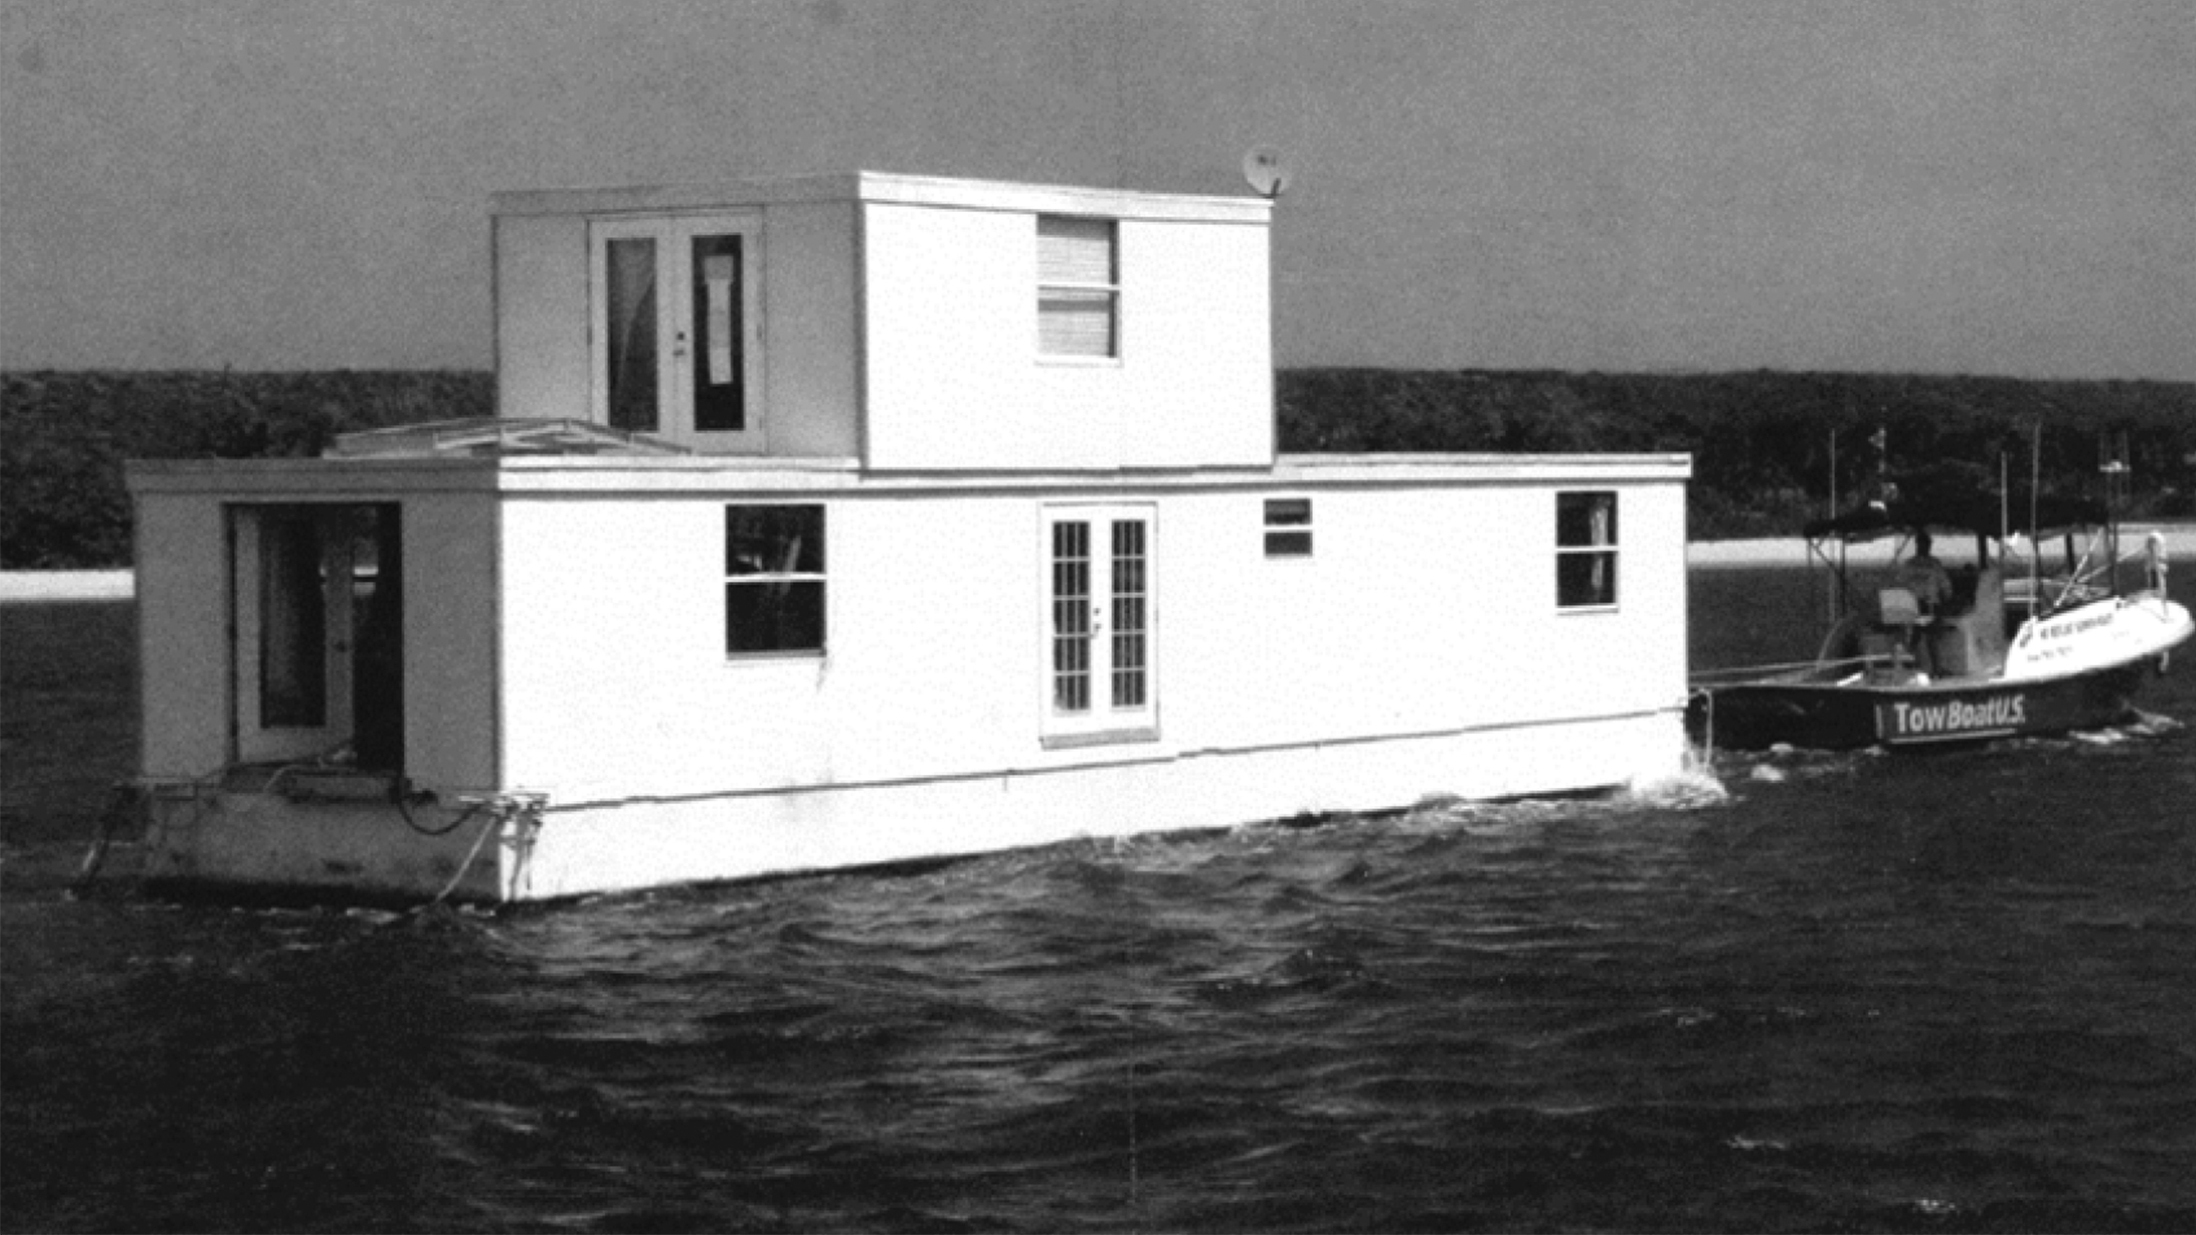
has created regulatory uncertainty for floating production facilities like this:

In a 7-2 decision, the court ruled that a gray, two-story home that its owner said was permanently moored to a Riviera Beach, Florida, marina was not a vessel, depriving the city of power under U.S. maritime law to seize and destroy it.
Reuters
The floating production facilities are still subject to Coast Guard regulation and inspection pursuant to separate authority under the OCS Lands Act. The extent to which Coast Guard approval and inspection practices will change is not entirely clear. The Coast Guard will issue new certificates of inspection for these floating facilities, and new policy guidance is being developed.
Attached are answers that the Coast Guard provided to questions from the Offshore Operators Committee.
This may be a good warmup for an upcoming post on regulatory fragmentation.
Posted in Alaska, Gulf of Mexico, Offshore Energy - General, tagged Cook Inlet, Gulf of Mexico, Lease Sale 257, Lease Sale 258, Lease Sale 259, litigation on May 5, 2023| Leave a Comment »
That would appear to be the case now that the US Court of Appeals for DC dismissed litigation challenging the sale.
Meanwhile, challenges to Cook Inlet Sale 258 (humble as it was with only one bid) and GoM Sale 259 continue. It’s a great country (if you like endless litigation)!
In addition to Lease Sale 257, the IRA also required Interior to offer three other lease sales in Alaska and the Gulf that it previously declined to hold. Lease Sale 258, in Alaska’s Cook Inlet, was held in December but received only one bid. Earthjustice is challenging that sale. Earthjustice is also challenging Lease Sale 259, in the Gulf of Mexico, which was held in March. Lease Sale 261, also in the Gulf, will be held by September of this year.
EarthJustice
Posted in energy, energy policy, Offshore Energy - General, Regulation, Uncategorized, tagged Chevron Doctrine, offshore energy, Regulation, Supreme Court on May 4, 2023| Leave a Comment »
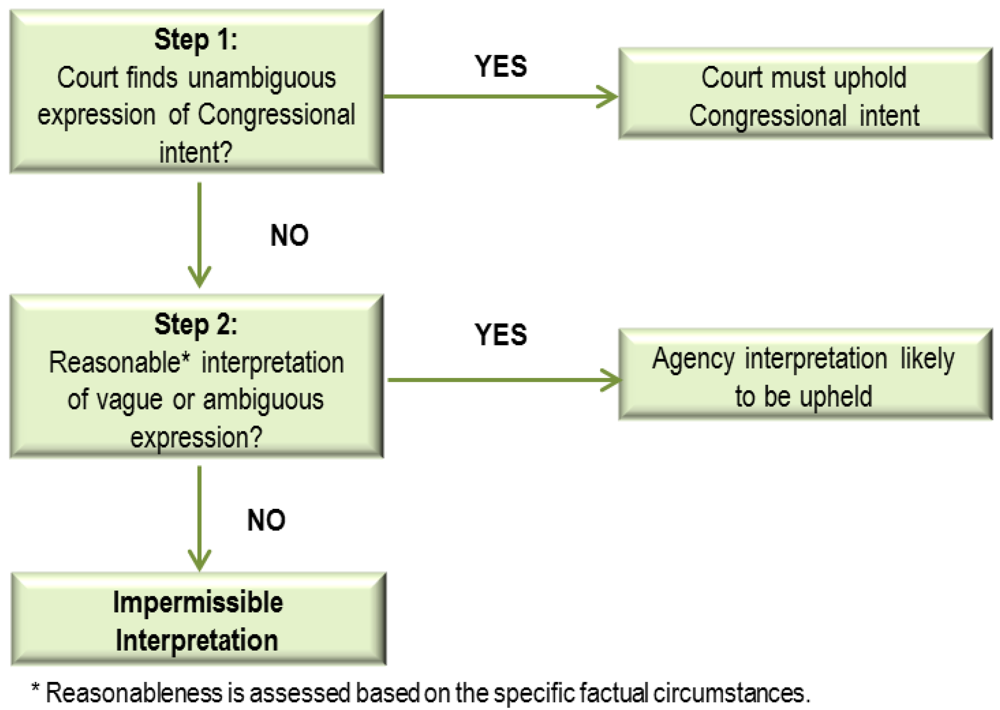
The Supreme Court will hear a case that could significantly scale back federal agencies’ authority, with implications for regulations affecting the US offshore program. The court could overturn a precedent known as the “Chevron doctrine” that instructs judges to defer to federal agencies when interpreting ambiguous federal laws.
Few Supreme Court doctrines have been stretched more by regulators and lower-court judges than Chevron deference, which says judges should defer to regulators’ interpretations when laws are supposedly ambiguous. The High Court agreed Monday to give Chevron a much-needed legal review.
WSJ
One of the most important principles in administrative law, the “Chevron deference” was coined after a landmark case, Chevron U.S.A., Inc. v. Natural Resources Defense Council, Inc., 468 U.S. 837 (1984). The Chevron deference is referring to the doctrine of judicial deference given to administrative actions. In Chevron, the Supreme Court set forth a legal test as to when the court should defer to the agency’s answer or interpretation, holding that such judicial deference is appropriate where the agency’s answer was not unreasonable, so long as Congress had not spoken directly to the precise issue at question.
Cornell Law
Posted in climate, flaring and venting, Gulf of Mexico, Offshore Energy - General, tagged EIA, flaring, gas-well gas, Gulf of Mexico, oil-well gas, ONRR, venting on May 3, 2023| Leave a Comment »
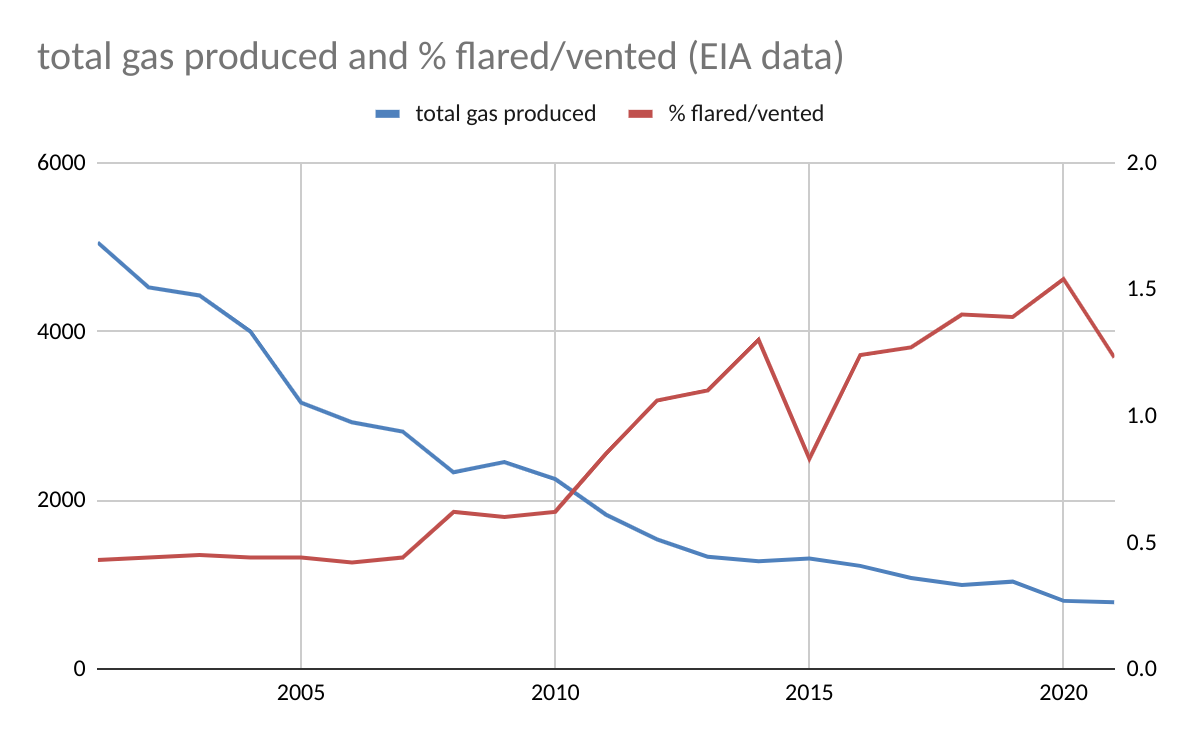
According to EIA data for 2001-2021, Gulf of Mexico flaring and venting volumes peaked in 2001 at 21.6 bcf, 2.25 times the volume flared or vented in 2022 (ONRR data for 2022). However, gas production in 2001 was 5.05 tcf, 6.4 times higher than in 2022. The % of the produced gas that was flared or vented in 2001 was thus 0.4%, less than 1/3 the 2022 rate of 1.22%.
Points to consider:
Posted in climate, flaring and venting, Gulf of Mexico, natural gas, Offshore Energy - General, tagged flaring, gas-well gas, Gulf of Mexico, oil-well gas, ONRR, venting on May 2, 2023| Leave a Comment »
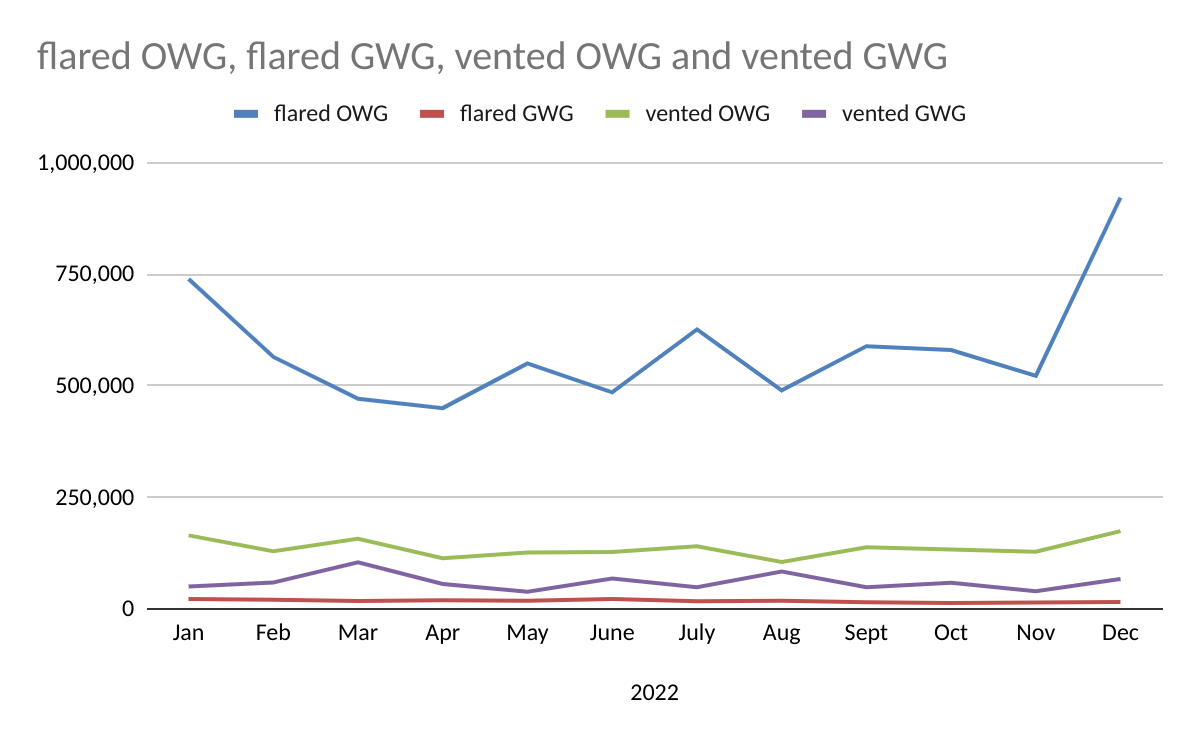
From ONRR OGOR B data:
| 2021 | 2022 | |
| OWG flared | 5919 | 6987 |
| OWG vented | 1405 | 1638 |
| GWG flared | 311 | 213 |
| GWG vented | 548 | 722 |
| total flared and vented | 8183 | 9559 |
| total gas prodution | 791,983 | 784,238 |
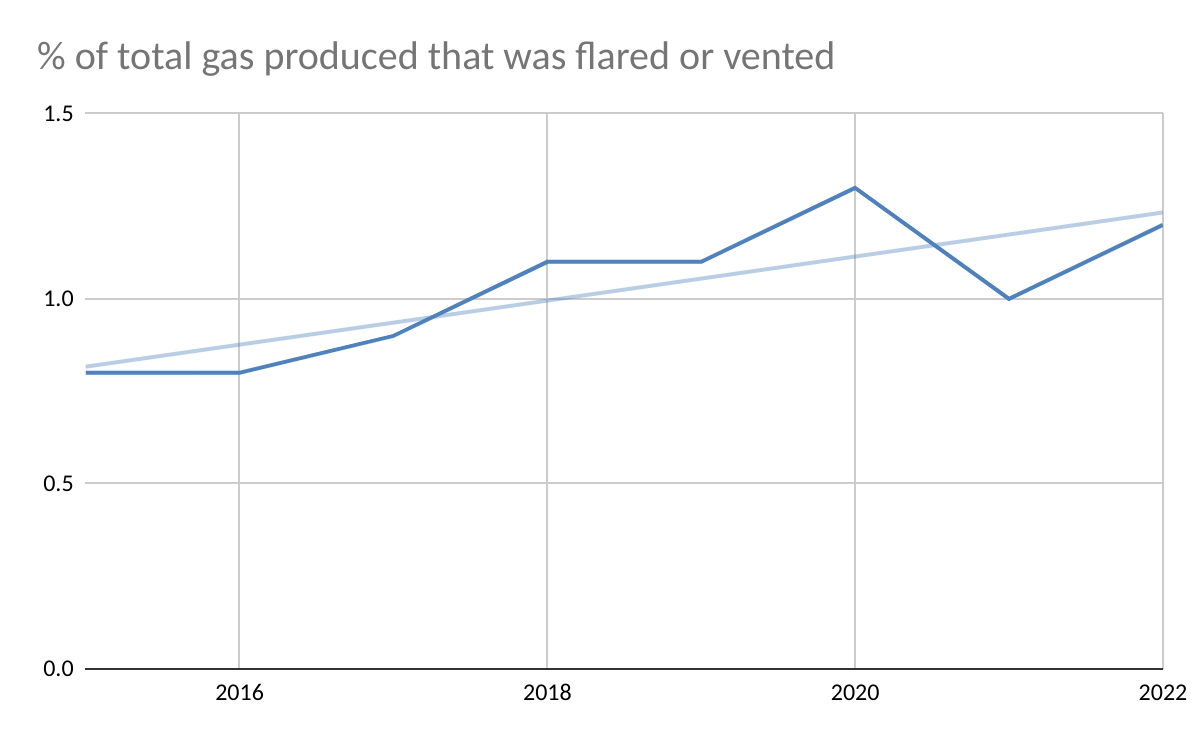
| % flared or vented | 1.03 | 1.22 |
Observations:


related:
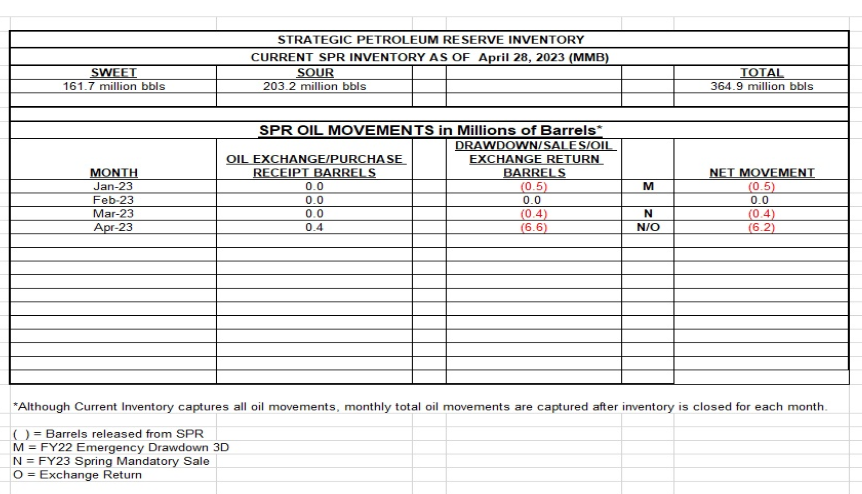
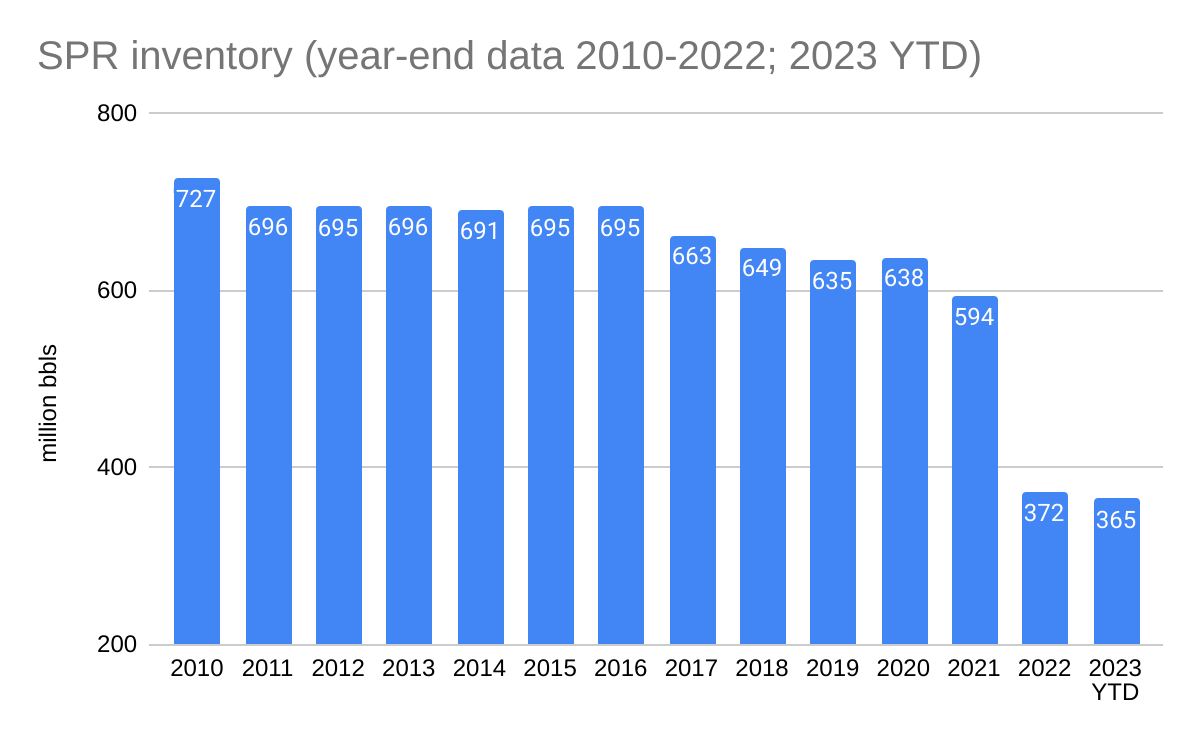
Posted in energy policy, tagged SPR depletion, Strategic Petroleum Reserve on May 1, 2023| Leave a Comment »
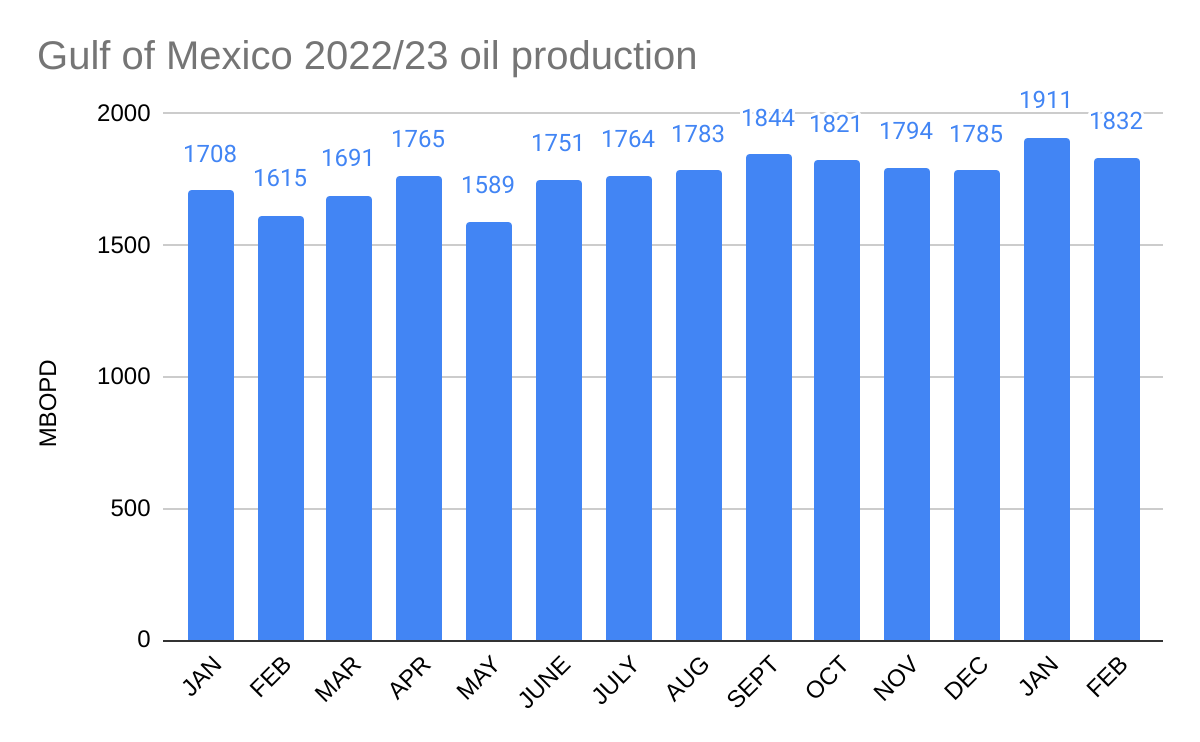
Posted in Gulf of Mexico, Offshore Energy - General, tagged 2023 oil production, Gulf of Mexico oil production on May 1, 2023| Leave a Comment »