Per a provision in the “Inflation Reduction Act,” no offshore wind leases may be issued after 12/20/2024, the one year anniversary of the last oil and gas lease sale (no. 261).
Although the 4 leases receiving bids at the most recent wind sale (10/29/2024, Gulf of Maine) have presumably been issued, BOEM’s lease table does not reflect that. If those leases have not been issued, it’s too late now.
Assuming that the Gulf of Maine leases have in fact already been issued, the legislative restriction on issuing new leases should not be an issue. A qualifying oil and gas lease sale will likely be held in the Gulf of Mexico in the first half of 2025.
The bigger question is whether the new administration will hold any wind lease sales. Pre-election energy policy comments imply that new wind sales are unlikely.
33 years before Elon and Vivek’s DOGE, there was the Clinton-Gore Government efficiency initiative known as the National Performance Review, aka the National Partnership for Reinventing Government (NPR).
President Clinton (March 3, 1992): “Our goal is to make the entire federal government less expensive and more efficient, and to change the culture of our national bureaucracy away from complacency and entitlement toward initiative and empowerment.”
Al Gore led this effort with gusto. While not revolutionary, the NPR was quite successful in streamlining government programs. VP Gore presented symbolic and prestigious “Hammer Awards” (image above) to initiatives that were judged to have accomplished the NPR objectives:
put customers first
cut red tape
empower employees
get back to basics
My Division in the Minerals Management was one of the few government offices to be honored with two hammers. Kudos to Bill Hauser and Kumkum Ray for leading these two efforts:
reducing the pressure test frequency for blowout preventers after completing a detailed statistical analysis demonstrating that there would be no increase in failure risk.
simplifying the operating regulations and rewriting the text in plain, easy-to-understand English.
Who would have thought Al Gore, Elon Musk, and Vivek Ramaswamy had so much in common? 😉
Addressing regulatory fragmentation will improve efficiency and lower costs for industry and government while reducing safety and environmental risks.
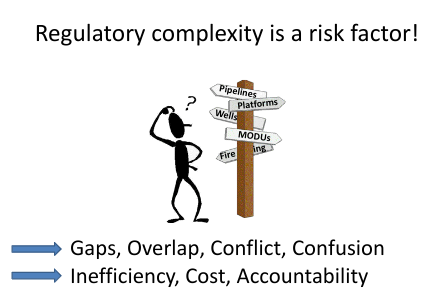
Unfortunately, the regulatory regime for US offshore oil and gas operations is noteworthy for redundancy, uncertainty, and complexity that divert industry and governmental attention from safety and environmental protection objectives to administrative processes, interpretations, and jurisdictional boundaries.
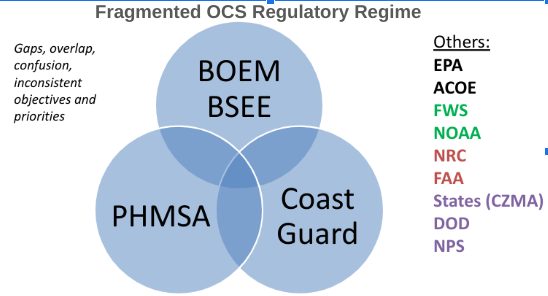
“Poster Child”for regulatory fragmentation?
The 12 Federal entities that have some OCS regulatory responsibilities are identified in the above chart. The organizations with core regulatory roles are included in the overlapping circles. The responsibilities of BOEM and BSEE are so inextricably intertwined that those bureaus occupy the same circle.
Coastal states also have OCS regulatory roles through authority granted in the Coastal Zone Management Act.
When multiple agencies have jurisdiction over a facility, system, or procedure, the redundancy inevitably results in inconsistency, ambiguity, and gaps in oversight. The focus of operating companies and contractors is diverted from safety and risk management to understanding and satisfying the regulators. The inevitable result is a compliance mentality that weakens the safety culture.
Interagency agreements in the form of MOUs and MOAs, which are ostensibly for the purpose of managing redundancy, are often unclear or inconclusive. They tend to be more for the benefit of the agencies than the regulated industry. The interests of the regulators and protecting turf are paramount.
Where legislation is not required (e.g. BOEM and BSEE), use executive orders to combine and streamline the regulatory functions.
Where agencies have separate legislative authority, establish a lead regulator by executive order pending corrective legislation. Under the EO, the agencies would function as a joint authority under the direction of the lead regulator.
A combined BOEM/BSEE would be the logical choice for leading the joint authority given that OCS energy is their sole focus and they are accountable for the success of OCS programs.
Use a management system regulatory approach that holistically considers all of the legislatively enacted regulatory objectives.
Increase the attention given to regulator and operator performance in terms of both outcomes and efficiency.
Reduce and simplify permitting requirements for operating companies that have demonstrated outstanding safety and environmental performance over a sustained period.
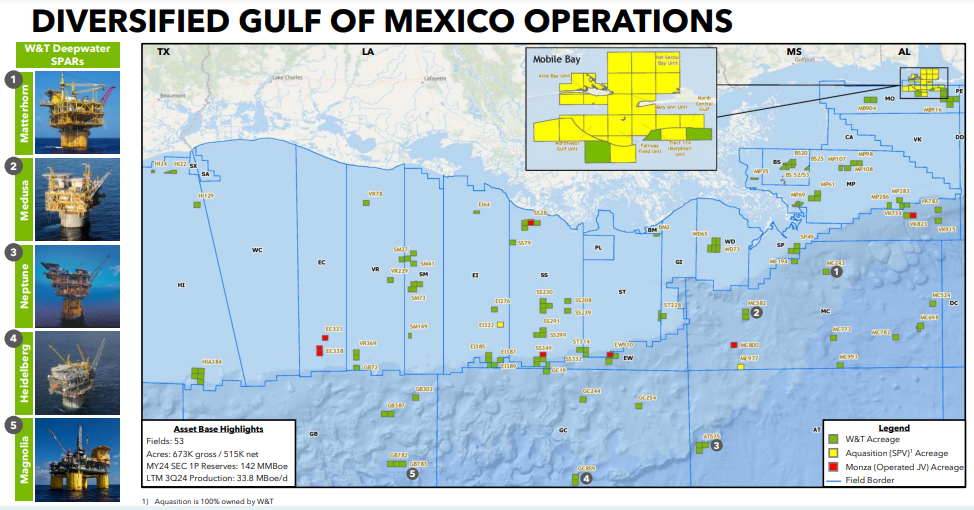
“At the heart of the dispute are rules from the federal Bureau of Ocean Energy Management – BOEM – which require energy producers in the Outer Continental Shelf to provide a bond to pay for well, platform, pipeline and facilities cleanup if the operating company fails to do so.”
“These insurance companies and their unreasonable demands for increased collateral pose an existential threat to independent operators like W&T.”
Comment: If insuring offshore decommissioning is so risk-free and lucrative, why aren’t other companies entering the market?
“Several states, including Texas, are challenging the BOEM rule and in one case they specifically cite W&T as an example of how the rule could be misused to irreparably harm energy producers.“
Comment:As previously posted, the concerned States should propose alternative solutions that would promote production while also protecting taxpayer interests. Arguing that decommissioning financial risks are not a problem is neither accurate nor a solution.
“In over 70 years of producer operations in the Gulf of Mexico, the federal government has never been forced to pay for any abandonment cleanup operations associated with well, platform facility, or pipeline operations.”
Comment: Shamefully, from the standpoints of both the offshore industry and the Federal government, that statement is no longer true. The taxpayer has now funded decommissioning operations in the Matagorda Island Area offshore Texas (BSEE photo below) and more significant decommissioning liabilities loom.
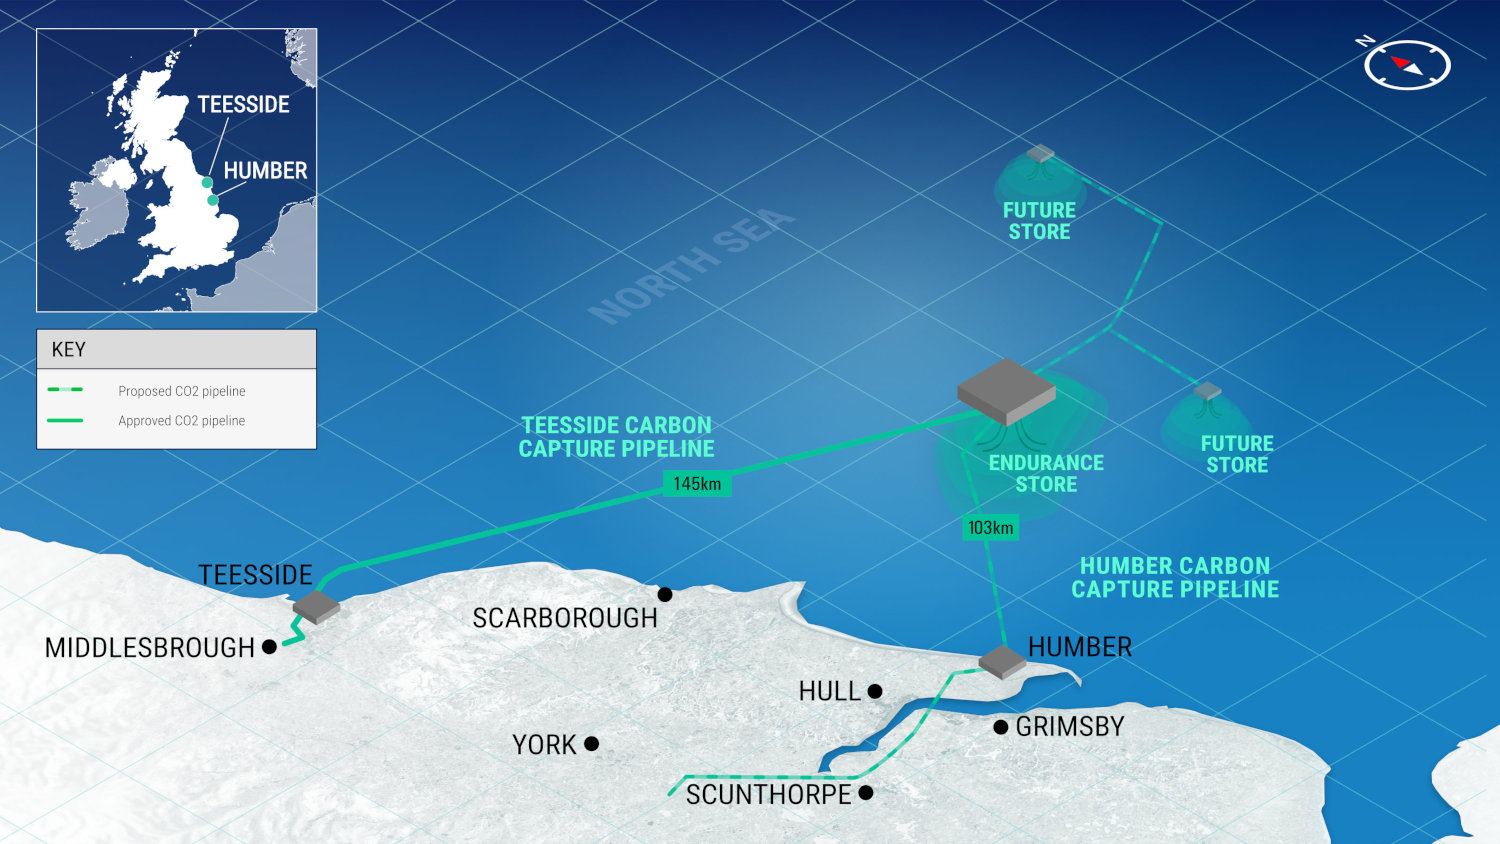
Northern Endurance Partnership (bp, Equinor, and Total) has been awarded the UK’s first permit to “store” CO2 beneath the North Sea.NEP plans to begin construction in the middle of 2025 with start-up expected in 2028 (bet the over!). Climate solution or costly virtue signaling at the public’s expense?
Fortunately, from the standpoint of US consumers and taxpayers, the push for carbon disposal in the Federal waters of the Gulf of Mexico has stalled, perhaps permanently. Oct.1 marked the 2 year anniversary of the 94 leases improperly acquired by Exxon at Sale 257 for carbon disposal purposes. Those leases will expire in 33 months (with the remaining 105 rogue leases expiring 1-2 years later) barring another legislative maneuver by industry advocates.
All of the previously posted questions about carbon disposal in the Gulf of Mexico remain, and most apply elsewhere. In particular, detailed cost-benefit analyses and risk assessments for these projects have not been provided. The intended permanency of offshore, subsurface carbon disposal raises complex monitoring, maintenance, liability, and decommissioning issues.
What are the carbon disposal proponents selling and why should governments be buying? If CO2 emissions are a significant threat to society (and informed opinions differ), is carbon disposal a cost effective solution?Policy decisions on subsidies for carbon disposal will be a good indication of how serious the new administration is about cutting Federal spending.
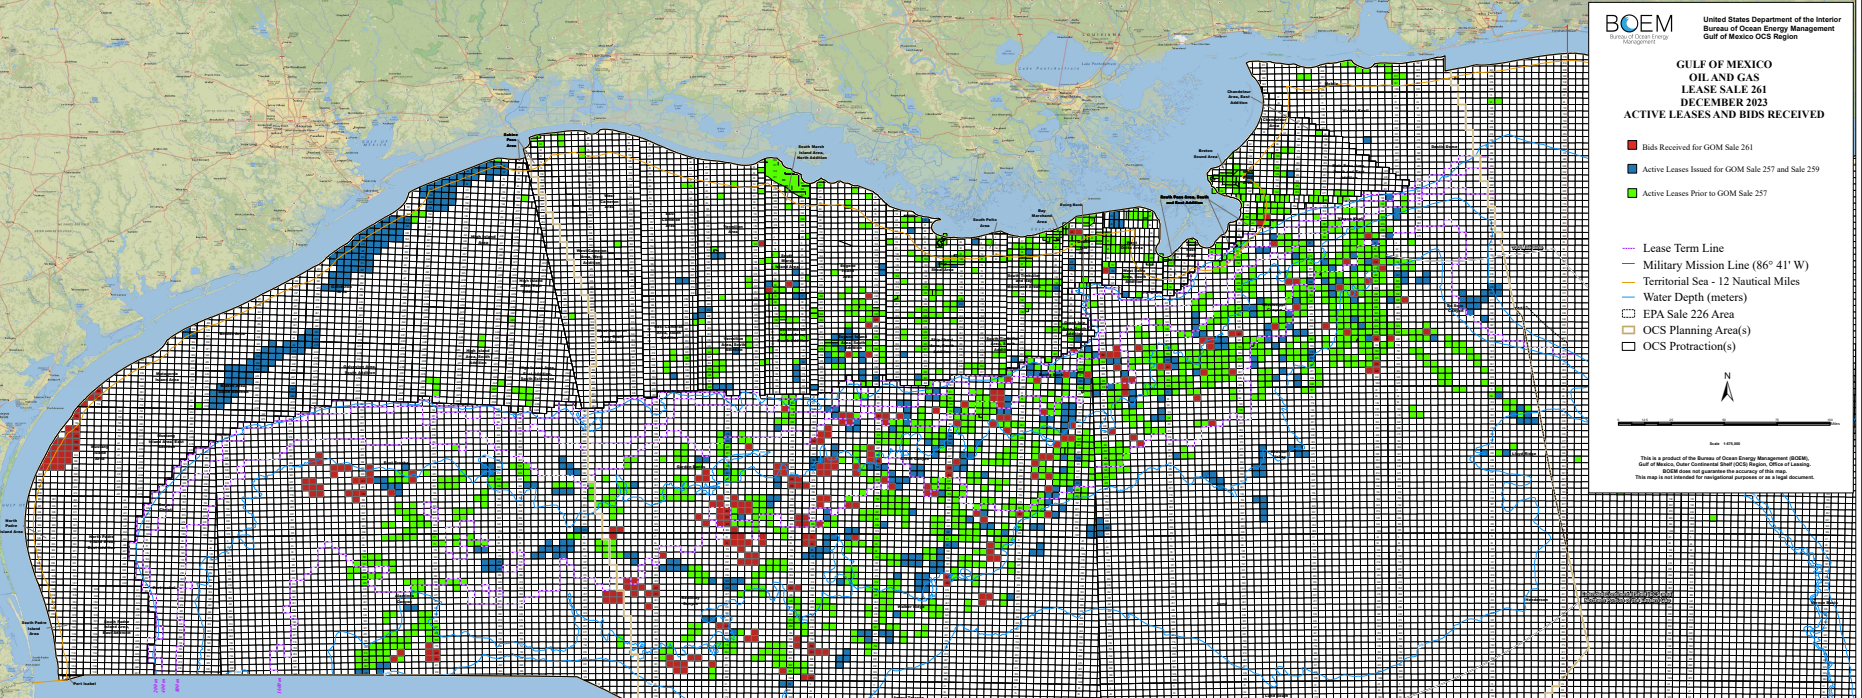
199 GoM oil and gas leases were wrongfully acquired for carbon disposal purposes. At Sale 261, Repsol acquired 36 nearshore Texas tracts in the Mustang Island and Matagorda Island areas (red blocks at the western end of the map above). Exxon had acquired 163 nearshore Texas tracts (blue in map above) at Sales 257 (94) and 259 (69).
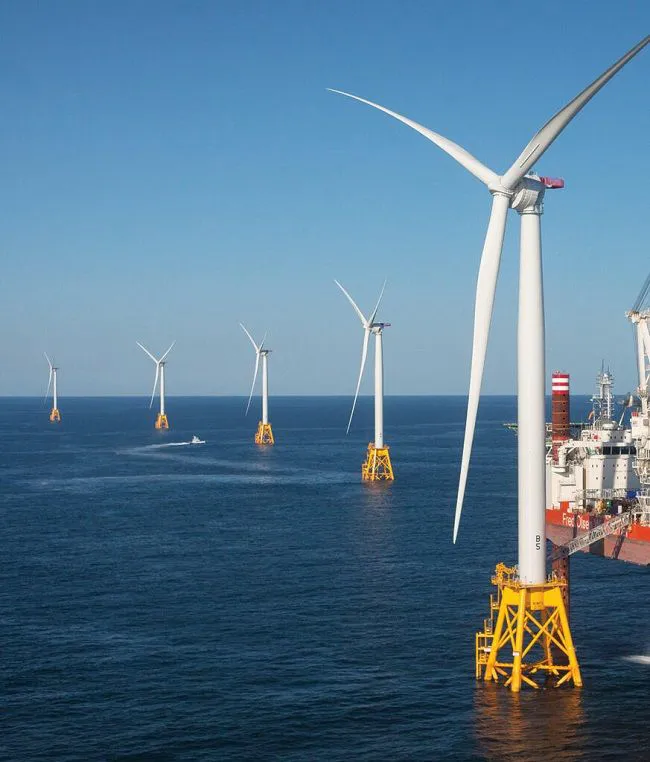
The Town of Nantucket calls on you to help safeguard one of the nation’s most treasured National Historic Landmarks. We ask that you contact the Advisory Council on Historic Preservation (ACHP) and the Massachusetts State Historic Preservation Officer (SHPO) to urge them to decline signing the Section 106 Memorandum of Agreement (MOA) for SouthCoast Wind. Section 106 requires federal agencies to consider the effects on historic properties of projects they carry out, assist, fund, permit, license, or approve throughout the country, and to find ways to avoid, minimize, or mitigate adverse effects on those properties.
Former Dept. of the Interior and House Natural Resources Committee attorney, Jack Coleman, has been elected Mayor of his hometown, Rosedale, Mississippi. Jack is also restoring a historic distillery in Rosedale.
It’s great to see a former colleague making such important social and economic contributions following his “retirement.”
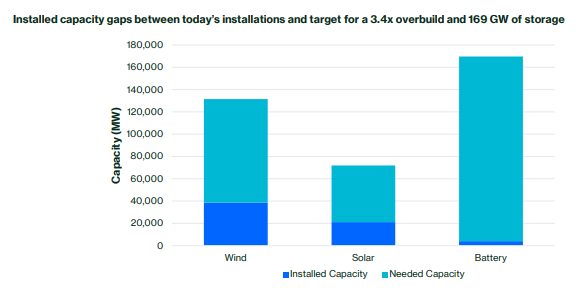
On average, solar produces full power 25% of the time, whereas wind does so 35% of the time.
Without fossil fuels, Texas would need to scale up its wind and solar capacity by 3.4x and energy storage by 42.4x just to meet the average hourly demand.
Despite these high values for renewables and 5 GW of firm nuclear power, the system only meets demand 76% of the time, equivalent to 176 days over the two-year period when generation and storage fall short.
Even with a 5x overbuild and corresponding 10x in storage capacity, only 88% of demand can be fully satisfied, not considering transmission challenges.
Just meeting the average demand, with a 3.4x capacity expansion, would require more than 50,000 km2 of land, equivalent to the size of Lake Michigan.
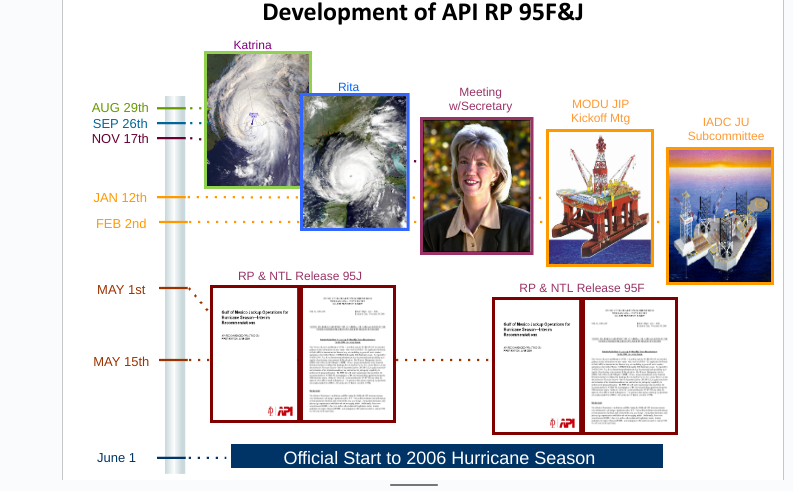
Timeframe for government and industry actions following the 2005 hurricane season.
Optimally, the regulator establishes clear objectives for the operating companies and a schedule for achieving those objectives. This approach was demonstrated with great success following the 2005 hurricane season (Katrina and Rita) when numerous mooring system and other stationkeeping issues were identified.
Minerals Management Service Director Johnnie Burton sent a letter (attachment 1) to industry leaders calling for a face-to-face meeting with Department of the Interior Secretary Gale Norton. The Secretary outlined her concerns and informed offshore operators that there would be no drilling from moored mobile drilling units or jackup rigs during the next hurricane season until the issues identified during Hurricanes Katrina and Rita were addressed.
The collaborative effort that followed was a resounding success (2nd attachment). In addition to addressing station keeping concerns, a comprehensive list of hurricane issues was developed. Industry and government then worked together to assess mitigations and develop new standards and procedures. The essential MODU standards were completed before the 2006 hurricane season, and all of the related concerns were effectively addressed prior to the 2009 hurricane season. Had the government elected to promulgate regulations to address all of these issues, much of this work would have never been completed.