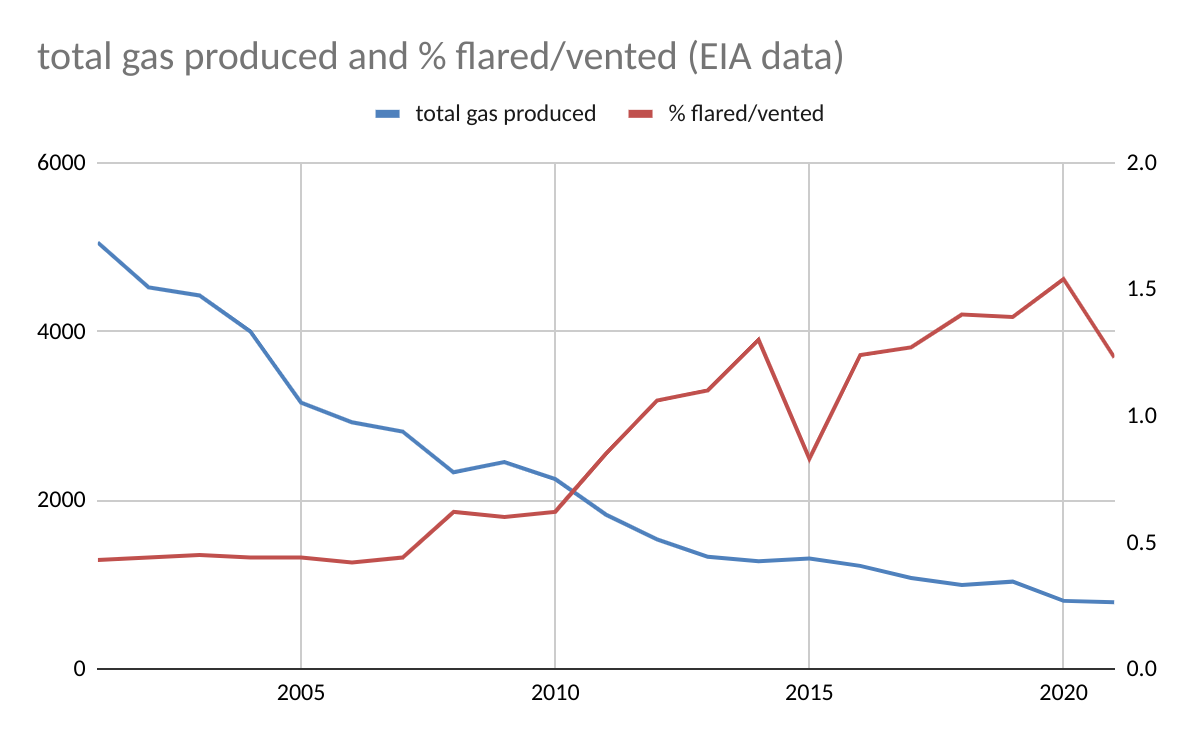
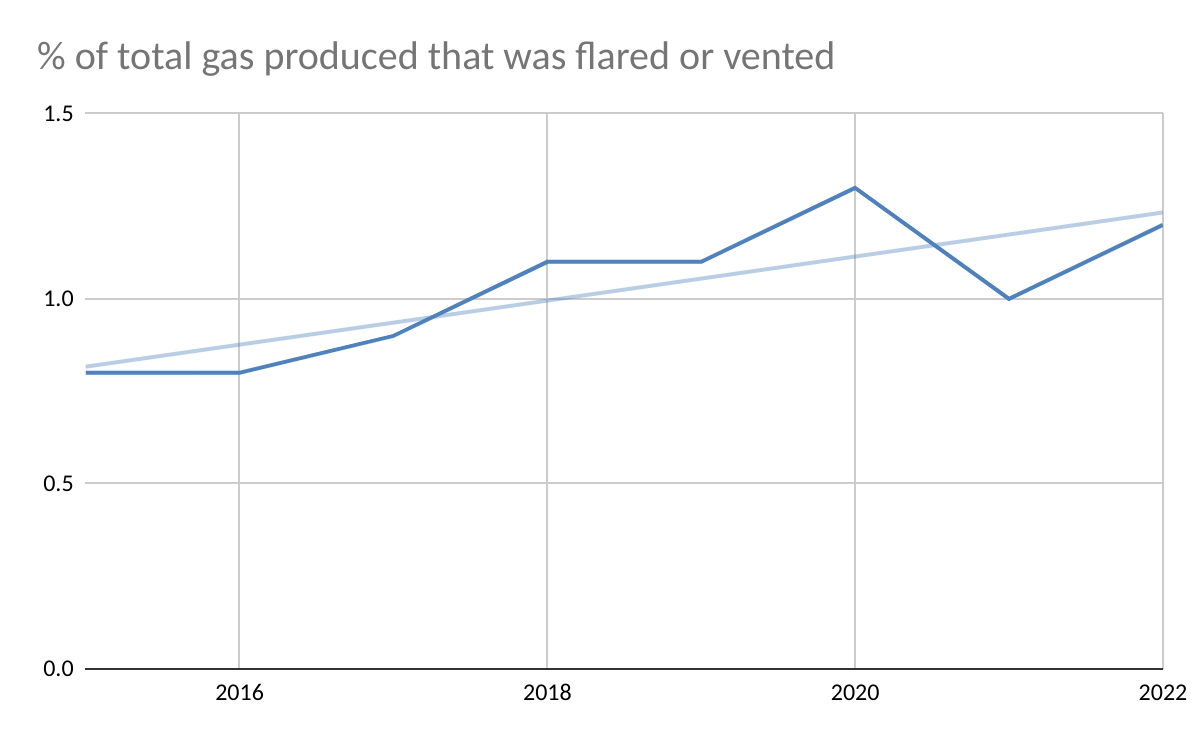
According to EIA data for 2001-2021, Gulf of Mexico flaring and venting volumes peaked in 2001 at 21.6 bcf, 2.25 times the volume flared or vented in 2022 (ONRR data for 2022). However, gas production in 2001 was 5.05 tcf, 6.4 times higher than in 2022. The % of the produced gas that was flared or vented in 2001 was thus 0.4%, less than 1/3 the 2022 rate of 1.22%.
Points to consider:
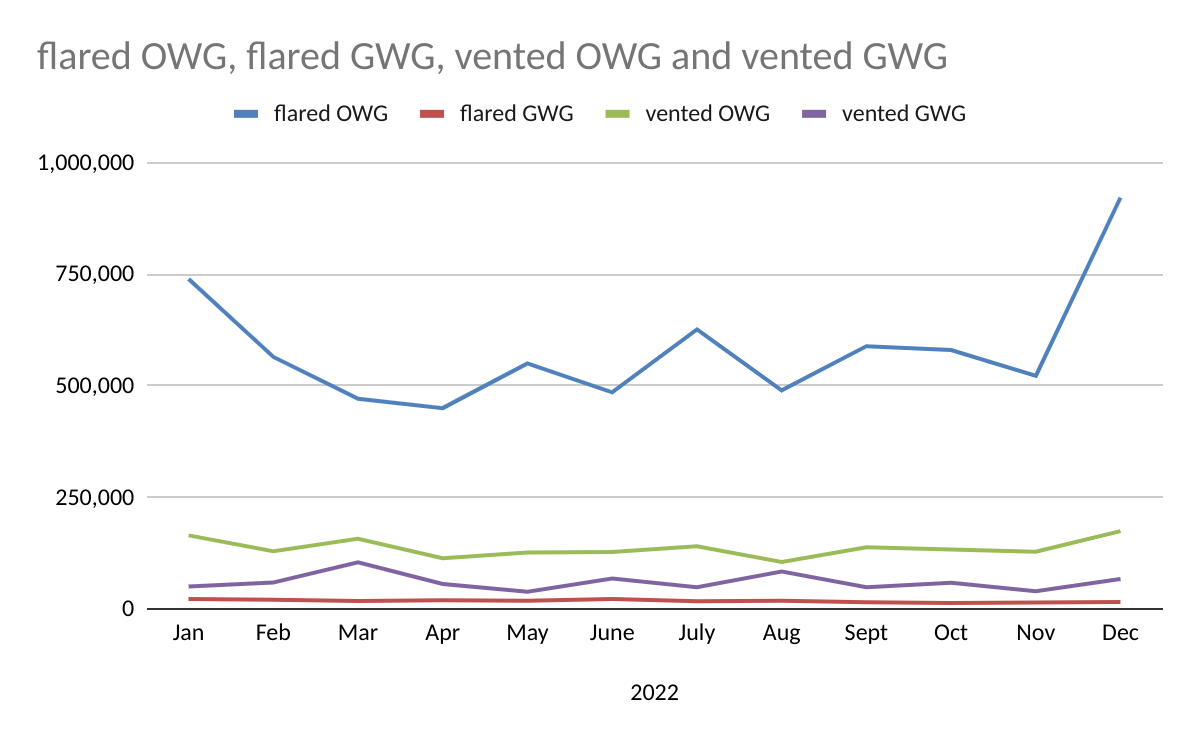
- In 2001, gas production was mostly from gas wells, which have lower flaring/venting rates. As gas production declined because of lower gas-well gas (GWG) production, flaring/venting rates increased (see the chart below). This would account for some of the difference in flaring/venting rates (2001 vs. 2022). However, in recent years, the % of gas-well gas flared or vented has been between 0.3 and 0.5% which is comparable to the rate for all gas production (0.4%) in 2001. So the reduction in GWG production is not the entire reason for the higher flaring/venting rates in recent years. Hence the need for more transparency on flaring/venting performance.
- Oil-well gas (OWG) production alone in 2001 (923 bcf) was higher than total gas production (784 bcf) in 2022. If the oil-well gas (OWG) flaring/venting rate was the same as the recent rate for OWG (1.2-1.5%), the volume of gas flared or vented from OWG alone (only 18% of total gas production in 2001) would have accounted for 11.1 – 13.8 bcf or 51-64% of the total volume flared/vented in 2001.
- Better measurement and reporting in recent years may, of course, be an important consideration. The PNAS paper suggests reporting issues for shelf facilities in recent years, and given the much higher shelf production 20+ years ago, accurate reporting may have been an even more significant issue then. Also, MMS updated the regulations in 2010 to require metering of flared and vented gas at facilities processing >2000 bopd. This has no doubt improved flaring/venting measurement. However, better measurement and reporting does not explain the trend toward higher flaring/venting rates in recent years.
- The differences between EIA and ONRR flaring data need to be resolved.