Posts Tagged ‘EIA’
Gulf of Mexico production held steady in July
Posted in Gulf of Mexico, Offshore Energy - General, tagged EIA, Gulf of Mexico production, July oil production on September 30, 2022| Leave a Comment »
EIA: Record US natural gas consumption in 2022
Posted in energy, natural gas, tagged EIA, record natural gas consumption on September 15, 2022| Leave a Comment »
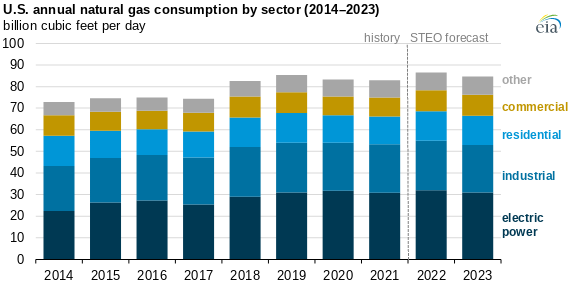
In our September Short-Term Energy Outlook (STEO), we expect natural gas consumption to increase by 3.6 billion cubic feet per day (Bcf/d) in the United States during 2022 to average 86.6 Bcf/d for the year, the most annual U.S. natural gas consumption on record. We forecast that U.S. natural gas consumption will increase in all end-use sectors this year. We expect the U.S. electric power sector to grow by 4% in 2022 to 32.1 Bcf/d, exceeding the 2020 record by 1%, which is the highest growth rate among all sectors.
EIA
Leasing policy and BOEM’s unrealistic Gulf of Mexico production forecast
Posted in climate, energy policy, Gulf of Mexico, Offshore Energy - General, tagged 5 year leasing plan, BOEM forecast, EIA, Gulf of Mexico production on September 1, 2022| Leave a Comment »
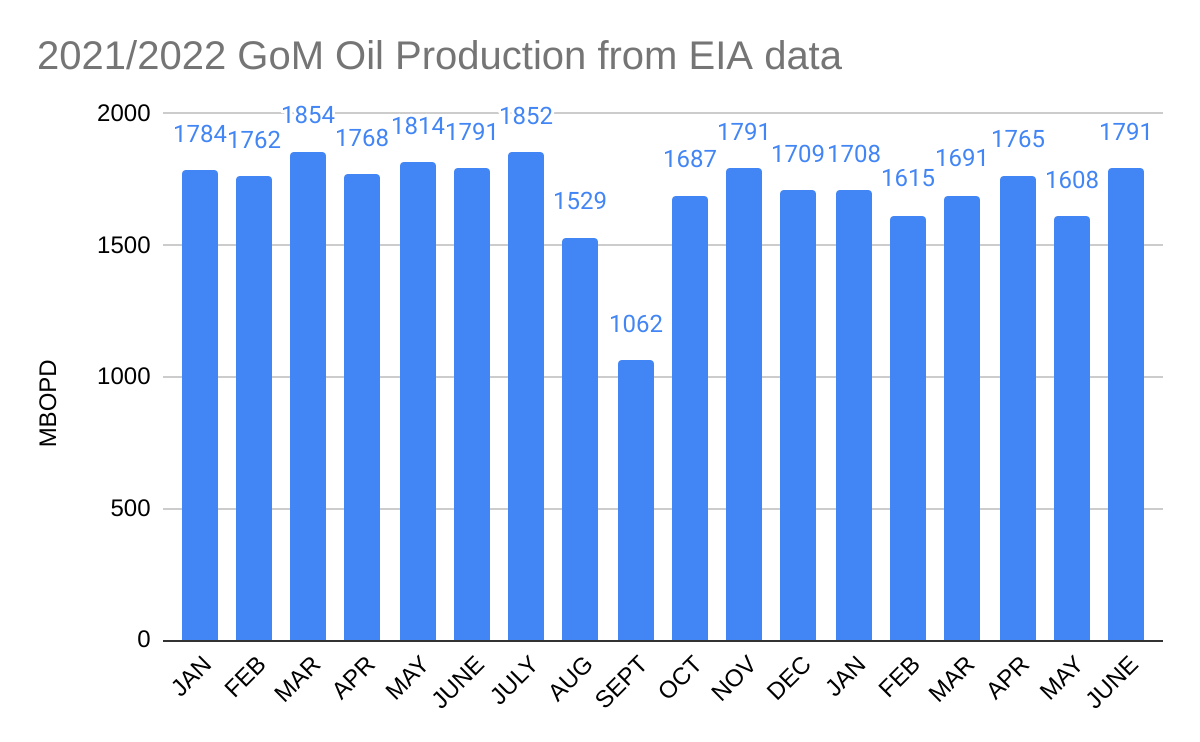
GoM oil production for June increased (see chart below) with King’s Quay and Spruance contributing to the uptick. Other anticipated 2022 startups are not yet producing.
The EIA production forecast for 2022 is proving to be pretty accurate. Kudos to them. However, BOEM’s 2022 forecast of 1.9 million bopd is not achievable and concerns about the intermediate and longer term persist. Unfortunately, BOEM’s highly optimistic forecast for 2022 and beyond, along with unrealistic expectations regarding the energy transition, have significant policy implications. This stunning quote from the 5 year leasing plan explains why so few lease sales were proposed:
“BOEM’s short-term (20-year) production forecast for existing leases shows steady growth from 2022 through 2024 and declining thereafter (see Section 5.2.1). The long-term nature of OCS oil and gas development, such that production on a lease can continue for decades makes consideration of future climate pathways relevant to the Secretary’s determinations with respect to how the OCS leasing program best meets the Nation’s energy needs.“
5 Year Leasing Program, p.3
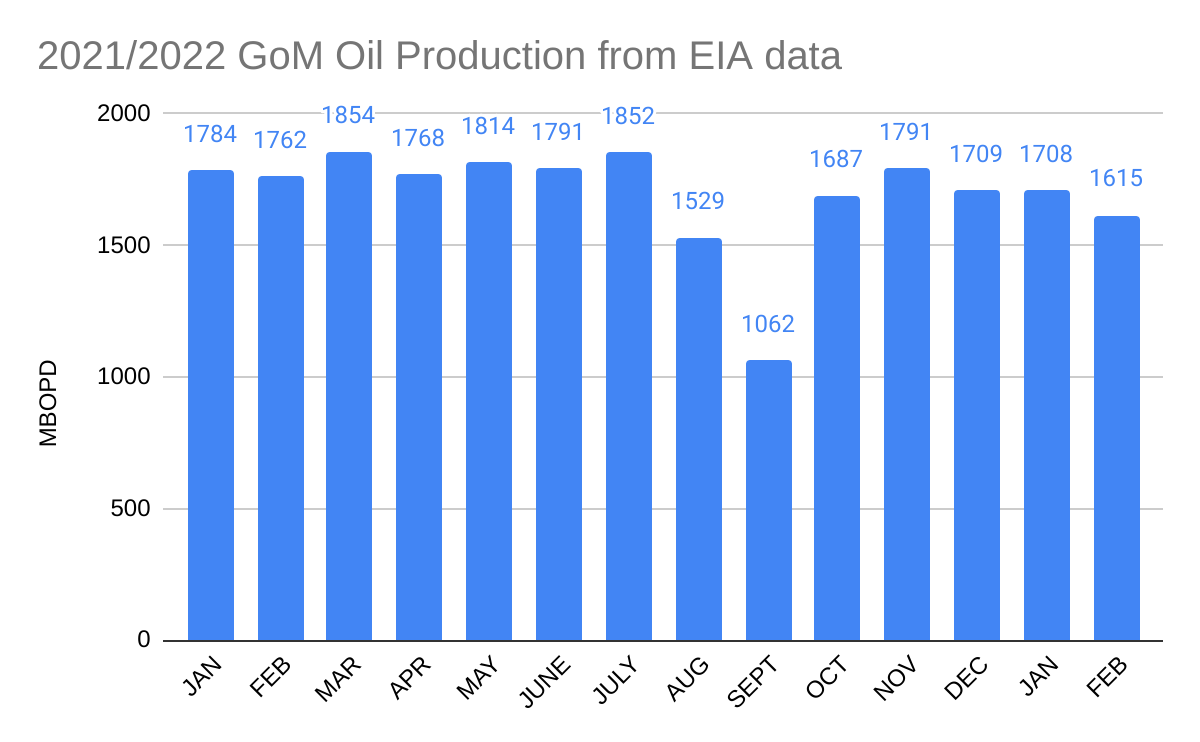
May GoM production slides 9%
Posted in Gulf of Mexico, Offshore Energy - General, tagged EIA, Gulf of Mexico production, production decline on July 29, 2022| Leave a Comment »
If last fall’s Hurricane Ida dip is excluded, the latest production figure in 2021/2022. New projects should boost production over the next 2 years, but not enough to reach the August 2019 peak of 2.044 million bopd.

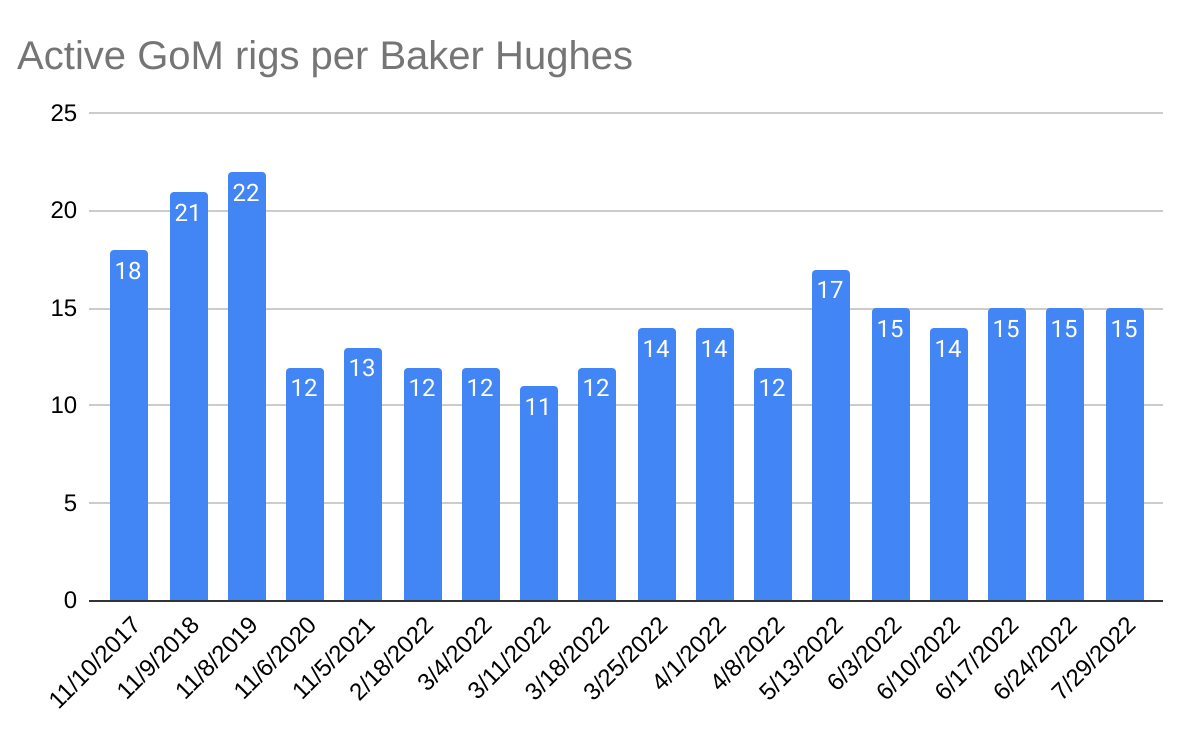
Meanwhile the GoM rig count remains sluggish at 15.
April GoM production, BOEM’s production forecast, and the proposed OCS leasing program
Posted in climate, energy policy, Gulf of Mexico, Offshore Energy - General, tagged 2022 production forecast, 5 year leasing plan, BOEM, EIA, Gulf of Mexico oil production, King's Quay on July 7, 2022| Leave a Comment »
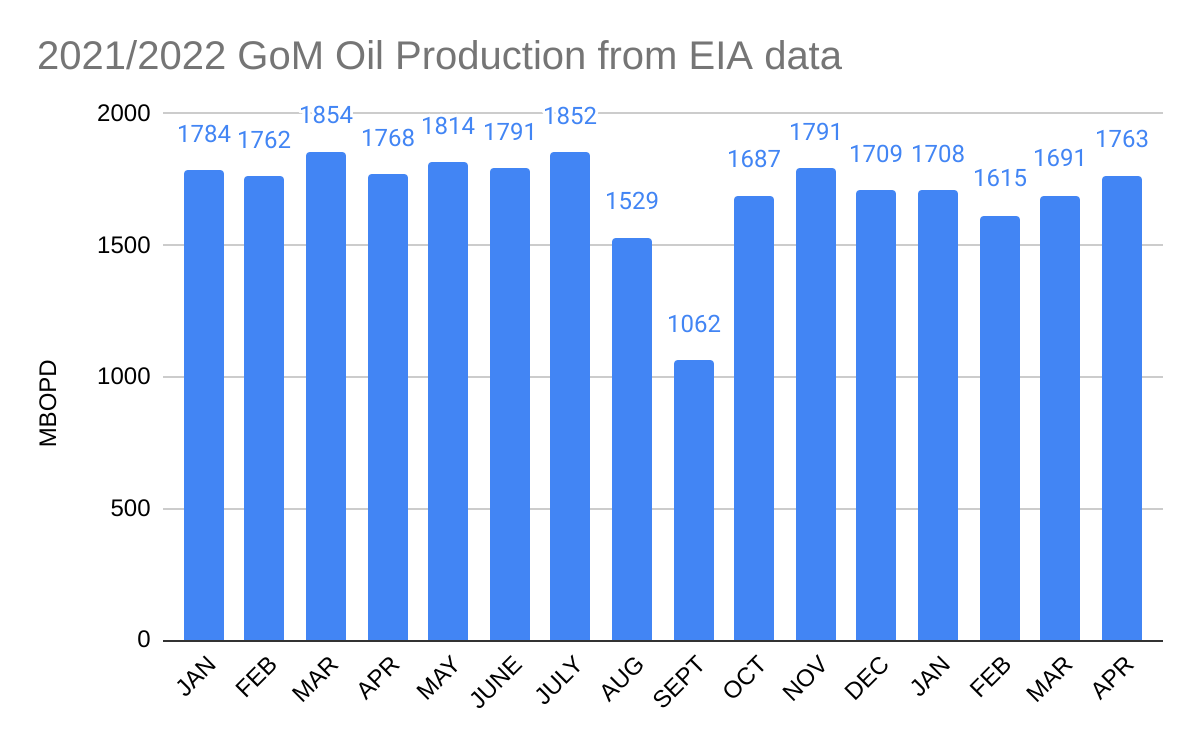
April production increased from March by 72,000 BOPD to 1.763 million BOPD. The increase is associated, at least in part, with Murphy’s King’s Quay field which began producing in early April. 2022 GoM production remains below the levels reached in the first 7 months (pre-Hurricane Ida) of 2021, and is well below BOEM’s forecasted 2022 production rate of 1892 MBOPD. Perhaps BOEM was assuming earlier startup dates for other projects that will begin production later this year or next year. The 2022 YTD dip in production points to the importance of sustained exploration and development.
BOEM’s short-term production forecast is considerably more optimistic than EIA’s. This optimistic forecast, along with unrealistic expectations regarding the “energy transition” are reasons for proposing so few lease sales in the new 5 year leasing program. The logic for this minimalist leasing program seems to be that future production is neither necessary nor desirable. Indeed the program implies that the long-term nature of offshore production is a liability and is justification for limiting OCS oil and gas leasing:
“BOEM’s short-term (20-year) production forecast for existing leases shows steady growth from 2022 through 2024 and declining thereafter (see Section 5.2.1). The long-term nature of OCS oil and gas development, such that production on a lease can continue for decades makes consideration of future climate pathways relevant to the Secretary’s determinations with respect to how the OCS leasing program best meets the Nation’s energy needs.“
5 Year Leasing Program, p.3
Basing leasing decisions on “future climate pathways” would seem to be a considerable stretch of the Secretary’s authority under the OCS Lands Act and may be inconsistent with the recent SCOTUS decision in West Virginia vs. EPA. A strategic shutdown of the offshore oil and gas program would dramatically increase energy supply and security risks going forward, and should be authorized by Congress.
EIA: Fossil fuel sources accounted for 79% of U.S. consumption of primary energy in 2021
Posted in climate, energy policy, Offshore Energy - General, tagged 5 year leasing plan, Daniel Yergin, DOI, EIA, fossil fuel consumption, IEA on July 5, 2022| Leave a Comment »
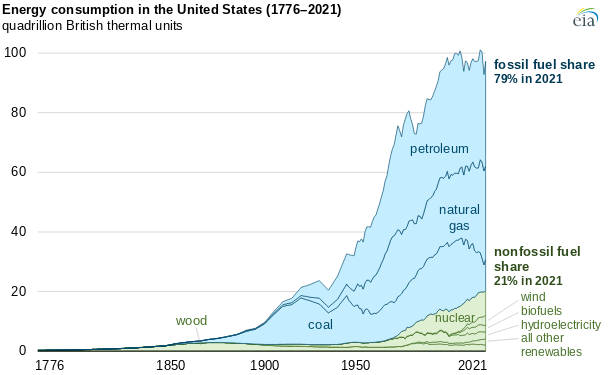
Yet the proposed 5 Year OCS leasing program (p. 3) tells us that long term offshore production is not needed because the IEA’s “roadmap to net-zero emissions by 2050 for the global energy sector would require no new investment in fossil fuel supply projects (IEA 2021).”
Does the IEA dictate US energy policy? Dan Yergin has a far better grasp on the realities of energy consumption and transitions.
“Oil, discovered in 1859, did not surpass coal as the world’s primary energy source until the 1960s, yet today the world uses almost three times as much coal as it did in the ’60s.“
EIA production reports continue to be delayed due to “systems issues”
Posted in energy, Gulf of Mexico, Offshore Energy - General, tagged EIA, Gulf of Mexico production, systems issues on July 2, 2022| Leave a Comment »
The April oil production figure for the Gulf of Mexico has thus not yet been released.
These ongoing issues must be rather embarrassing for a data driven agency.
EIA GoM forecast points to the importance of new production
Posted in energy policy, Gulf of Mexico, Offshore Energy - General, tagged 5 year leasing plan, EIA, Gulf of Mexico production, IER on June 30, 2022| Leave a Comment »
Leasing shutdowns have consequences. See the IER article, and the post below regarding the importance of new production, which is dependent on consistent leasing and exploration programs. Will the proposed leasing plan be issued today as promised?
“According to EIA, declining production from existing Gulf of Mexico fields will largely offset the increases in oil production from the new fields, with natural gas production in the Gulf of Mexico continuing its three-year decline. During 2021, 15 percent of U.S. oil production and 2 percent of U.S. natural gas production was produced in the Gulf of Mexico.”
IER
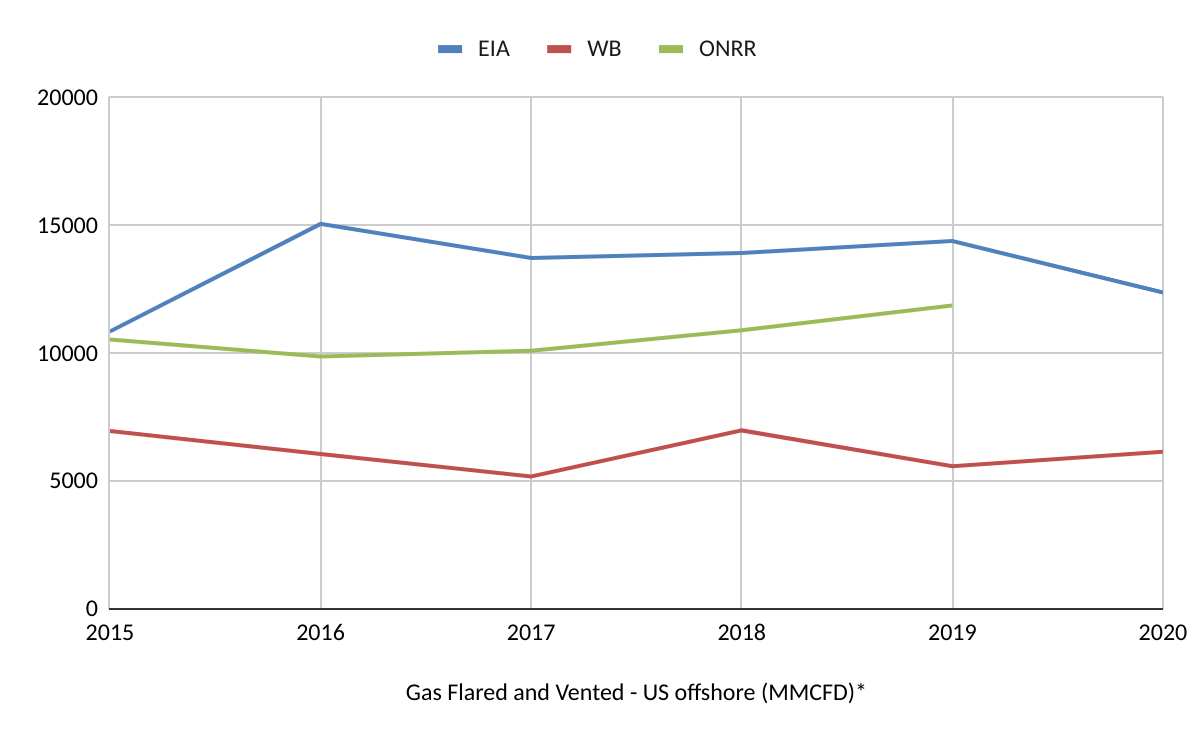
Gulf of Mexico flaring data sets don’t match
Posted in climate, Gulf of Mexico, natural gas, Offshore Energy - General, tagged Argonne, BSEE, EIA, flaring data, Gulf of Mexico, ONRR, UMich, venting, World Bank on May 5, 2022| Leave a Comment »
Given the importance of flaring and venting from both environmental and resource conservation standpoints, accurate and reliable data are necessary and should be readily available to the public. ONRR has advised me that they will begin posting flaring and venting data on their website within 2 months. This is a positive step. Currently, data from the 3 primary sources differ considerably.
Data Sources:
- US Energy Information Administration (EIA): Per EIA, their flaring and venting data are received directly from the Bureau of Safety and Environmental Enforcement (BSEE).
- Office of Natural Resources Revenue: ONRR is a sister bureau of BSEE within the Department of the Interior. Per BSEE regulations, all flared or vented gas must be reported to ONRR. As noted above, ONRR will begin regularly posting flaring and venting data within the next 2 months. This is a most welcome and positive step and may help address these inconsistency issues.
- World Bank Global Gas Flaring Reduction Partnership: “a multi-donor trust fund composed of governments, oil companies, and multilateral organizations committed to ending routine gas flaring at oil production sites across the world.”
Comments:
- The EIA (from BSEE) and ONRR flaring/venting numbers should be the same given that the ONRR data are reported in accordance with BSEE regulations, and BSEE is presumably providing ONRR data to EIA. This needs to be clarified.
- The World Bank’s gas flaring estimates are based on observations from satellites. This explains their lower numbers given that vented gas would not be detected and some flares might be missed.
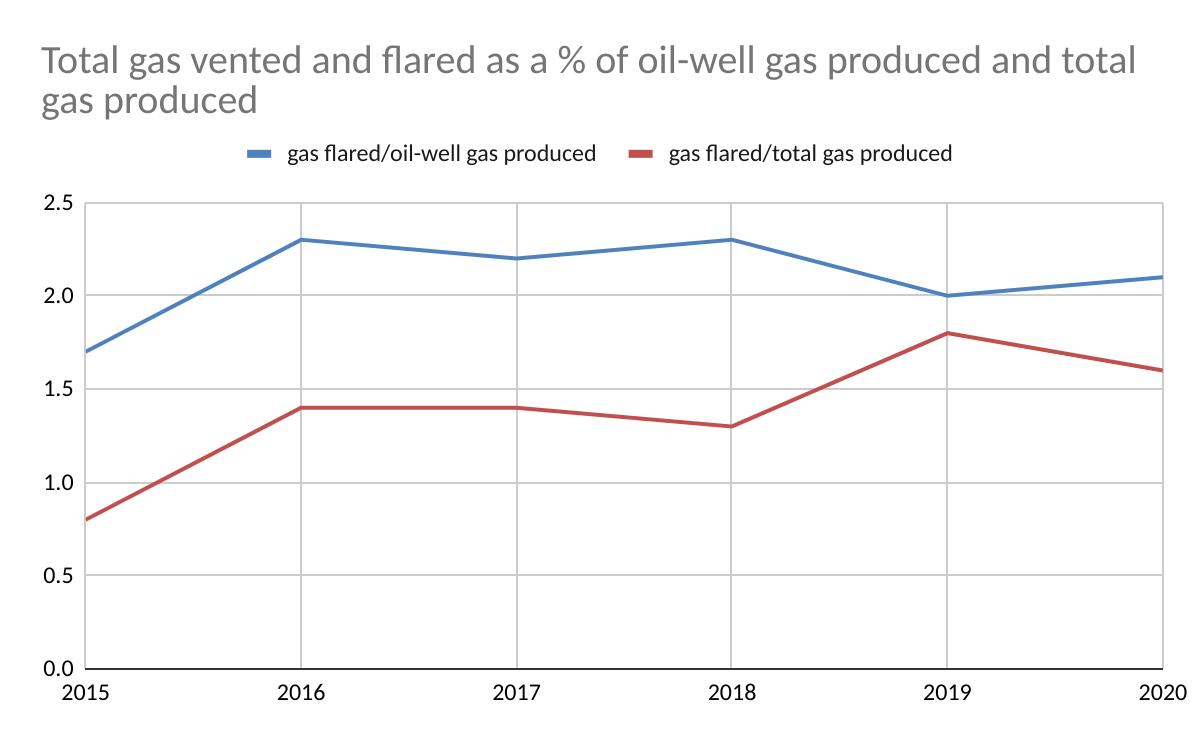
- In a 1/2021 interview with World Oil, the exiting BSEE Director commented that the “industry has consistently achieved a ratio of less than 1.25% of flared, vented gas to produced gas.” However, based on EIA flaring and venting data (from BSEE per EIA) and EIA gas production data, the volume of gas flared/vented exceeded 1.25% of the gas produced from 2016-2020 and was as high as 1.8% in 2019. (See the chart below.) Even if the lower ONRR flaring/venting totals are used, those volumes exceeded 1.25% in 2019 (1.5%).
- BSEE/ONRR should make more detailed flaring/venting data available so that the differences between facilities and sectors (e.g. deepwater vs. shelf) could be assessed. Efforts should also be made to post these data in a more timely manner. At this time, 2021 data are still not available.
Reports of interest:
- Argonne report for BSEE (2017):
- p. 17 – “The 2015 BSEE/BOEM study on reducing methane emissions observed that “while natural gas production has declined, …vented and flared gas volumes as a percentage of produced natural gas are increasing” and noted that additional investigation is needed to determine why.” This is consistent with my observations and is probably due in large part to the fact that most gas production is now from oil-wells (e.g. associated gas).
- p. 24 – “Argonne estimates, in 2015, platform startups for deep-water floating structures accounted for roughly 15% of the total annual flaring volume on the OCS and an additional 20% of the annual total resulted from monthly spikes associated with compressor outage, pipeline maintenance, and well-unloading.”
- Univ. of Michigan study (2020): “Large, older facilities situated in shallow waters tended to produce episodic, disproportionally high spikes of methane emissions. These facilities, which have more than seven platforms apiece, contribute to nearly 40% of emissions, yet consist of less than 1% of total platforms.”
EIA posts a surprising dip in Feb. Gulf of Mexico oil production
Posted in Gulf of Mexico, Offshore Energy - General, tagged EIA, Gulf of Mexico production on April 29, 2022| Leave a Comment »