The streak of unprecedented Gulf of Mexico oil production stability was extended to 7 months in August.
As a result of shut-ins for Tropical Storms Francine and Helene, the streak will end when the production for Sept. is posted.
Posted in Gulf of Mexico, hurricanes, Offshore Energy - General, tagged August production, Gulf of Mexico, Hurricane Francine, Hurricane Helene, oil production, stability on October 31, 2024| Leave a Comment »
The streak of unprecedented Gulf of Mexico oil production stability was extended to 7 months in August.
As a result of shut-ins for Tropical Storms Francine and Helene, the streak will end when the production for Sept. is posted.
Posted in CCS, climate, energy policy, Gulf of Mexico, Regulation, tagged BOEM, carbon disposal, CCS regulations, Exxon, Gulf of Mexico, opposition to CCS, Repsol on October 10, 2024| Leave a Comment »
Despite false starts by Exxon and Repsol (see above summary), no carbon sequestration (disposal) leases may be issued or developed until implementing regulations have been promulgated. In that regard, no news is good news for those who are less than enamored with CO2 disposal in the Gulf of Mexico.
The implementing regulations will be controversial. Most operating companies prioritize GoM production over GoM disposal. Most environmental organizations are strongly opposed to CO2 disposal schemes that sustain fossil fuel production and benefit fossil fuel producers. Taxpayers are leery of subsidizing these projects and absorbing increased costs for energy and consumer goods.
The Administration is, of course, well aware of this opposition and will not be publishing implementing regulations prior to the election. The next Administration, regardless of the election outcome, will no doubt take a hard look at these issues before proposing regulations.
The few oil and gas producers that are rather cynically hoping to cash in on CO2 disposal in the GoM will therefore have to wait, perhaps for a long time.
Posted in Gulf of Mexico, Offshore Energy - General, tagged 2024 data, Gulf of Mexico, Hurricane Francine, Hurricane Helene, oil production, stability on October 3, 2024| Leave a Comment »
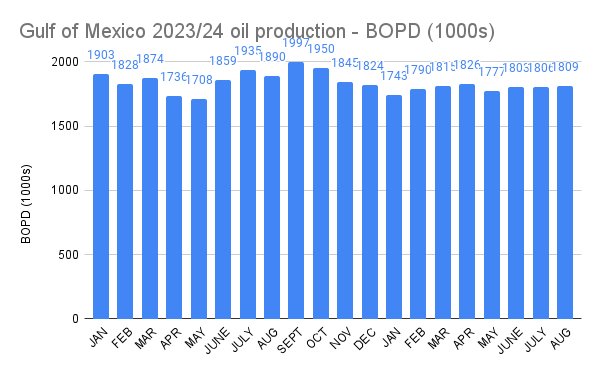
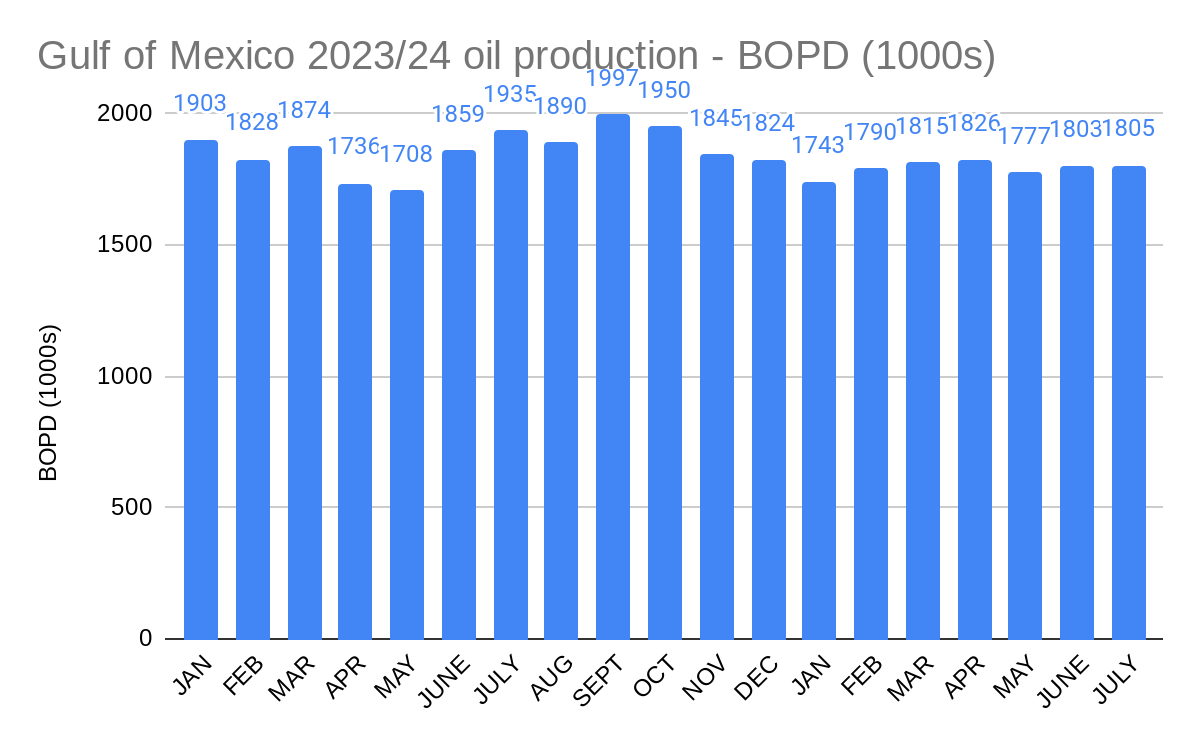
The stability in Gulf of Mexico oil production rates, as noted when the data for June were released, continued into July. Oil production once again remained remarkably consistent at 1.8 million bopd.
Average daily production was within 1.4% of 1.8 million bopd for each month from February to July. As previously observed, this is as stable as production has been for any 6 month period in the past 10 years. I’m not sure this observation is terribly significant, but it’s interesting nonetheless. 😀
If the streak didn’t end in August, it most certainly did in September given the shut-ins for Hurricanes Francine and Helene.
Posted in Gulf of Mexico, hurricanes, Offshore Energy - General, tagged evacuations, Gulf of Mexico, Hurricane Helene, production shut-in on September 29, 2024| Leave a Comment »
Update: BSEE reports that as of 9/29/2024, essentially all production had been restored.
As of 9/28, 210,000 BOPD remained shut-in with only 4 platforms still evacuated. Presumably, production had not resumed (or had only partially resumed) on some high rate deepwater platforms.
BSEE shut-in, evacuation, and relocation data in the table below are as of 12:30 p.m. ET on the specified date.
| date | 9/24 | 9/25 | 9/26 | 9/27 | 9/28 |
| oil s.i.(BOPD) % of total | 284,000 16.21 | 511,000 29.18 | 441,923 25.25 | 427,000 24.39 | 210,000 12 |
| gas s.i.(MMCFD) % of total | 208 11.2 | 313 16.85 | 363.39 19.81 | 343 18.46 | 112 6.04 |
| platform evacs % of total | 4 1.08 | 17 4.58 | 27 7.28 | 9 2.43 | 4 1.08 |
| rig evacs % of total | 0 0 | 1 20 | 1 20 | 0 | 0 |
| DP rigs moved % of total | 2 9.5 | 3 14.3 | 3 14.3 | 1 4.76 | 1 4.76 |
Posted in Gulf of Mexico, hurricanes, Offshore Energy - General, tagged evacuations, Gulf of Mexico, Hurricane Francine, production shut-in on September 16, 2024| Leave a Comment »
BSEE data as of 12:30 p.m. ET on the specified date. Peak figures highlighted.
| date | 9/10 | 9/11 | 9/12 | 9/13 | 9/14 | 9/15 | 9/16 |
| oil s.i.(BOPD) % of total | 412,070 23.55 | 674,833 38.56 | 730,472 41.74 | 732,316 41.85 | 522,233 29.84 | 338,690 19.35 | 213,204 12.18 |
| gas s.i.(MMCFD) % of total | 494 25.56 | 904 48.77 | 991.7 53.32 | 973.2 52.3 | 755 40.6 | 514.8 27.64 | 298 16.02 |
| platform evacs % of total | 130 35 | 171 46 | 169 45.55 | 144 31.81 | 52 14 | 37 10 | 24 6.47 |
| rig evacs % of total | 2 40 | 3 60 | 3 60 | 2 40 | 0 0 | 0 0 | 0 |
| DP rigs moved % of total | 3 15 | 4 20 | 2 10 | 2 10 | 2 10 | 2 10 | 0 |
Posted in Gulf of Mexico, hurricanes, Offshore Energy - General, tagged evacuations, Gulf of Mexico, Hurricane Francine, production shut-in on September 15, 2024| Leave a Comment »
BSEE data as of 12:30 p.m. ET on the specified date.
| date | 9/10 | 9/11 | 9/12 | 9/13 | 9/14 | 9/15 |
| oil s.i.(BOPD) % of total | 412,070 23.55 | 674,833 38.56 | 730,472 41.74 | 732,316 41.85 | 522,233 29.84 | 338,690 19.35 |
| gas s.i.(MMCFD) % of total | 494 25.56 | 904 48.77 | 991.68 53.32 | 973.2 52.3 | 755 40.6 | 514.8 27.64 |
| platform evacs % of total | 130 35 | 171 46 | 169 45.55 | 144 31.81 | 52 14 | 37 10 |
| rig evacs % of total | 2 40 | 3 60 | 3 60 | 2 40 | 0 0 | 0 0 |
| DP rigs moved % of total | 3 15 | 4 20 | 2 10 | 2 10 | 2 10 | 2 10 |
Posted in Gulf of Mexico, hurricanes, Offshore Energy - General, tagged evacuation, Gulf of Mexico, Hurricane Francine, production shut-in on September 14, 2024| Leave a Comment »
BSEE data as of 12:30 p.m. ET on the specified date.
| date | 9/10 | 9/11 | 9/12 | 9/13 | 9/14 |
| oil shut-in (BOPD) % of total | 412,070 23.55 | 674,833 38.56 | 730,472 41.74 | 732,316 41.85 | 522,233 29.84 |
| gas s.i. (MMCFD) % of total | 494 25.56 | 904 48.77 | 991.68 53.32 | 973.2 52.3 | 755 40.6 |
| platforms evacuated % of total | 130 35 | 171 46 | 169 45.55 | 144 31.81 | 52 14% |
| rigs evacuated % of total | 2 40 | 3 60 | 3 60 | 2 40 | 0 0 |
| DP rigs moved % of total | 3 15 | 4 20 | 2 10 | 2 10 | 2 10 |
Posted in Gulf of Mexico, hurricanes, Offshore Energy - General, tagged evacuations, Gulf of Mexico, Hurricane Francine, shut-in production on September 13, 2024| Leave a Comment »
BSEE data as of 12:30 p.m. ET on the specified date.
| date | 9/10 | 9/11 | 9/12 | 9/13 |
| oil shut-in (BOPD) % of total | 412,070 23.55 | 674,833 38.56 | 730,472 41.74 | 732,316 41.85 |
| gas s.i. (MMCFD) % of total | 494 25.56 | 904 48.77 | 991.68 53.32 | 973.2 52.3 |
| platforms evac. % of total | 130 35 | 171 46 | 169 45.55 | 144 31.81 |
| rigs evacuated % of total | 2 40 | 3 60 | 3 60 | 2 40 |
| DP rigs moved % of total | 3 15 | 4 20 | 2 10 | 2 10 |
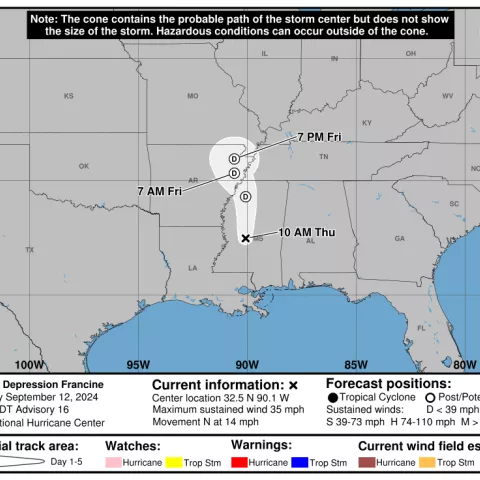
Posted in energy, Gulf of Mexico, hurricanes, Offshore Energy - General, tagged evacuations, Gulf of Mexico, Hurricane Francine, production shut-in on September 12, 2024| Leave a Comment »
BSEE data for the past 3 days are tabulated below. Data are as of 12:30 p.m. ET on the specified date. Barring offshore or downstream infrastructure damage, production should begin to resume over the next few days.
Prior to the shale boom, when our national production was lower and the OCS accounted for a larger share, these numbers would have had a more significant effect on oil and gas prices. That is not the case today with only a 2.4% rise in WTI prices.
| date | 9/10 | 9/11 | 9/12 |
| oil shut-in (BOPD) % of total | 412,070 23.55 | 674,833 38.56 | 730,472 41.74 |
| gas s.i. (MMCFD) % of total | 494 25.56 | 904 48.77 | 991.68 53.32 |
| platforms evac. % of total | 130 35 | 171 46 | 169 45.55 |
| rigs evacuated % of total | 2 40 | 3 60 | 3 60 |
| DP rigs moved % of total | 3 15 | 4 20 | 2 10 |
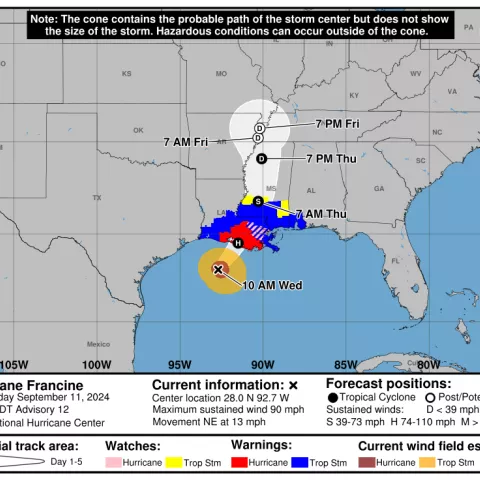
Posted in energy, Gulf of Mexico, hurricanes, tagged Gulf of Mexico, Hurricane Francine, production shut-in on September 11, 2024| Leave a Comment »
As of 12:30 pm ET on 9/11/2024, nearly 40% of the oil and half of the gas production was shut-in.
| Total Shut-in (Percentage of GOM Production) | ||
| Oil, BOPD Shut-in | 674,833 BOPD | 38.56 % |
| Gas, MMCFD Shut-in | 907 MMCFD | 48.77 % |
| Evacuations and rig movements | total | % of GOM |
| Platforms Evacuated | 171 | 46% |
| Rigs Evacuated (non DP) | 3 | 60% |
| DP Rigs Moved-off | 4 | 20% |