World Bank flaring data have some limitations as discussed in a previous BOE post. However, they provide an objective means of estimating and comparing flaring volumes worldwide, and therefore merit close attention.
The latest World Bank data tell us that significant gas flaring issues persist. Worldwide, 138,549 million m3 of gas were flared in 2022. This equates to a massive 4 tcf, the equivalent of the reserves in a major gas field and more than 5 times the total gas production in the Gulf of Mexico in 2022.
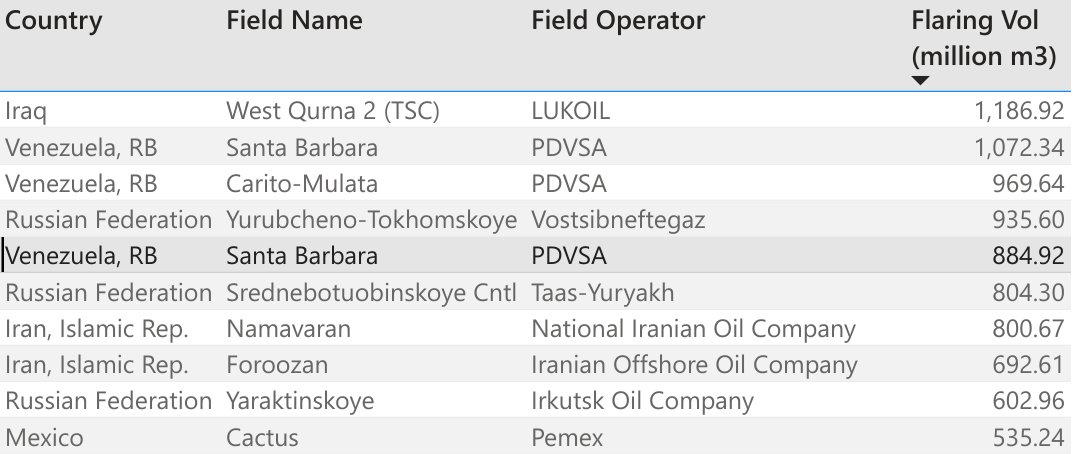
The top ten “flarers” are listed below. Each of these fields flared from 19 to 42 bcf. For comparison, the top ten GoM gas producers in 2022 produced 10 to 57 bcf, so single fields are flaring more than GoM companies are producing in total. Assuming for discussion purposes a gas-oil ratio of 1000 cu ft/bbl, all of the gas associated with 19 million to 42 million barrels of oil production was wasted from each field.
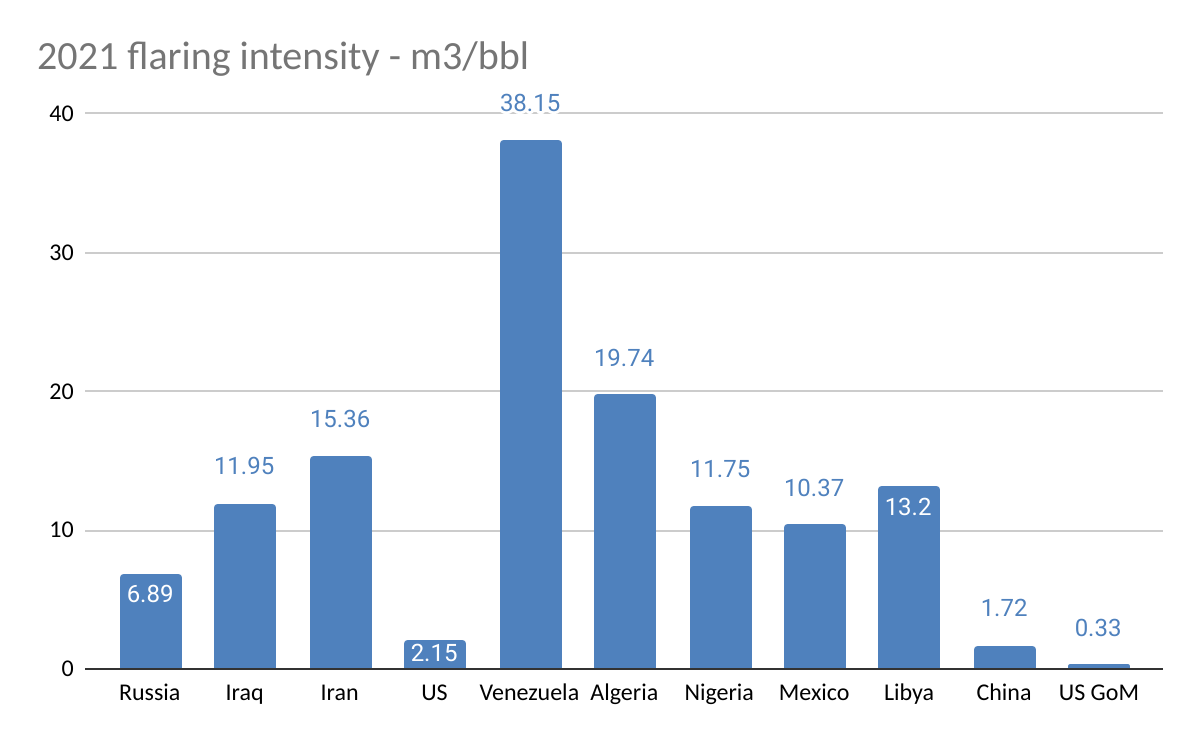
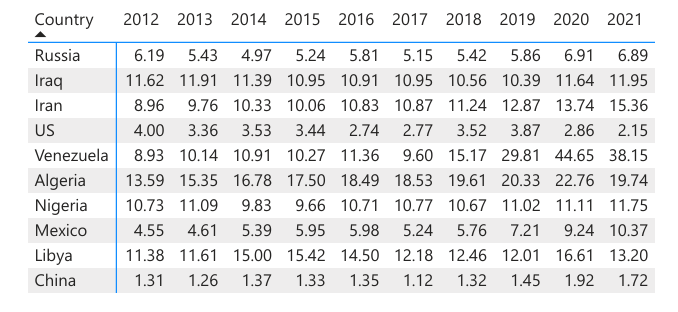
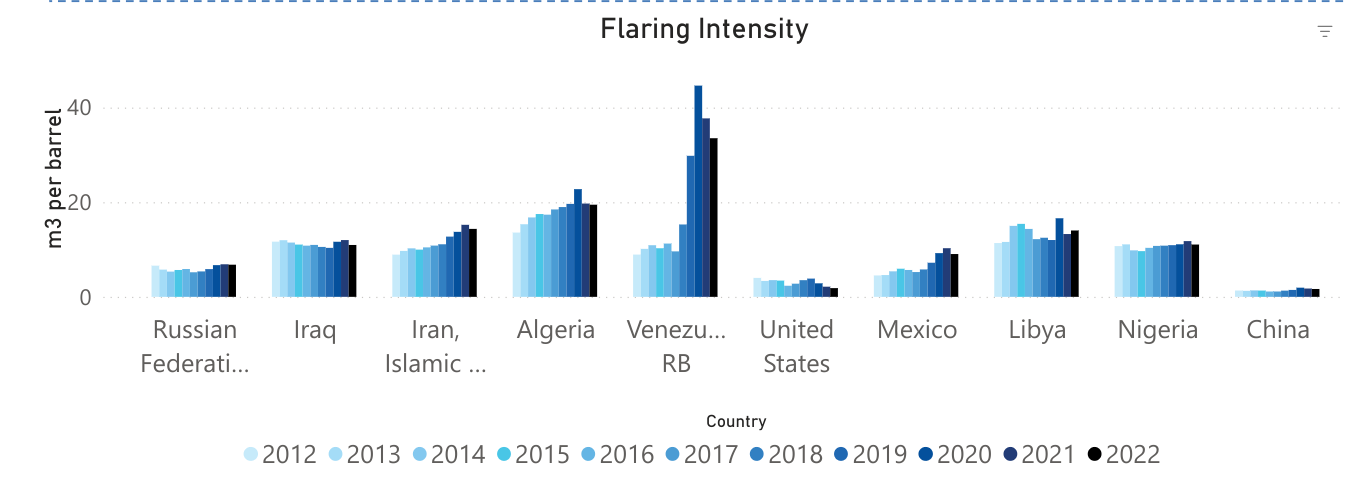
Posted below are the World Bank’s flaring intensity data (m3 of gas flared per bbl of oil produced) for the 10 countries with the highest flaring volumes. Venezuela’s flaring intensity rose to 44.6 m3/bbl in 2020, before declining moderately the following 2 years. 44.6 m3/bbl equates to 1575 cu ft/bbl. This gas flaring to oil production ratio implies that a very high percentage of Venezuela’s associated gas production was flared.
Here in North America, we have flaring issues of our own. Mexico’s Cactus Field is a top ten flarer (first table above) with 534.5 million m3 flared in 2022. The World Bank also lists 6 Permian Basin fields with >50 million m3 of gas flared in 2022.
Zeroing in on the US/Canada offshore sectors, fields with >1 million m3 of gas flared (2022) are listed below. Four of the top 7 are offshore Alaska and Newfoundland where the gas cannot currently be marketed and reinjection, field use, and flaring are the only options. Can production from these fields be better managed to reduce flaring volumes?
| field | operator | m3 (millions) | f3 (millions) |
| White Rose (Nfld) | Cenovus | 41.69 | 1472 |
| Hibernia (Nfld) | HMDC | 40.99 | 1448 |
| Shenzi | BHP | 31.34 | 1107 |
| Northstar (AK) | Hilcorp | 11.23 | 397 |
| Constitution | Oxy | 10.76 | 380 |
| Pompano | Talos | 10.54 | 372 |
| Endicott (AK) | Hilcorp | 10.07 | 356 |
| Ursa | Shell | 8.19 | 289 |
| Marmalard | Murphy | 6.62 | 234 |
| Lucius | Oxy | 3.09 | 109 |
| Marlin | Oxy | 3.08 | 109 |
| Mars | Shell | 2.2 | 78 |
| Holstein | Oxy | 1.48 | 52 |
The extraordinary 1.1 bcf of gas that was flared at the Shenzi field may help explain the large (1 bcf) increase in oil well gas flaring in the Gulf of Mexico in 2022. Based on the World Bank data and ONRR data for the GoM, Shenzi accounted for 16% of GoM oil-well gas flaring in 2022. As noted in that post, more regulator/industry transparency on lease and field specific flaring is needed. ONRR’s posting of flaring and venting data is a positive step, but it doesn’t include lease specific data and doesn’t explain major flaring episodes.