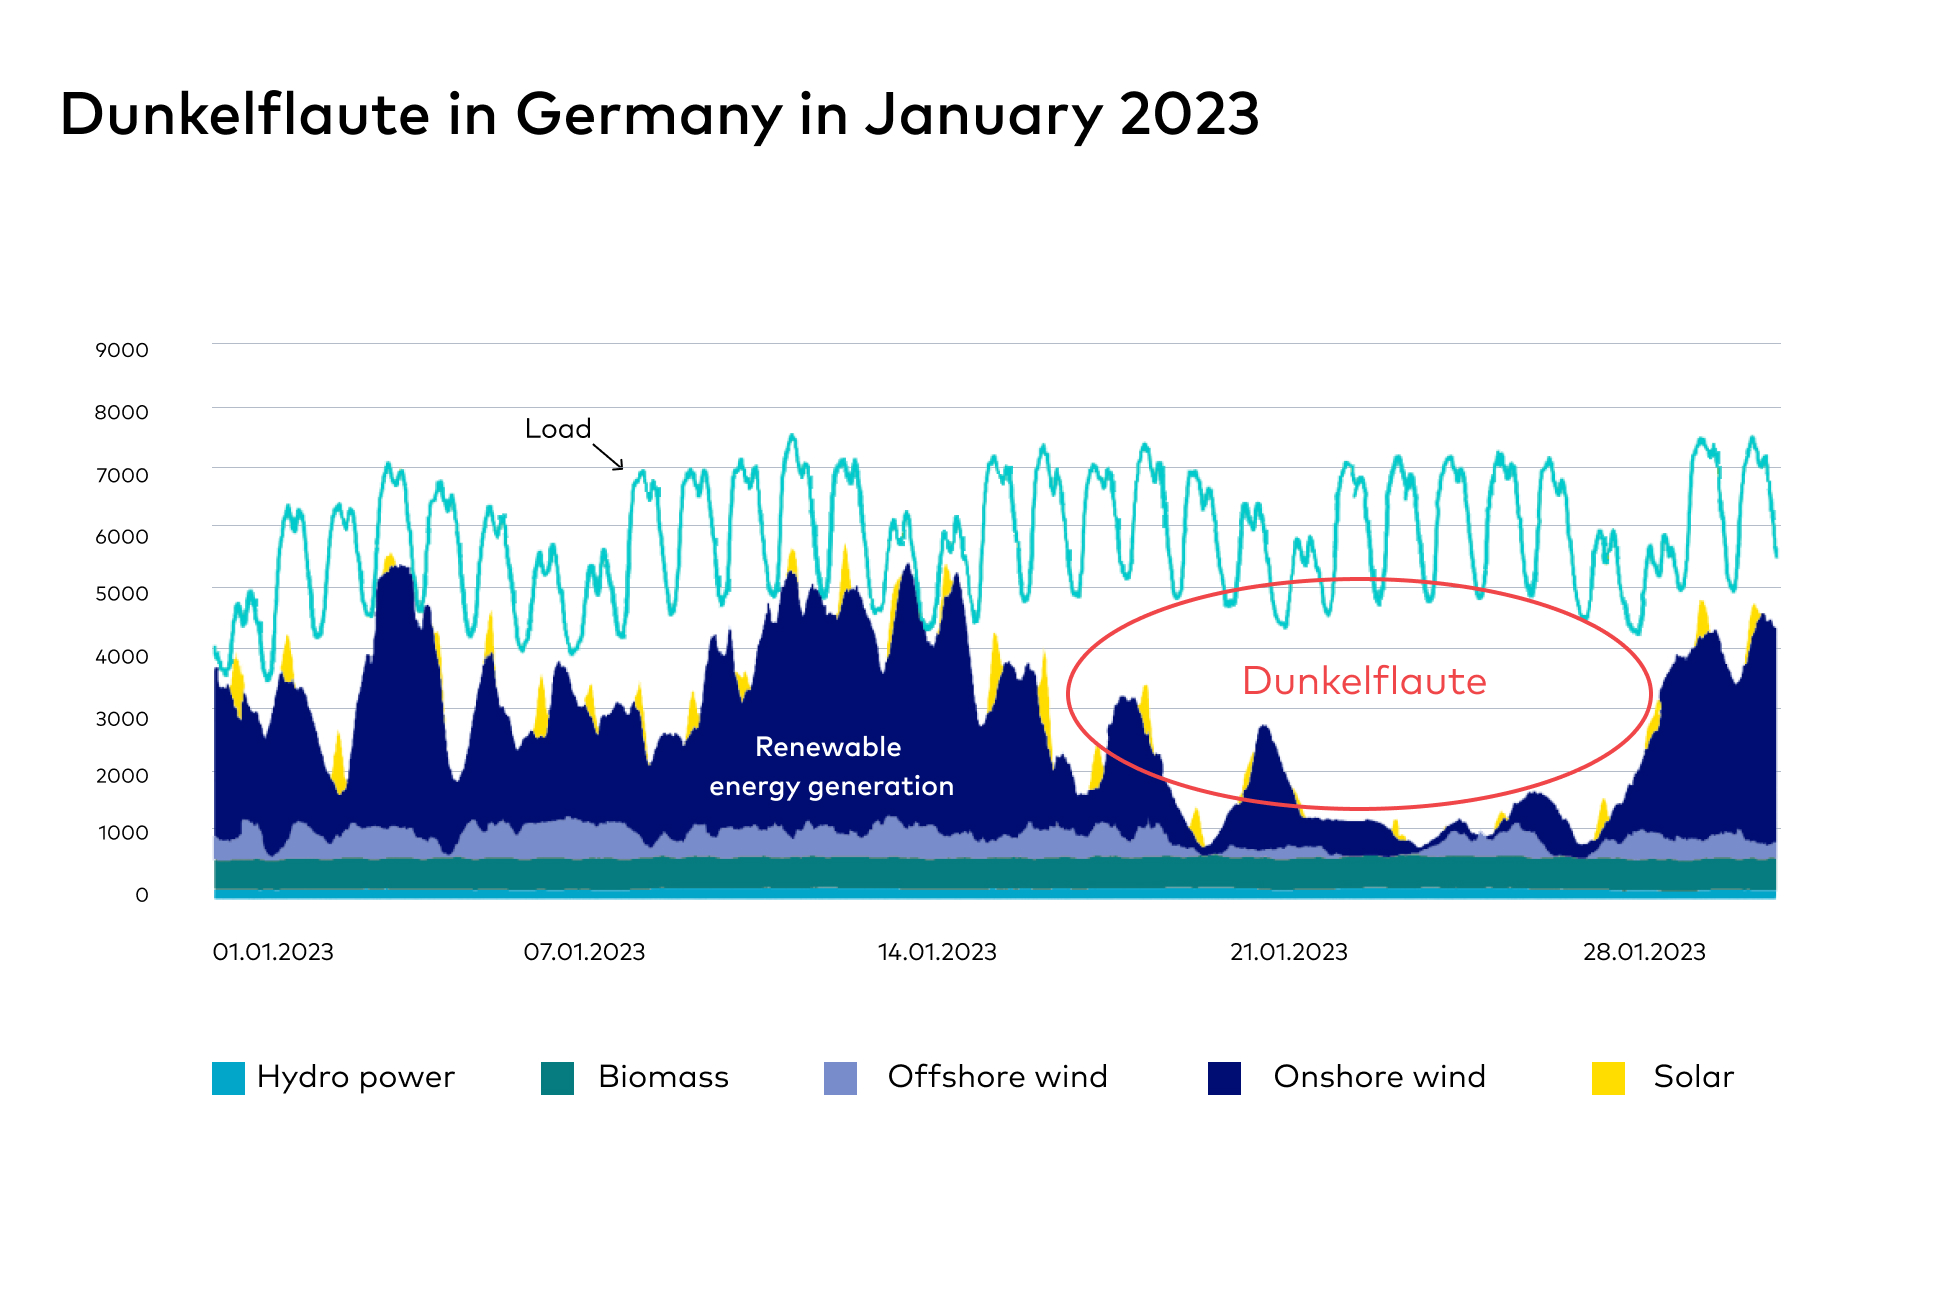
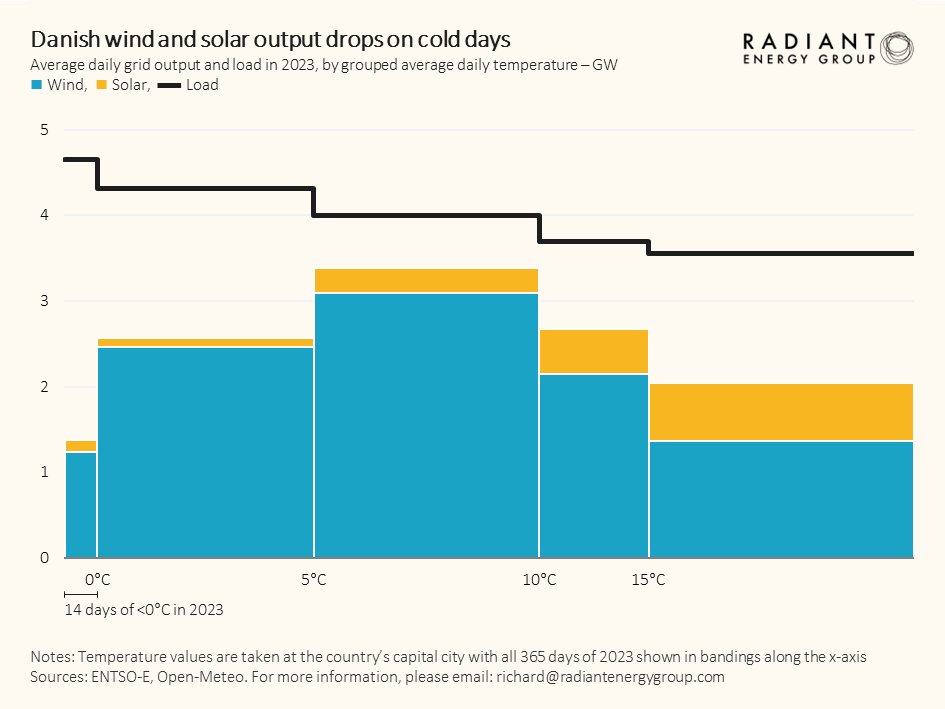
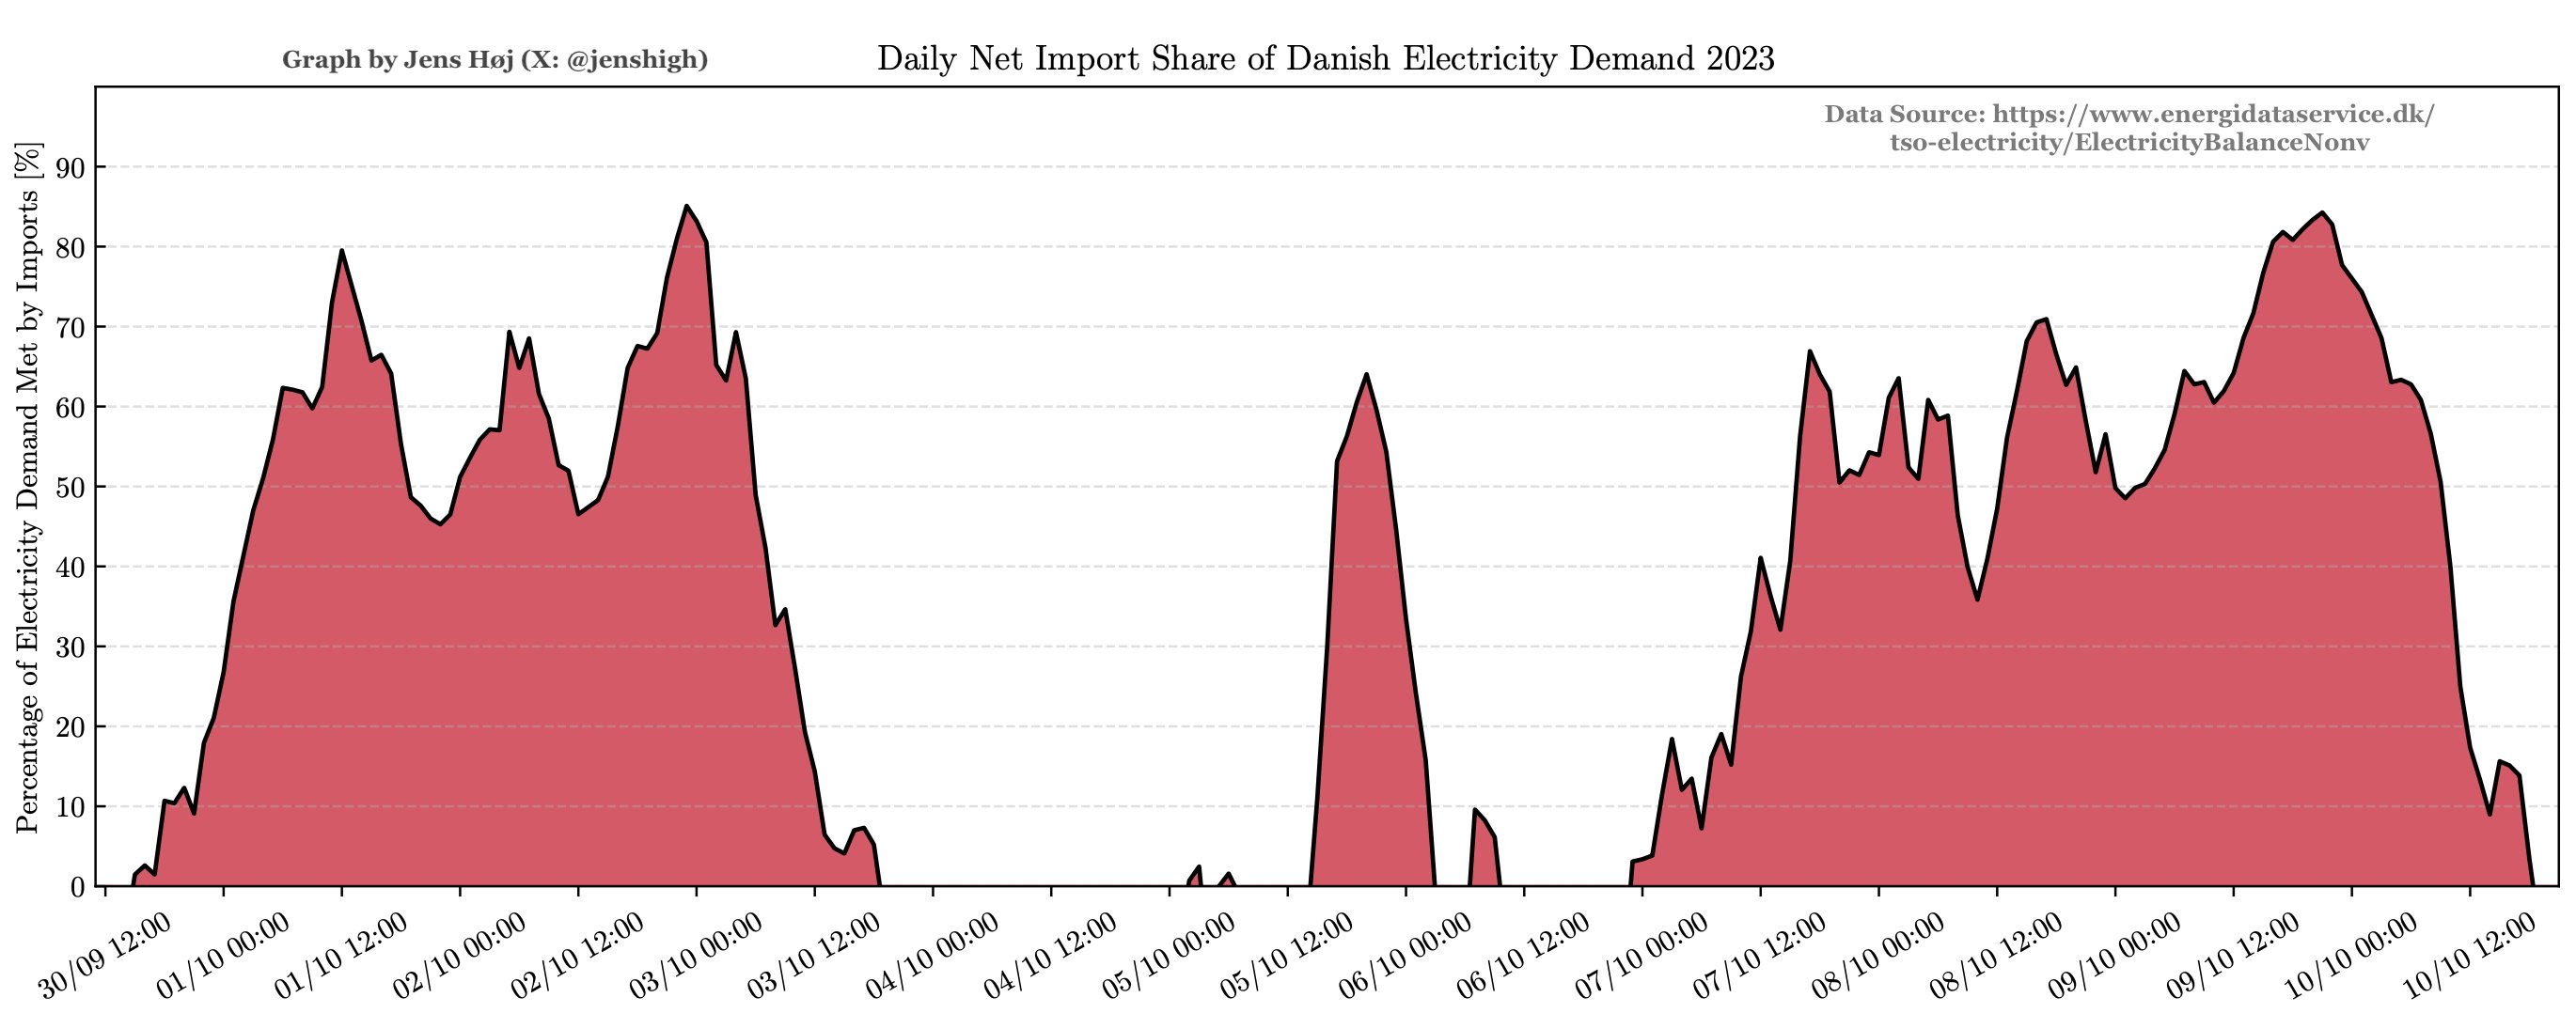
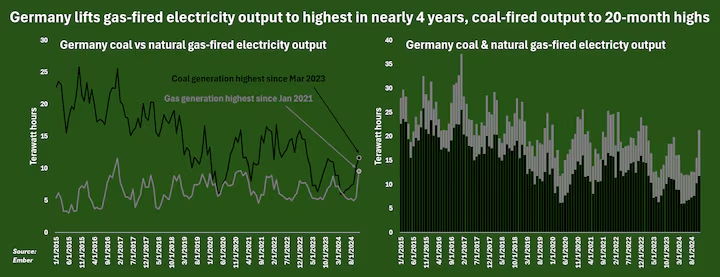
On July 1, U.S. Federal Judge James Cain Jr. (Western District of Louisiana) issued a preliminary injunction suspending DOE’s LNG exports “pause.” The judge’s full ruling is attached.
Judge Cain: “It appears that the DOE’s decision to halt the permit approval process for entities to export LNG to non-FTA countries is completely without reason or logic and is perhaps the epiphany of ideocracy.”
Nothing subtle about that comment 😉
Despite the court order, the Administration seems intent on keeping the “pause” in place. Per White House spokesperson Angelo Fernández Hernández, “We remain committed to informing our decisions with the best available economic and environmental analysis, underpinned by sound science.” ????
Nearly 80% of current OCS gas production is from deepwater leases. This production is primarily associated (oil-well) gas that operators are rightfully required to market for resource conservation and environmental reasons. Expanding LNG marketing opportunities could thus improve the economics of deepwater development.
The other 20% of OCS gas production is largely from gas-well (non-associated) gas produced by independent companies that continue to operate in the shallower waters on the shelf. LNG sales could improve the challenging economics for these producers and increase the ultimate recovery of shelf resources.
Add Dunkelflaute to the list of interesting and expressive compound German words. Die Dunkelflaute is a dark lull, a period of time in which minimal energy can be generated by the sun or wind. More specifically in German:
Die Dunkelflaute als sogenanntes Kofferwort beschreibt das gleichzeitige Auftreten von Dunkelheit und Windflaute. Diese Wetterlage entsteht typischerweise im Winter und sorgt für geringe Erträge aus Solar- und Windenergie bei gleichzeitig saisonal hohem Strombedarf. Eine Dunkelflaute kann mehrere Tage andauern. Kommen zu Dunkelheit und Windflaute noch niedrige Temperaturen hinzu, die für gewöhnlich den Strombedarf weiter ansteigen lassen, spricht man auch von “kalter Dunkelflaute.”
Note the prolonged Dunkelflaute (below) during which renewables provided minimal power in the middle of winter.
Unsurprisingly, wind and solar output are the lowest when the temperatures are the coldest. See the Danish summary for 2023 below. Note that wind output was also low when temperatures were above 15 deg. C.
Regional wind energy grids are not always an effective solution as Danish physicist Jens Christiansen, a nuclear energy advocate, has illustrated:
‘The wind always blows somewhere.’ Is that really true though? Here I’ve looked at the capacity factors of wind from five northern European countries in August The winds seem highly correlated, and there is almost a week-long period without significant wind anywhere.
Christiansen illustrates Denmark’s reliance on imported electricity:
We need to talk about Denmark's enormous reliance on importing electricity!
A grid with a high penetration of wind and solar comes with a backside.
Often, for days at a time, imports account for more than 50% of the national electricity demand.
Paraphrasing Margaret Thatcher: “The problem with electricity imports is that you eventually run out of other people’s electricity.” In the U.S., California imports more electricity than any other state and typically receives between one-fifth and one-third of its electricity supply from outside of the state.
Given that massive battery storage is well beyond current capabilities and restrictions on electricity consumption and economic growth are undesirable, redundant or complementary power sources are essential for a reliable grid. Natural gas power generation is most responsive to variable demand, and is thus a good complement to variable sources like wind turbines and solar panels.
A new report ranks eight key energy industry sectors based on their ability to meet the growing demand for affordable, reliable, and clean electric power generation.
As governments around the nation attempt to impose a transition from traditional energy resources to energy sources open referred to as renewables, natural gas is the energy source that is best suited to integrate with the intermittency inherent in the use of wind and solar. Gas provides a reliable, affordable, and increasingly clean source of energy in both traditional and “carbon-constrained” applications.
Gas faces headwinds in the form of increasingly extreme net zero energy policies that will constrict supplies if implemented as proposed. Gas could also improve overall reliability if onsite storage was prioritized to help avoid supply disruptions that can occur in just-in-time pipeline deliveries during periods of extreme weather and demand.
Pictured: pig for cleaning gas pipelines. Will Nord Stream’s suit against the insurers unplug investigation findings?
Nord Stream AG has sued insurers Lloyds and Arch in the English High Court for failing to pay for pipeline damage incurred during the Sept. 2022 Baltic Sea explosions. The estimated pipeline repair costs range from €1.2 to €1.35 billion, and Nord Stream is seeking €400 million from the insurers.
Could this litigation help us learn more about the findings of the official Nord Stream investigations? After 17 months of investigation, Denmark recently concluded that “there are not sufficient grounds to pursue a criminal case in Denmark.” Only nineteen days before Sweden had announced that “Swedish jurisdiction does not apply and that the investigation therefore should be closed.” These weak announcements at the end of lengthy investigations seem too convenient, and may lend credence to Hersh’s Nord Stream account or a recent variation that implicates the UK. Germany is presumably still investigating, and it remains to be seen whether they will release findings.
Could the parties in the Nord Stream case pursue documents or testimony from the Swedish, Danish, or German investigation teams? Both sides in this case, Nord Stream AG and the insurers, would benefit from details that could help identify the responsible parties.
Putin suggests that people consider who had an interest in sabotaging the pipelines and who had the capability. He also asks why Germany isn’t allowing gas to flow through the one Nord Stream line that wasn’t damaged.
A friend owns land in the Texas Permian. His family gets a nice royalty check every month that has helped them get through some difficult times. Texas Permian production is almost entirely from private land, which is a big part of the success story. Payments to private land owners by responsible producers engender public support, access to resources, and growth in production. Add to that the continuous improvements in horizontal drilling, well stimulation and completion practices, and you have the success story that is the Texas Permian.
Similarly, private and state land plus technology launched the natural gas boom in my native state of Pennsylvania. When I was a student, we looked back at the Titusville/Colonel Drake glory days, and no one dreamed that the state would become a major natural gas exporter. Today, pipeline constraints, particularly in NJ and NY (which has managed to prevent access to the state’s substantial Marcellus and Utica shale resources) are preventing PA from further increasing gas sales.
The offshore lands on the US Outer Continental Shelf are a different story. Unfriendly, bordering on hostile, leasing policy (and not just during the current administration) has been partially overcome by advances in deepwater well and facility design that have lowered costs and increased productivity. However, OCS oil production is a fraction of what it could be.
OCS gas production has fallen dramatically since the turn of the century. Ultradeep (subsurface) gas production was not economically viable and production was fading even before onshore shale gas began to dominate US gas markets. Most of the current OCS gas production is associated with deepwater oil production.
Less attention has been given to natural gas’s other important air quality advantages – low NOx. SO2, and particulate emissions. These emissions have greater local significance from a human health standpoint. Those who have ridden a bike behind a natural gas powered bus have no doubt experienced the natural gas advantage firsthand.
The latest World Bank data tell us that significant gas flaring issues persist. Worldwide, 138,549 million m3 of gas were flared in 2022. This equates to a massive 4 tcf, the equivalent of the reserves in a major gas field and more than 5 times the total gas production in the Gulf of Mexico in 2022.
The top ten “flarers” are listed below. Each of these fields flared from 19 to 42 bcf. For comparison, the top ten GoM gas producers in 2022 produced 10 to 57 bcf, so single fields are flaring more than GoM companies are producing in total. Assuming for discussion purposes a gas-oil ratio of 1000 cu ft/bbl, all of the gas associated with 19 million to 42 million barrels of oil production was wasted from each field.
Posted below are the World Bank’s flaring intensity data (m3 of gas flared per bbl of oil produced) for the 10 countries with the highest flaring volumes. Venezuela’s flaring intensity rose to 44.6 m3/bbl in 2020, before declining moderately the following 2 years. 44.6 m3/bbl equates to 1575 cu ft/bbl. This gas flaring to oil production ratio implies that a very high percentage of Venezuela’s associated gas production was flared.
Here in North America, we have flaring issues of our own. Mexico’s Cactus Field is a top ten flarer (first table above) with 534.5 million m3 flared in 2022. The World Bank also lists 6 Permian Basin fields with >50 million m3 of gas flared in 2022.
Zeroing in on the US/Canada offshore sectors, fields with >1 million m3 of gas flared (2022) are listed below. Four of the top 7 are offshore Alaska and Newfoundland where the gas cannot currently be marketed and reinjection, field use, and flaring are the only options. Can production from these fields be better managed to reduce flaring volumes?
A very large increase in OWG flaring in December skewed the 2022 data (921 million cu ft vs 522 million in November, see 2nd chart below). OWG vented and gas-well gas (GWG) vented also spiked in December (third chart). Were these spikes associated with production startups, major compressor issues, administrative/accounting corrections, or other issues?
Although total venting increased by 407 million cu ft (21%) in 2023 vs. 2022, the overall venting trend is still favorable (last chart).
Kudos to ONRR for posting the flaring/venting data.
More regulator/industry transparency on flaring episodes is needed, particularly in light of the PNAS paper and the June 2022 Inspector General Report.
The Department of Energy approved Alaska Gasline Development Corp’s (AGDC) exports of LNG from the project to countries with which the United States does not have a free trade agreement.
Backers of the roughly $39 billion project hope it will be operational by 2030 if it gets investments and all required permits. The LNG would be exported mainly to countries in Asia.