Gulf of Mexico flaring and venting data have been sorted for the years 2015-2021. The reporting of these data is mandatory and strictly enforced, so these ONRR numbers should be accurate.
Biggest surprise: The biggest surprise is that there were no big surprises in the data. The % of gas flared and vented were generally consistent with expectations based on familiarity with historical data.
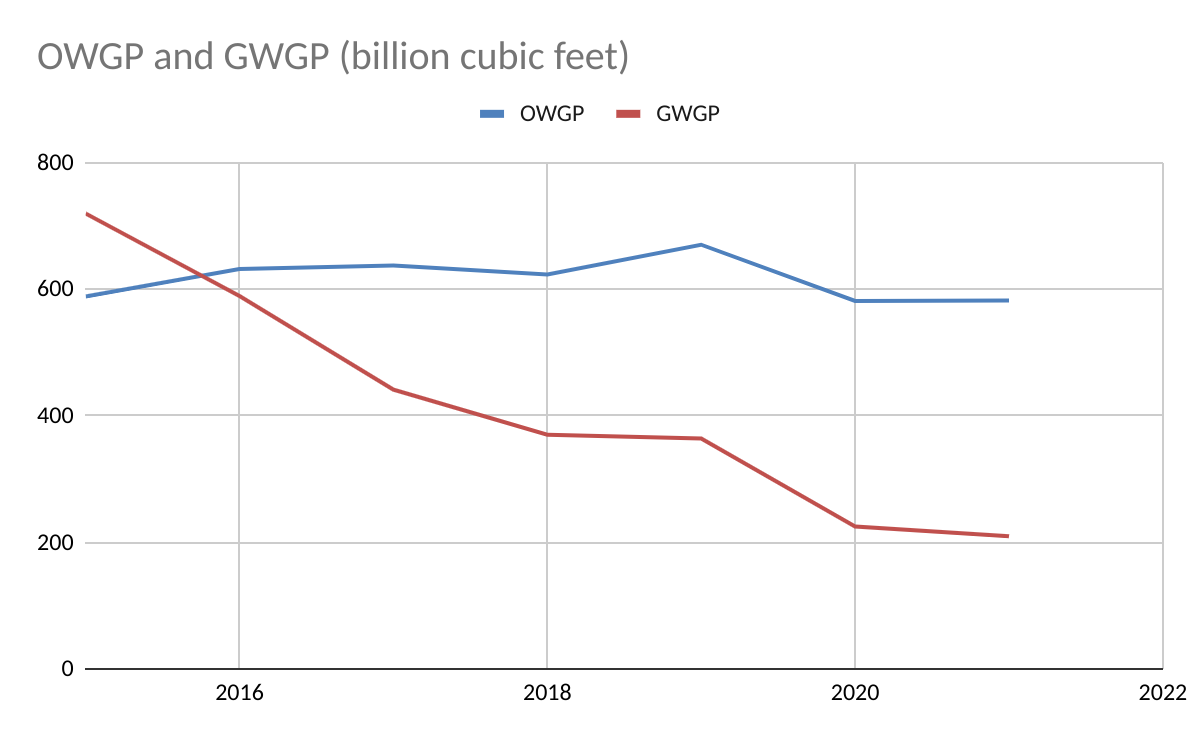
Biggest disappointment: the continued sharp decline in nonassociated (gas-well) gas production. GoM gas well gas production exceeded 4 tcf annually in the 1990s and was still above one tcf ten years ago. Since then, GWG production has declined by 80%. Nonassociated offshore natural gas has important environmental advantages, so the decline in production should be a major concern to policy makers
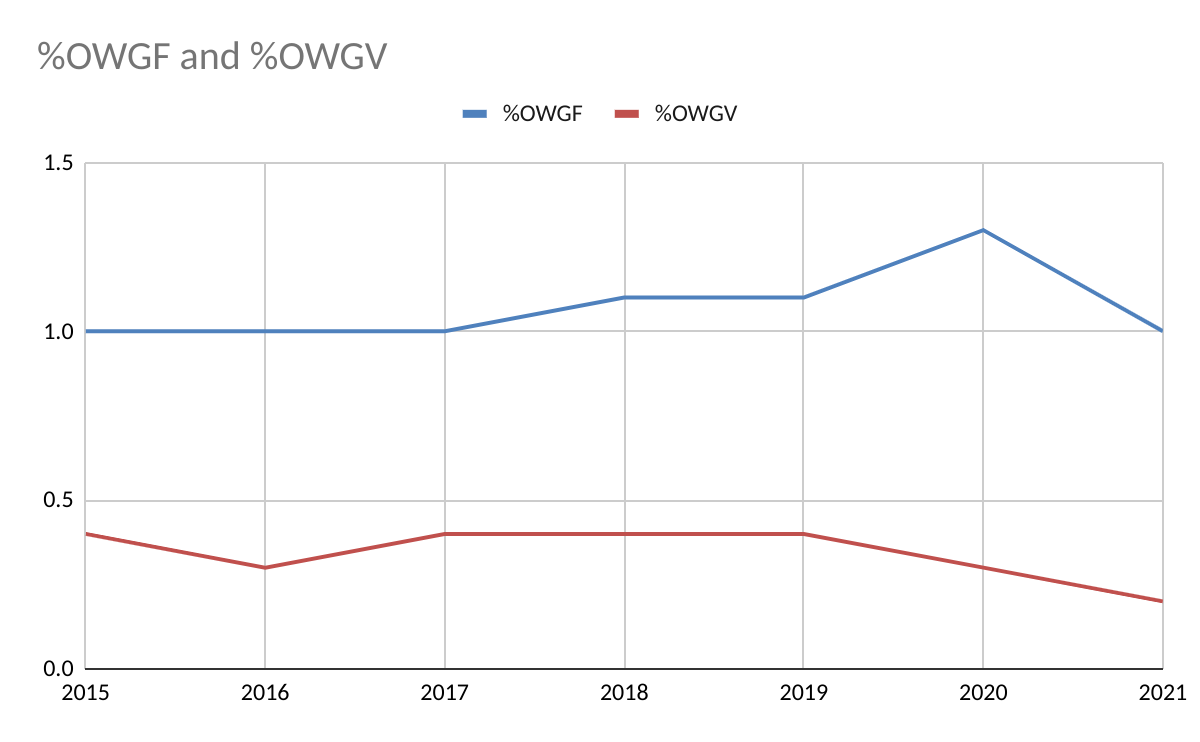
Encouraging sign: The % of oil-well gas vented has ticked down over the past 2 years which is encouraging from a GHG standpoint. This is presumably because most associated gas is produced on modern deepwater facilities equipped with flare booms. An astute politician would be rushing to take credit for this achievement.😀
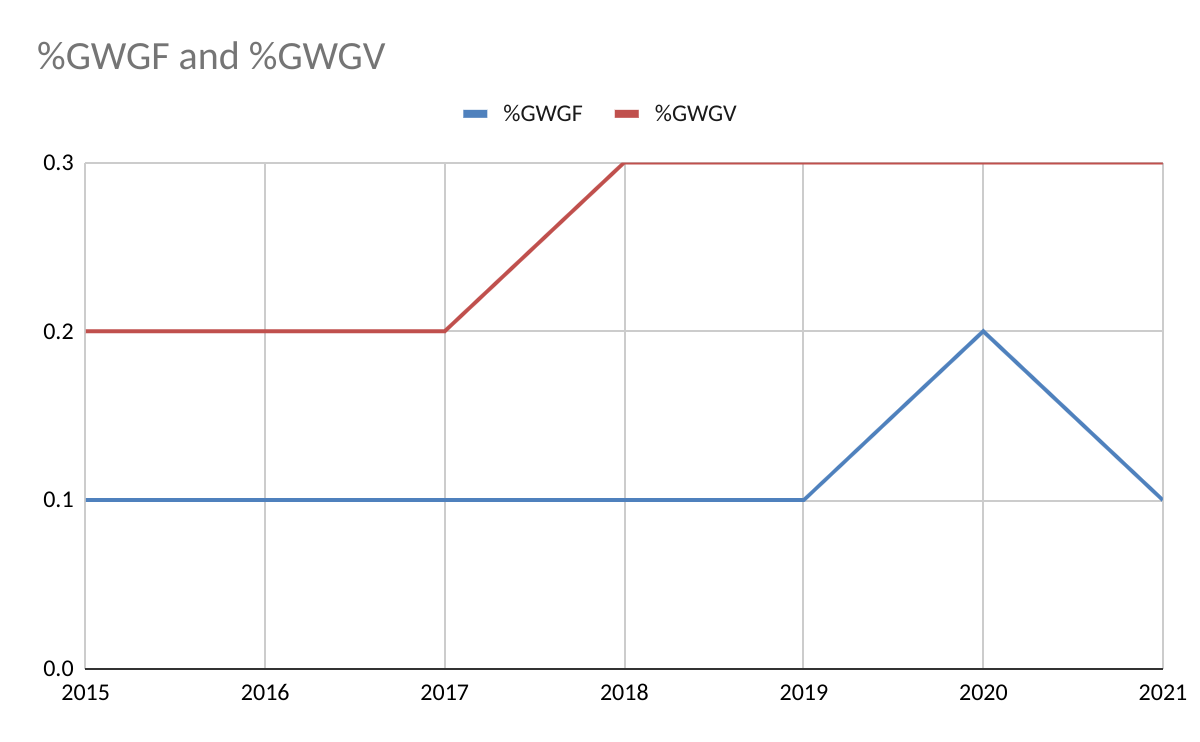
Unfavorable ratio: Although the volumes are low (<1 Bcf combined in 2021), more gas-well gas was vented each year than flared. This is presumably because older shelf facilities without flare booms still produce much of the natural gas.
Abbreviations:
- ONRR: Office of Natural Resources Revenue
- GoM: Federal waters of the Gulf of Mexico
- OWGP: oil-well gas production
- GWGP: gas-well gas production
- OWGF: oil-well gas flared
- OWGV: oil-well gas vented
- GWGF: gas-well gas flared
- GWGV: gas-well gas vented