Feeds:
Posts
Comments

Posts Tagged ‘Hurricane Francine’

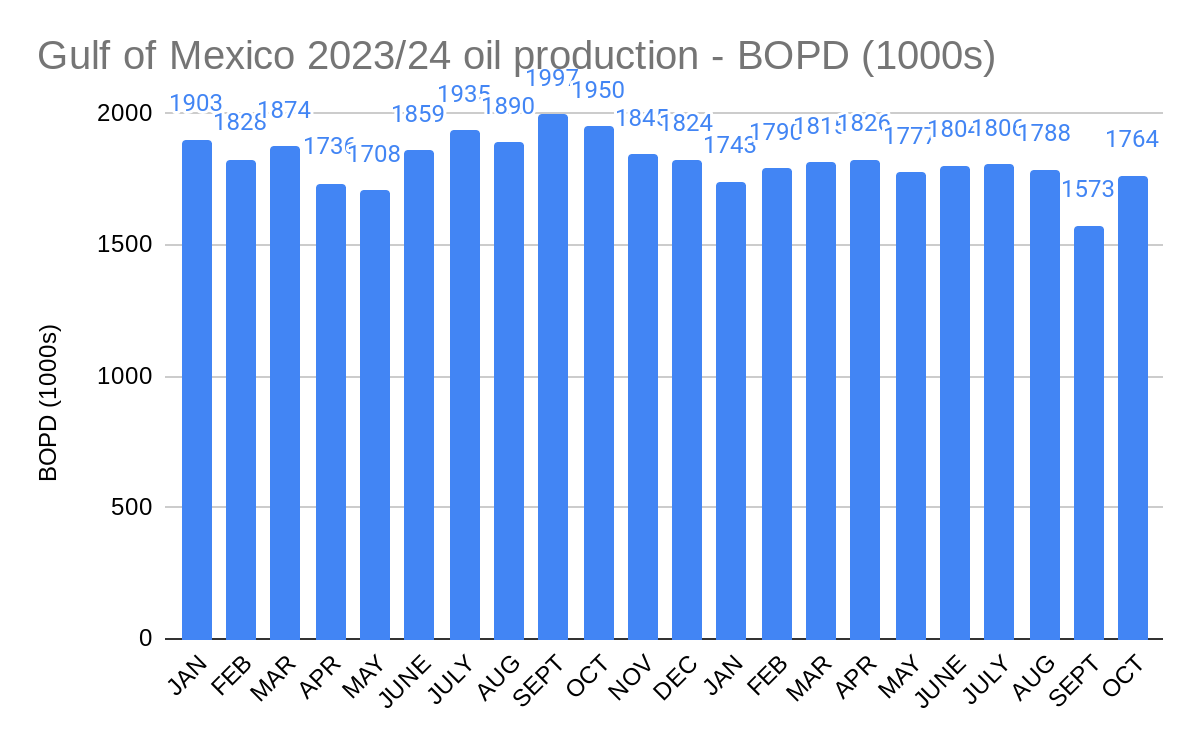
Following the 200,000 bopd decline in Sept. because of Tropical Storms Francine and Helene, Oct. GoM oil production was once again in the normal range for 2024. With the exception of Sept., average 2024 production has been remarkably consistent from month to month.

Read Full Post »

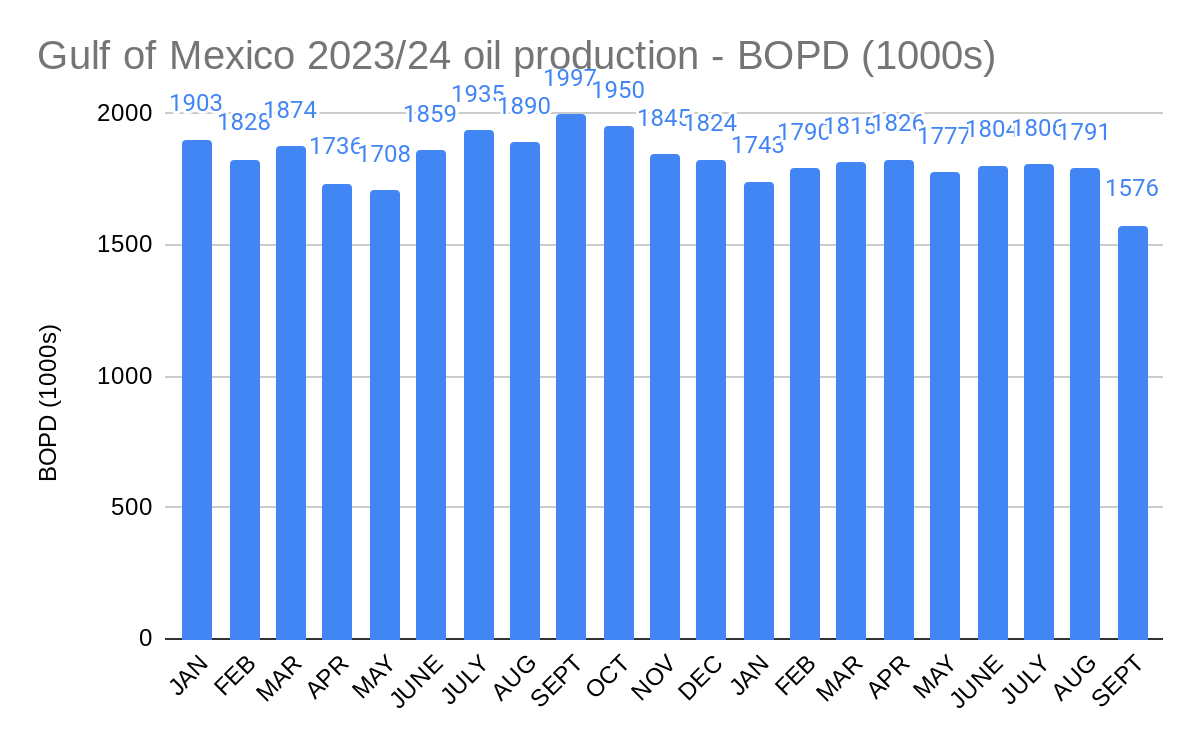
As expected, the Gulf of Mexico’s remarkable 7 month production consistency streak ended in September as a result of shut-ins associated with Tropical Storms Francine and Helene. Nonetheless, average daily production still amounted to 88% of the ~1.8 million bopd average that had been achieved for the previous 7 months. Rather impressive resiliency!

Read Full Post »

The streak of unprecedented Gulf of Mexico oil production stability was extended to 7 months in August.

As a result of shut-ins for Tropical Storms Francine and Helene, the streak will end when the production for Sept. is posted.

Read Full Post »

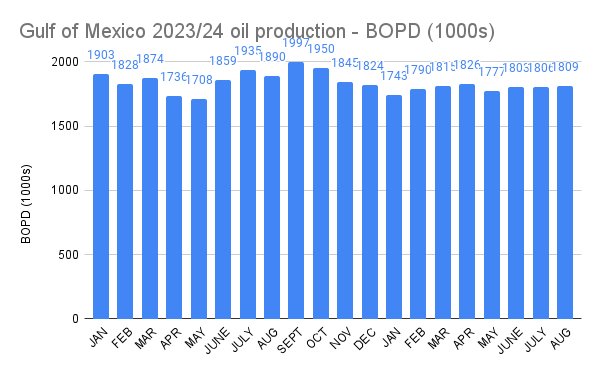
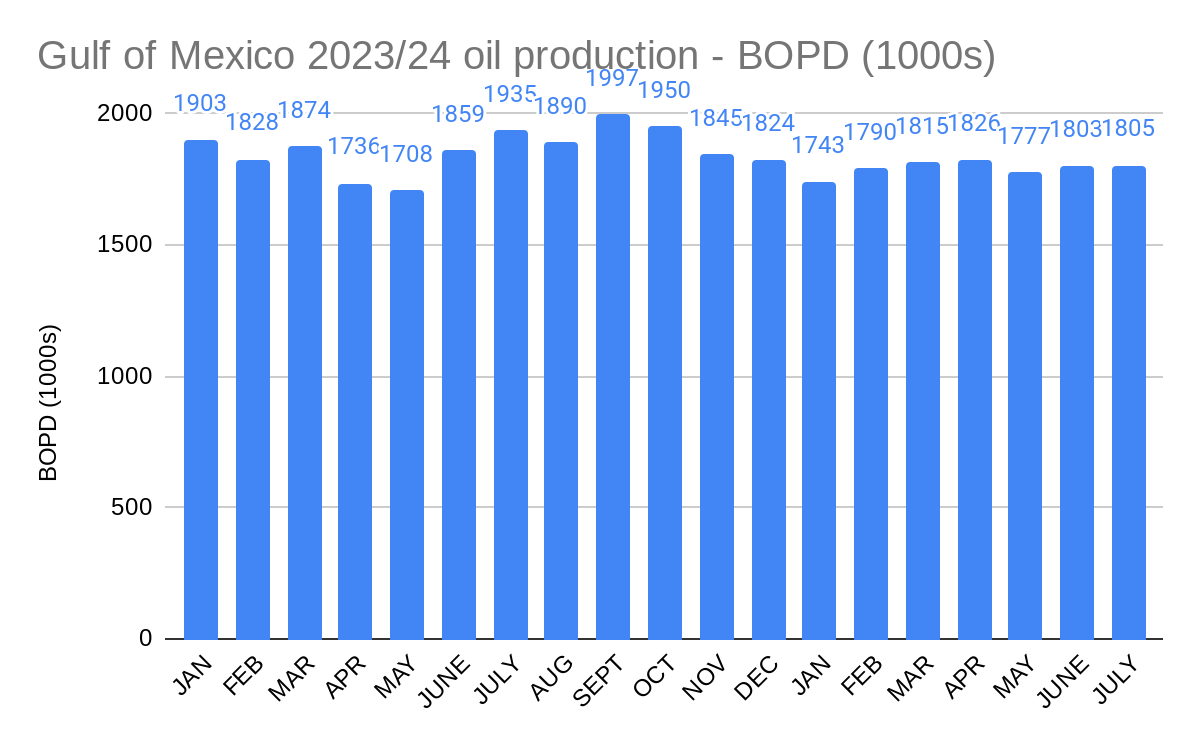
The stability in Gulf of Mexico oil production rates, as noted when the data for June were released, continued into July. Oil production once again remained remarkably consistent at 1.8 million bopd.

Average daily production was within 1.4% of 1.8 million bopd for each month from February to July. As previously observed, this is as stable as production has been for any 6 month period in the past 10 years. I’m not sure this observation is terribly significant, but it’s interesting nonetheless. 😀

If the streak didn’t end in August, it most certainly did in September given the shut-ins for Hurricanes Francine and Helene.

Read Full Post »

5.62% of the oil and 9.68% of the gas remain shut-in.

BSEE data as of 12:30 p.m. ET on the specified date. Peak figures highlighted. The 9/17 report was BSEE’s final update.

date9/109/119/129/139/149/159/169/17
oil s.i.(BOPD)
% of total
412,070
23.55
674,833 
38.56
730,472
41.74
732,316
41.85
522,233
29.84
338,690
19.35
213,204
12.18
101,778
5.62
gas s.i.(MMCFD)
% of total
494
25.56
904
48.77
991.7
53.32
973.2
52.3
755
40.6
514.8
27.64
298
16.02
180
9.68
platform evacs
% of total
130
35
171
46
169
45.55
144
31.81
52
14
37
10
24
6.47
16
4.31
rig evacs
% of total
2
40
3
60
3
60
2
40
0
0
0
0
00
DP rigs moved
% of total
3
15
4
20
2
10
2
10
2
10
2
10
00

Read Full Post »

BSEE data as of 12:30 p.m. ET on the specified date. Peak figures highlighted.

date9/109/119/129/139/149/159/16
oil s.i.(BOPD)
% of total
412,070
23.55
674,833 
38.56
730,472
41.74
732,316
41.85
522,233
29.84
338,690
19.35
213,204
12.18
gas s.i.(MMCFD)
% of total
494
25.56
904
48.77
991.7
53.32
973.2
52.3
755
40.6
514.8
27.64
298
16.02
platform evacs
% of total
130
35
171
46
169
45.55
144
31.81
52
14
37
10
24
6.47
rig evacs
% of total
2
40
3
60
3
60
2
40
0
0
0
0
0
DP rigs moved
% of total
3
15
4
20
2
10
2
10
2
10
2
10
0

Read Full Post »

BSEE data as of 12:30 p.m. ET on the specified date.

date9/109/119/129/139/149/15
oil s.i.(BOPD)
% of total
412,070
23.55
674,833 
38.56
730,472
41.74
732,316
41.85
522,233
29.84
338,690
19.35
gas s.i.(MMCFD)
% of total
494
25.56
904
48.77
991.68
53.32
973.2
52.3
755
40.6
514.8
27.64
platform evacs
% of total
130
35
171
46
169
45.55
144
31.81
52
14
37
10
rig evacs
% of total
2
40
3
60
3
60
2
40
0
0
0
0
DP rigs moved
% of total
3
15
4
20
2
10
2
10
2
10
2
10

Read Full Post »

BSEE data as of 12:30 p.m. ET on the specified date.

date9/109/119/129/139/14
oil shut-in (BOPD)
% of total
412,070
23.55
674,833 
38.56
730,472
41.74
732,316
41.85
522,233
29.84
gas s.i. (MMCFD)
% of total
494
25.56
904
48.77
991.68
53.32
973.2
52.3
755
40.6
platforms evacuated
% of total
130
35
171
46
169
45.55
144
31.81
52
14%
rigs evacuated
% of total
2
40
3
60
3
60
2
40
0
0
DP rigs moved
% of total
3
15
4
20
2
10
2
10
2
10

Read Full Post »

BSEE data as of 12:30 p.m. ET on the specified date.

date9/109/119/129/13
oil shut-in (BOPD)
% of total
412,070
23.55
674,833 
38.56
730,472
41.74
732,316
41.85
gas s.i. (MMCFD)
% of total
494
25.56
904
48.77
991.68
53.32
973.2
52.3
platforms evac.
% of total
130
35
171
46
169
45.55
144
31.81
rigs evacuated
% of total
2
40
3
60
3
60
2
40
DP rigs moved
% of total
3
15
4
20
2
10
2
10

Read Full Post »

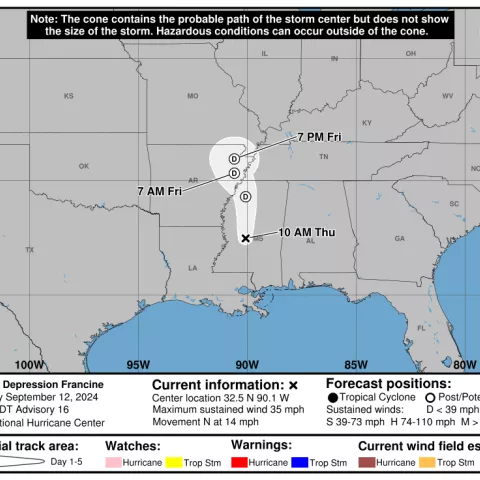
BSEE data for the past 3 days are tabulated below. Data are as of 12:30 p.m. ET on the specified date. Barring offshore or downstream infrastructure damage, production should begin to resume over the next few days.

Prior to the shale boom, when our national production was lower and the OCS accounted for a larger share, these numbers would have had a more significant effect on oil and gas prices. That is not the case today with only a 2.4% rise in WTI prices.

date9/109/119/12
oil shut-in (BOPD)
% of total
412,070
23.55
674,833 
38.56
730,472
41.74
gas s.i. (MMCFD)
% of total
494
25.56
904
48.77
991.68
53.32
platforms evac.
% of total
130
35
171
46
169
45.55
rigs evacuated
% of total
2
40
3
60
3
60
DP rigs moved
% of total
3
15
4
20
2
10

Read Full Post »

Older Posts »