Regardless of one’s opinion about the causes of climate change, minimizing methane emissions makes good safety, conservation, and environmental sense. The emerging international consensus on methane emission reductions thus merits broad industry and governmental support.
Because of the resource conservation mandate in the OCS Lands Act, minimizing the waste of natural gas has been a point of emphasis in the US offshore program for 50+ years. If you couldn’t utilize or market the natural gas, your project wouldn’t be approved. This requirement delayed the entry of some floating production systems into the Gulf of Mexico, but the pipeline network ultimately expanded to support deepwater development with floating units. Those associated with the offshore program are rightfully proud of their success in prohibiting the waste of gas and minimizing flaring and venting.
Despite the historical commitment to restricting flaring and venting, the data suggest that further improvement may be needed. The concerns listed below are based on the compilation and review of flaring and venting data that operators are required to report to ONRR.
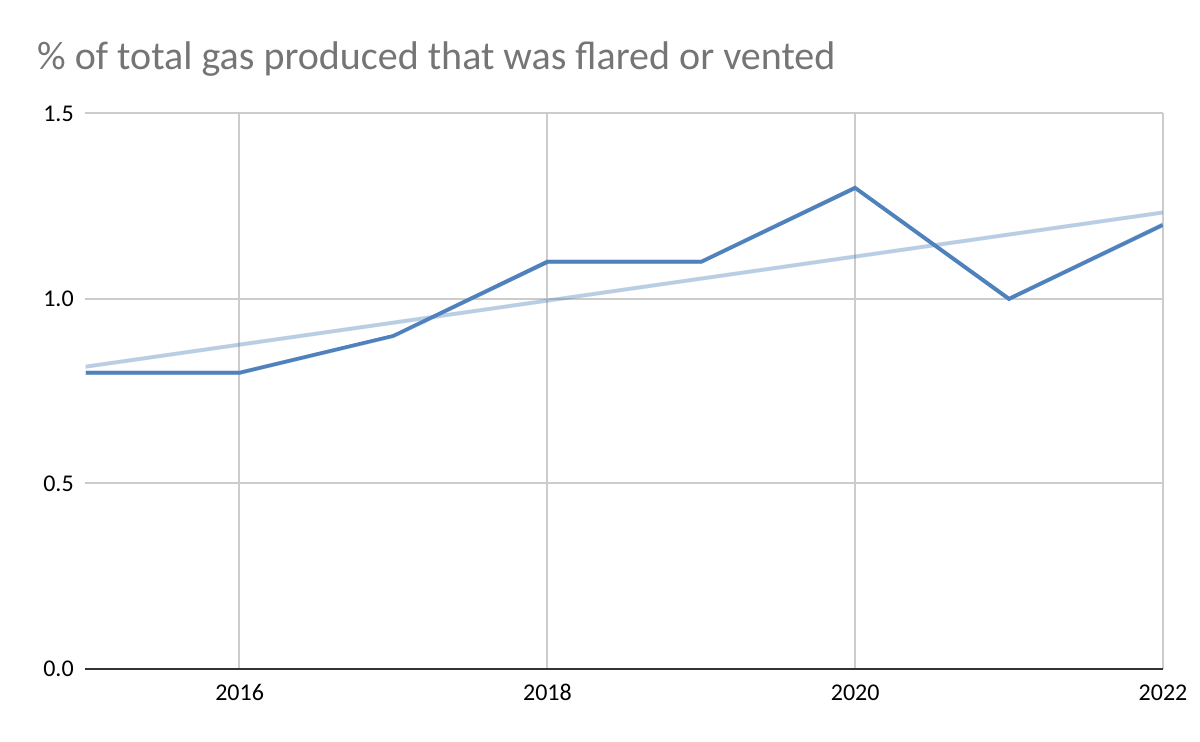
- The % of US OCS gas produced that is flared or vented is trending upward (first chart below).
- Both the gas flaring and venting volumes were higher in 2022 (vs. 2021) despite lower gas production.
- 2022 oil well gas (OWG) flaring volume increased by 18% vs. 2022 despite nearly identical total oil production
- More regulator/industry transparency on flaring episodes is needed, particularly in light of the PNAS paper and the June 2022 Inspector General Report.
- In particular, there should be a process for explaining large spikes in monthly flaring and venting volumes. Were these spikes associated with production startups, major compressor issues, administrative corrections, or other factors?
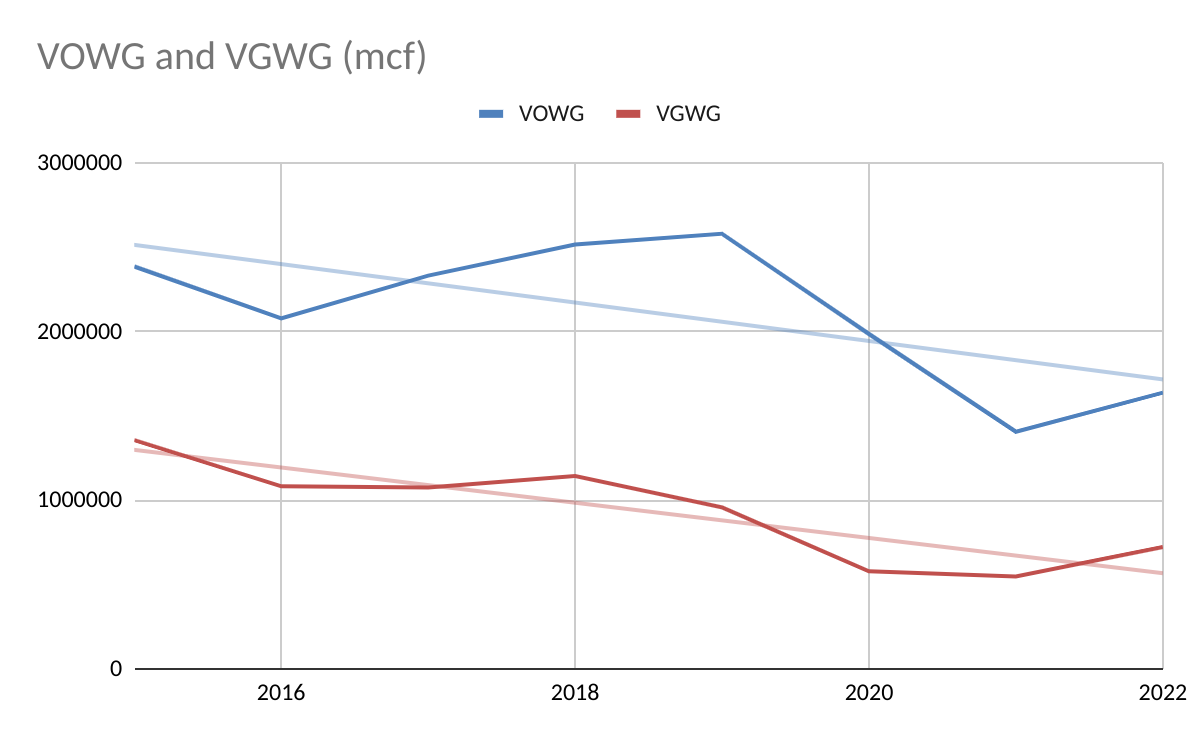
- Venting, which is a more significant environmental concern than flaring, increased by 407 million cu ft (21%) in 2023 vs. 2022. Although the overall venting trend is still favorable (second chart), the 2022 jump should be explained.
- The previously noted inconsistencies in flaring data sets remain a concern.
- The fact that more gas-well gas (GWG) is being vented then flared implies that most such venting is on older shelf platforms (where there are more gas wells).
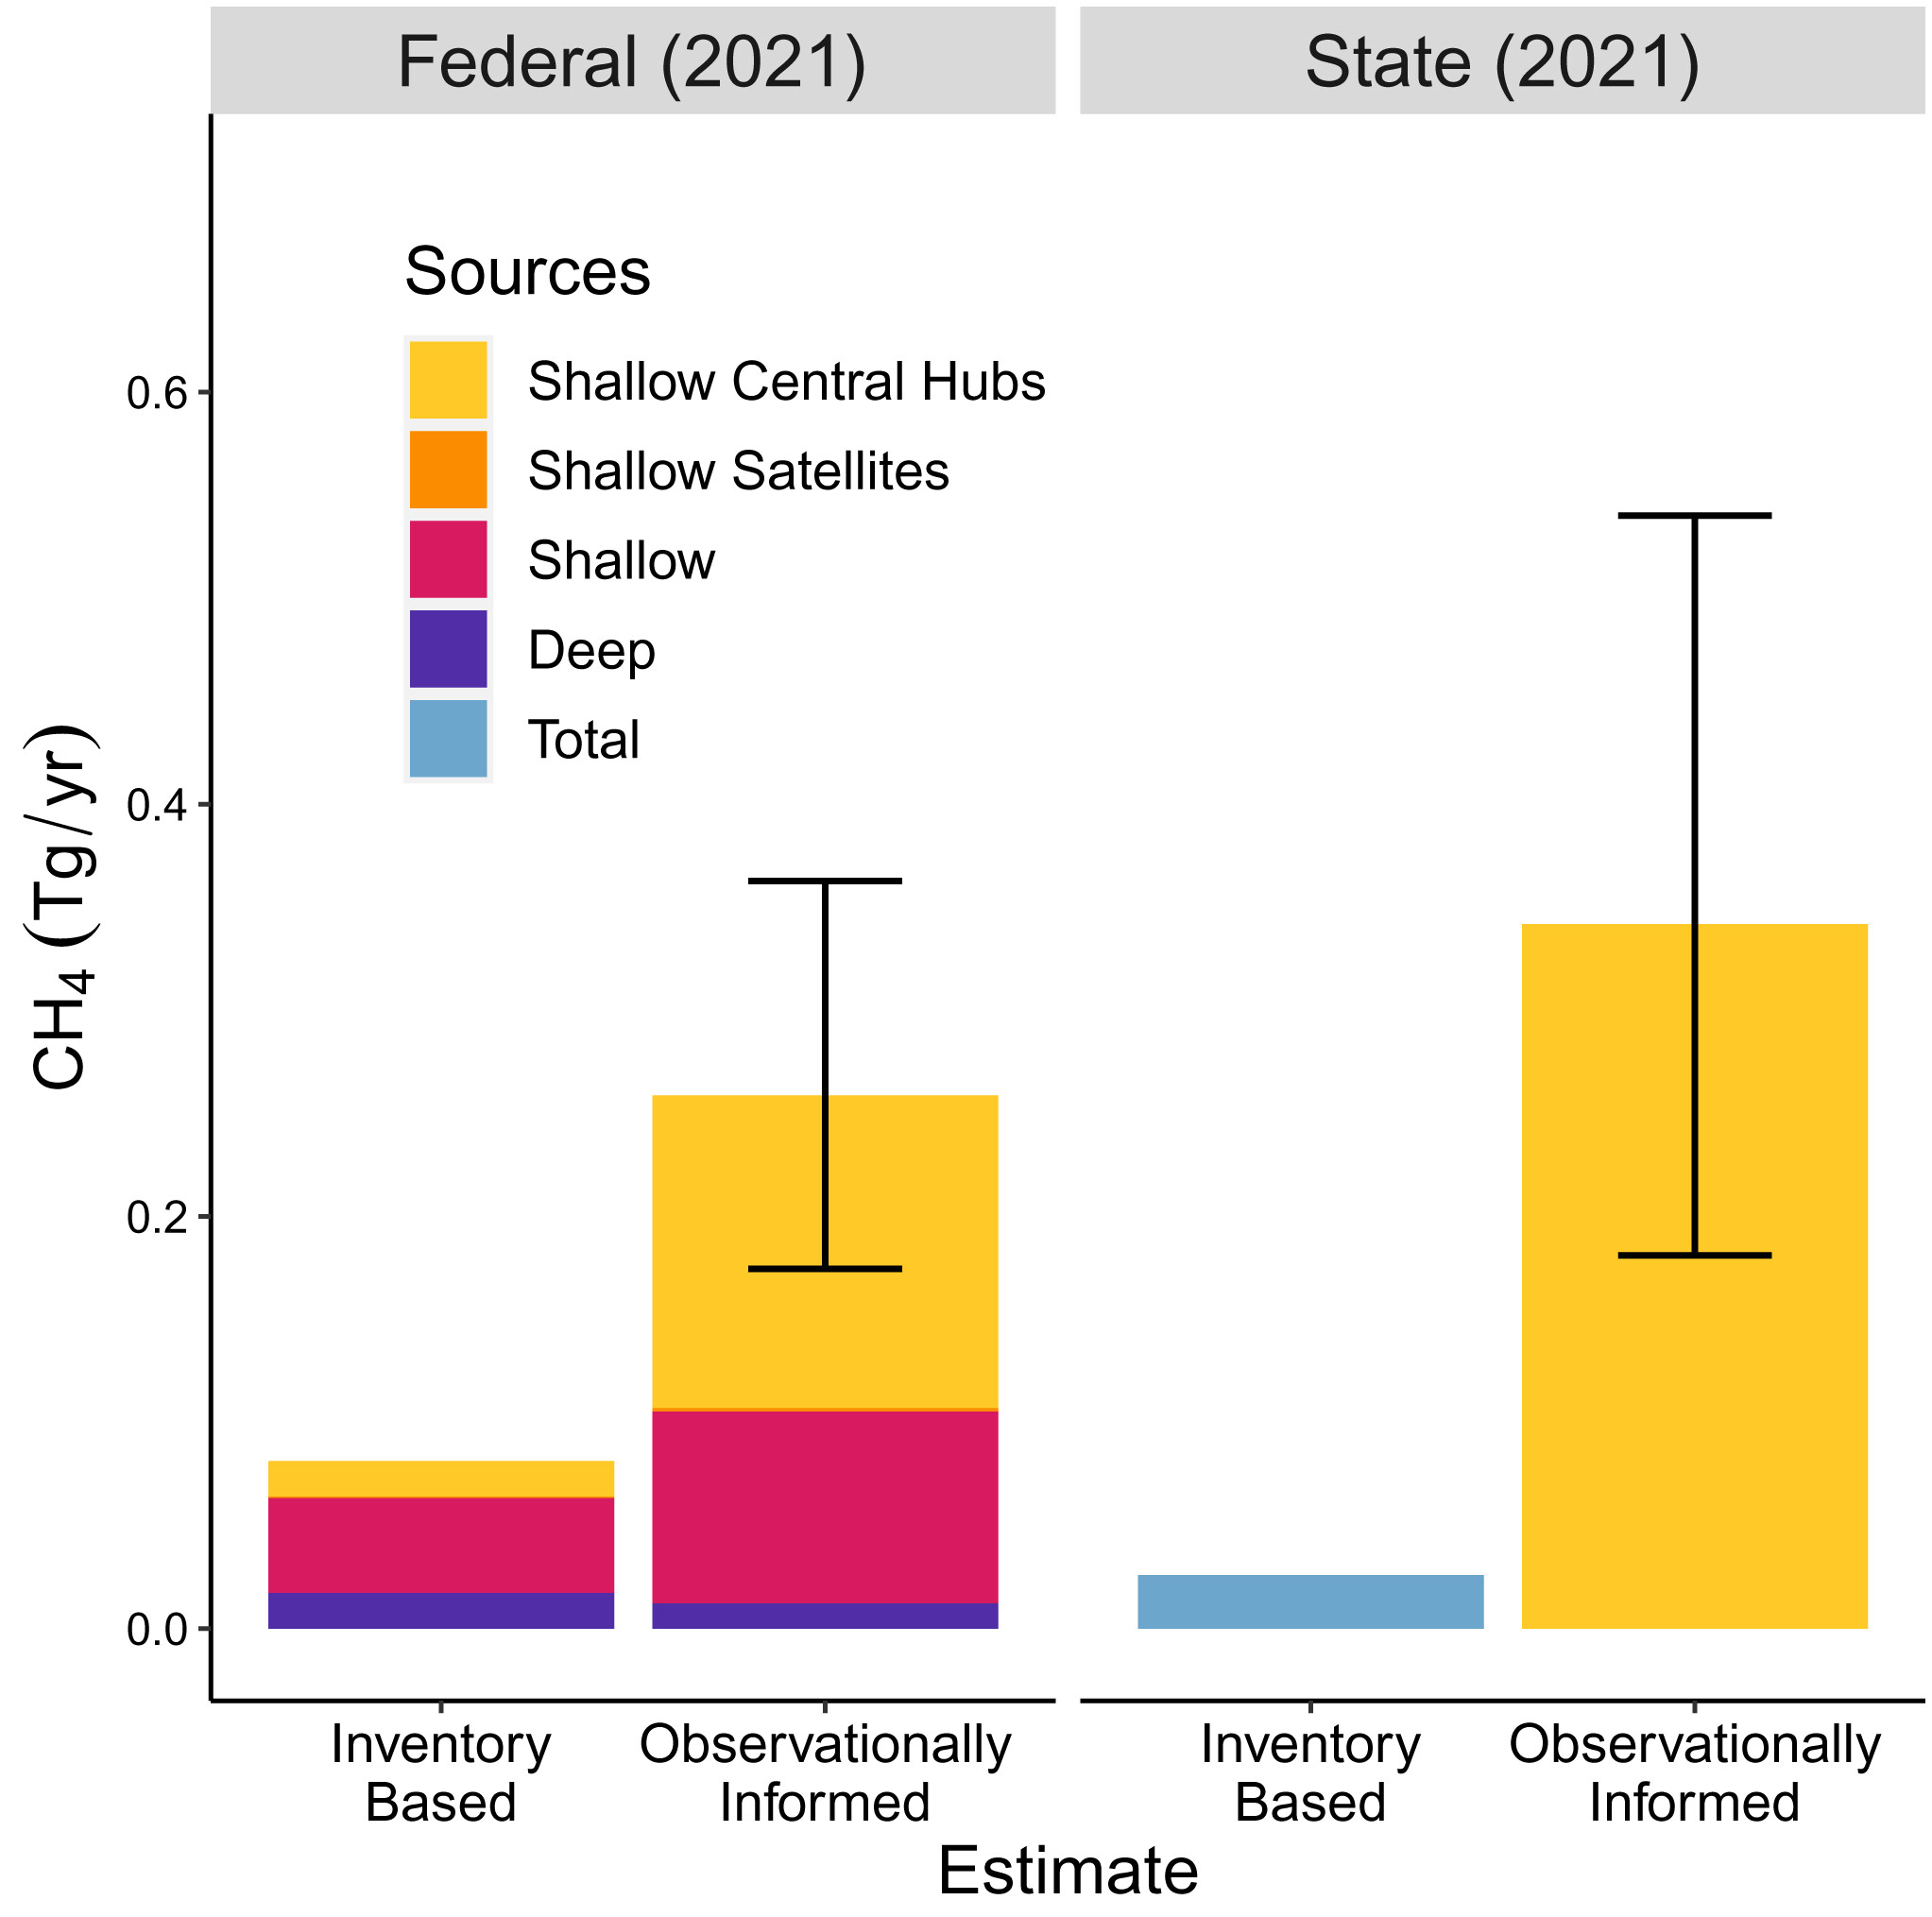
- As summarized in the third chart below, deepwater facility methane emissions are consistent with the reported inventories, but shelf emissions in State and Federal waters differ significantly.
- Regulating venting from older shelf platforms is difficult. About 15 years ago, the Federal government (MMS) considered requiring that older production platforms be retrofitted with flare booms, but safety, space limitations, and cost considerations precluded such a regulation. Instead, additional flaring/venting limits, and measurement and reporting requirements were imposed. What is next for these facilities?
- Compiling and posting flaring and venting data should be a priority for BOEM/BSEE.