Attached are the full results of a Stockton University poll that assessed New Jersey voters’ support for offshore wind development. Stockton’s methodology is explained on the last page of the attachment (also pasted below).
Observations:
- The poll does not appear to be agenda driven, either for or against offshore wind development.
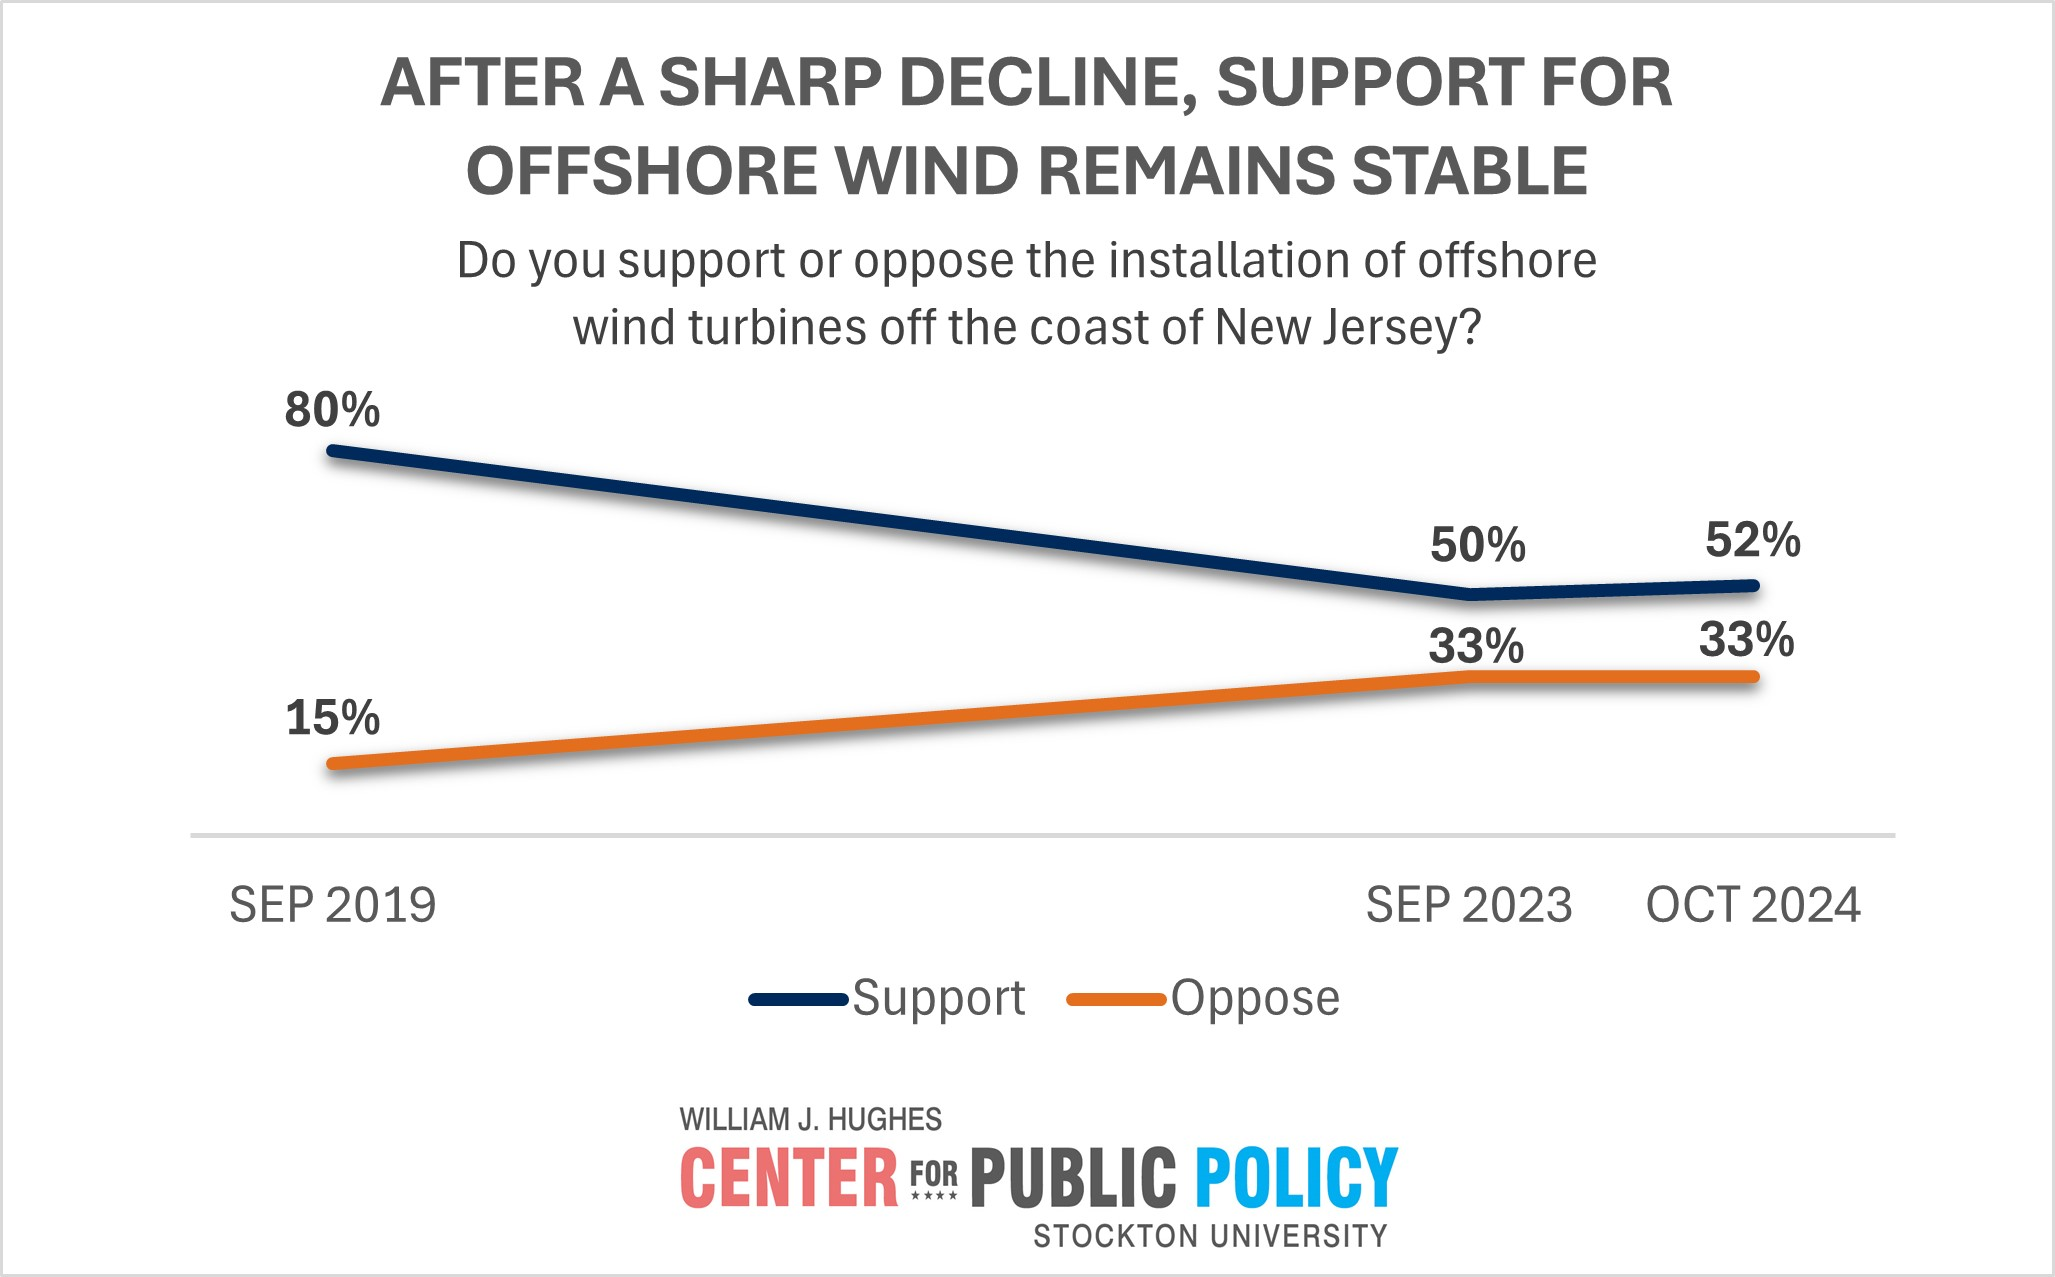
- The sharp decline in public support (first slide below) was contrary to the advocacy flow in that it occurred during a period of strong and persistent State and Federal promotion of offshore wind energy.
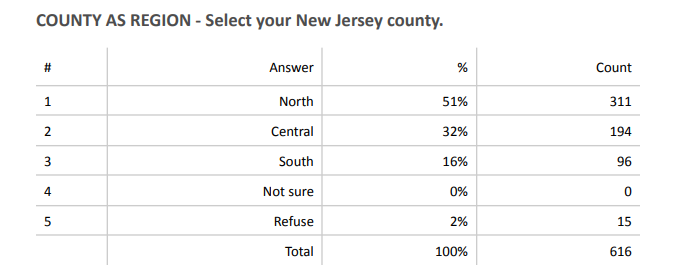
- More than half of the respondents were from North Jersey, the region that is more closely aligned politically with the Governor and the Federal Administration. Only 16% of the respondents were from South Jersey where opposition to offshore wind projects is the strongest. The imbalance is understandable in that it is consistent with the regional imbalance in population.
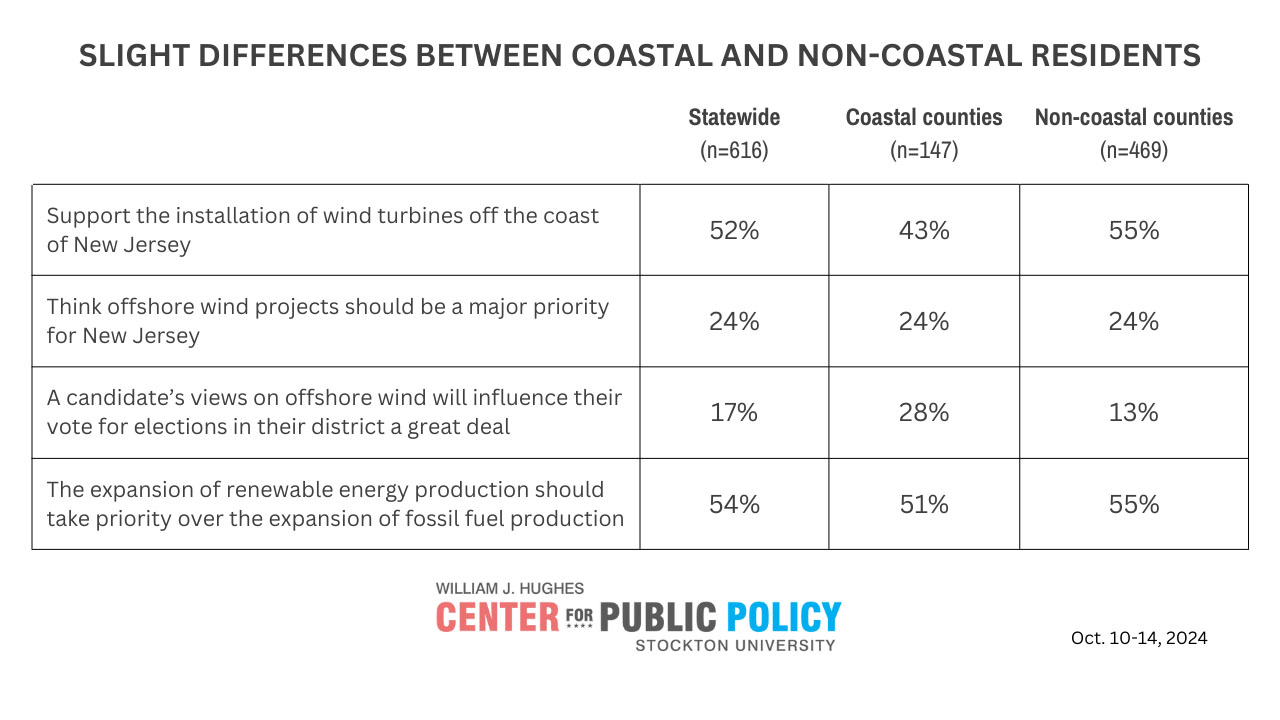
- Unsurprisingly, support for offshore wind is lowest in coastal counties. In that regard, more granularity would have been nice. Cape May County is the US epicenter of resistance to offshore wind development and is engaged in litigation with the Federal government over the Ocean Wind 1 project. Polling specific to Cape May and each of the other coastal counties would be beneficial.
- The polling data suggest that offshore wind projects are not a priority for most New Jersey voters. Only 24% of both coastal and non-coastal residents view offshore wind as a major priority (third slide below).
Methodology
The poll of New Jersey registered voters was conducted by the Stockton Polling Institute of the William J. Hughes Center for Public Policy from Oct. 10-14, 2024. Stockton University students texted cell phones with invitations to take the survey online and Opinion Services supplemented the dialing portion of the fieldwork, which consisted of cell and landline telephone calls. Overall, 91% of interviews were conducted on cell phones and 9% on landline phones. In terms of mode, 65% were reached via dialing and 35% were reached via text-to-web. A random sample of 616 New Jersey registered voters were interviewed. Both cell and landline samples consisted of random digit dialing (RDD) and voter list sample from MSG. Data are weighted based on U.S.Census Bureau ACS 2023 data for the citizen voting age population in New Jersey on variables ofage, race, education level, and sex. The poll’s margin of error is +/- 3.9 percentage points at a95% confidence level. MOE is higher for subsets. Sampling error does not account for other potential sources of bias in polls such as measurement error or non-response.
